
1.61 Momentum Breakouts

This is a concept education post that we’ll also add various strategy based posts for later.
This concept aims to provide a way to understand when it’s better to run positions in a trend and when there’s higher risk of a bigger pullback. It aims to provide a functional way to “Let profits run” often really meaning “Let good trades come back to even” without a good plan of how to do that.
Using this method we have a far greater chance of staying in during real trend breakouts but spotting a possible bigger retracement early in its development. The method can also be used as a counter-trend trading strategy. Always yielding at least 1:3 RR.
This concept is basically a blend of:
1.61 Head Fake Reversal Strategy - by HoleyProfit (substack.com)
The 1.61 Trend Break Strategy - by HoleyProfit (substack.com)
In the latter I said the rules were very similar to my first ever fib based strategy. In this one I’ll explain what that strategy was and how trading this strategy I learned how useful it is to be keeping track of when breakouts reach the 1.61 of the most recent pullback.
1.61 Breakout and Pullback Trade
My first ever strategy was to draw extensions off pullbacks and if the 1.61 level broke I’d place a limit order to enter a retest of the 1.27. I did this because I’d seen various cases of the market doing things like this.
And this worked! It worked pretty damn well. There were some issues with targeting I had to work out along the way but this basic concept of 1.61 break = limit order 1.27 was at one point making me enough money live off in the Forex markets when I was a noob. I really didn’t know anything except basic PA theory and this fib relationship.
For those of you interested, it was during this period. My main bets where shorting the AUD and NZD. Largely against the USD but since the setups were working so well I also expanded it out to anything AUD or NZD was falling against (Which was most things).
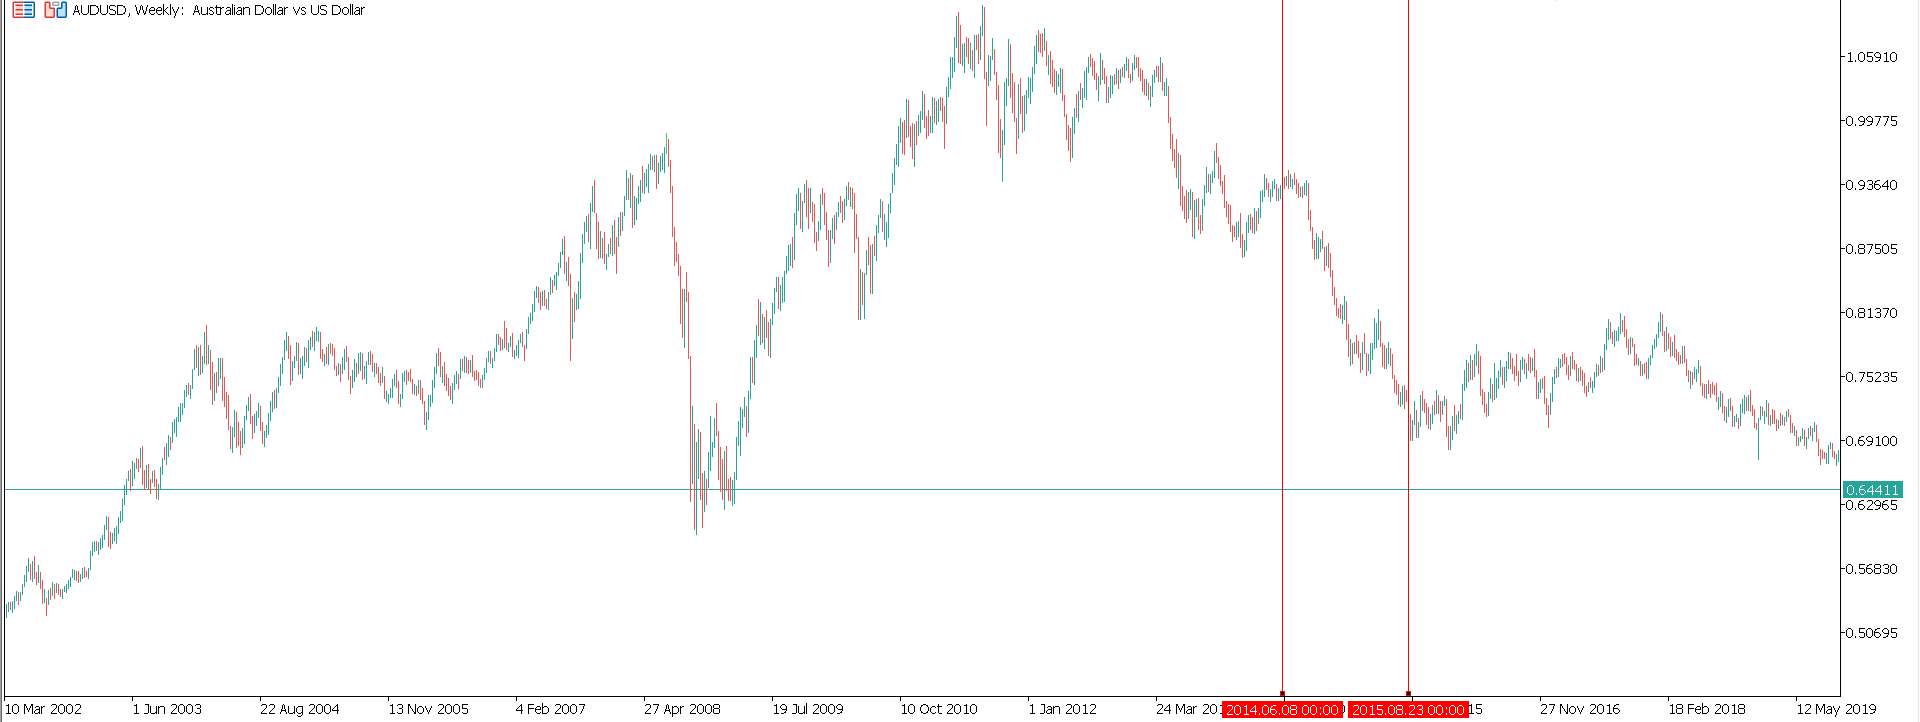
And I thought I was very clever. Guess what happened to my aggressive bear momentum strategy in the year after that.
I still use this basic concept in various situation today. The 1.61 Trend Break Strategy uses these execution rules for trading.
Let’s just say I’ve drawn a fib on a pullback in a downtrend and observed/bet on what happens quite a few times. More than your average person. The 1.61 break, 1.27 retest (With spike out) and then trend to 2.20 or further is a recurring pattern. It happens more than should be expected by random.
The tricky variable here is the 1.27 spike out. How much the 1.27 will spike out by is the least predictable part of this trade. Other than that when this works you can forecast the size and type of move the to 2.20 incredibly well. For a while I thought this was all that you had to know, but it’s not.
This was actually a really well defined strategy. I lucked into that at the time by just noticing a quirk in how useful 1.61 was but what made this a great strategy was from the strategies perspective there were only three possible market moves. The trade worked. 1.61 was the top and stop hit. 1.61 broke and targets hit with no fill.
It’s not complicated. There’s a small area of the chart in which the signal is happening and every time the trade is going to be the same. Some derivative of one of these three moves. Used in the correct context the RR verses expected win rate of this is favourable. This was how I did well with it as a noob while the going was good.
These failed versions of my original trading signal are our focus here. Because better understanding this decision level improves expected returns by being able to better run winners or lock in profits on trades than are set to turn against you. Consistently making the correct decision at that level would be very profitable.
The 1.61 Head-Fake
See first: 1.61 Head Fake Reversal Strategy - by HoleyProfit (substack.com)
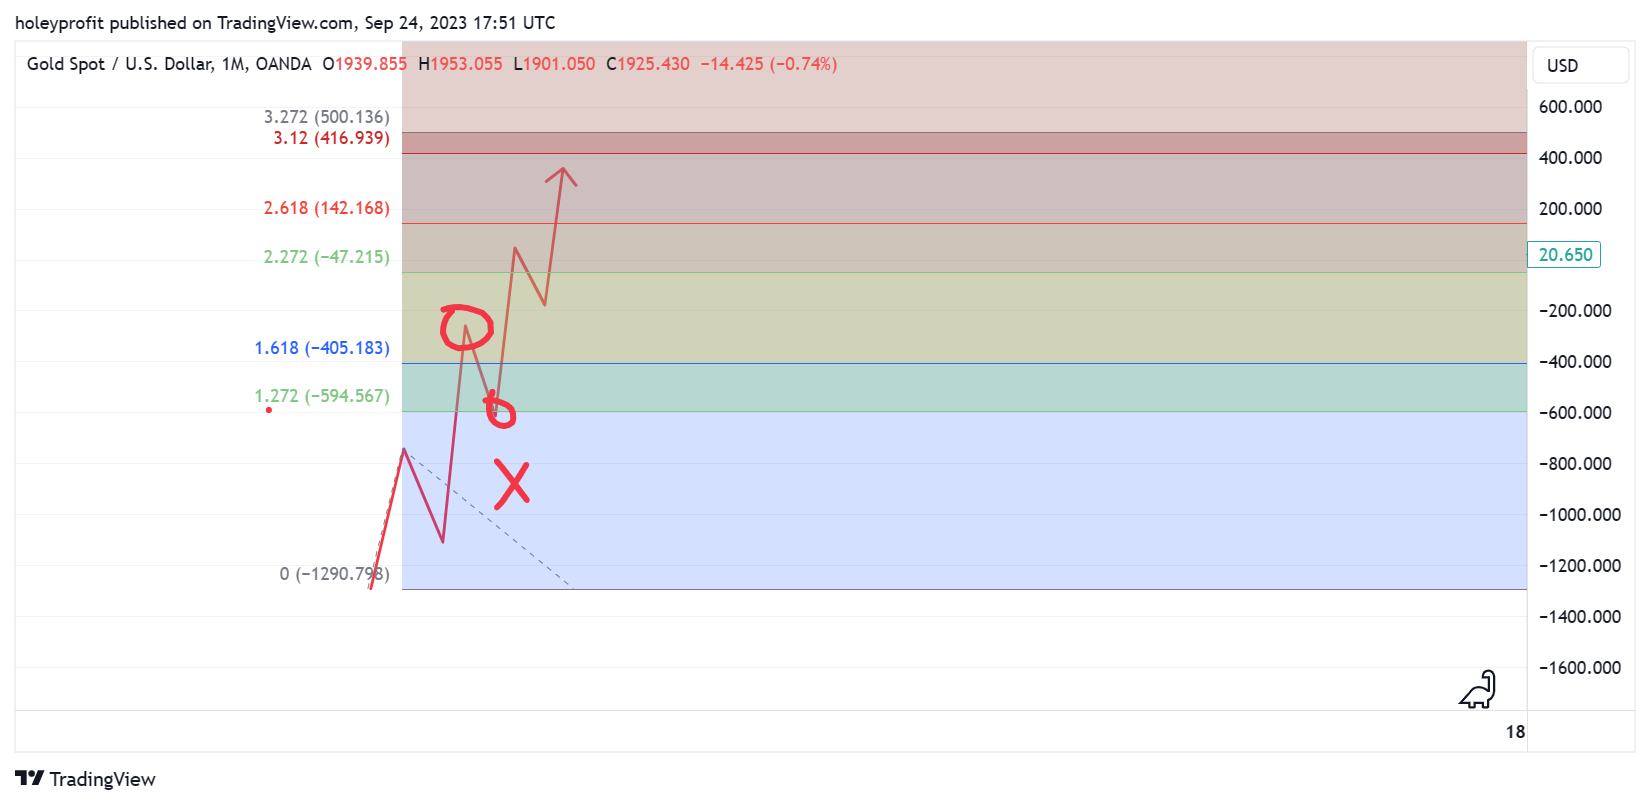
The 1.61 head fake strategy works in a rend because of Elliot wave. When there’s a big pullback, spike in line with the trend and a reversal at the 1.61 level; Usually the bigger pattern in play is Elliot wave 5 into ABC. This strategy works perfectly (Except spike outs) in that swing and also can work in full blown reversals.
This strategy is going to work at the bottom of the first red swing and often at the top of the blue swing.

In those swings, you will always be able to get a target of 1.61 of the final low. Off the wave five low this is a beautiful trade.
1.61 Head Fake Fails
However … If you make the ghastly mistake of thinking you’re seeing wave 5 during wave 3, the 1.61 reversal for 1:3 RR is probably going to work zero times. Liable to produce a lot of signals if you think a 1.61 of every pullback should be a low for an ABC.
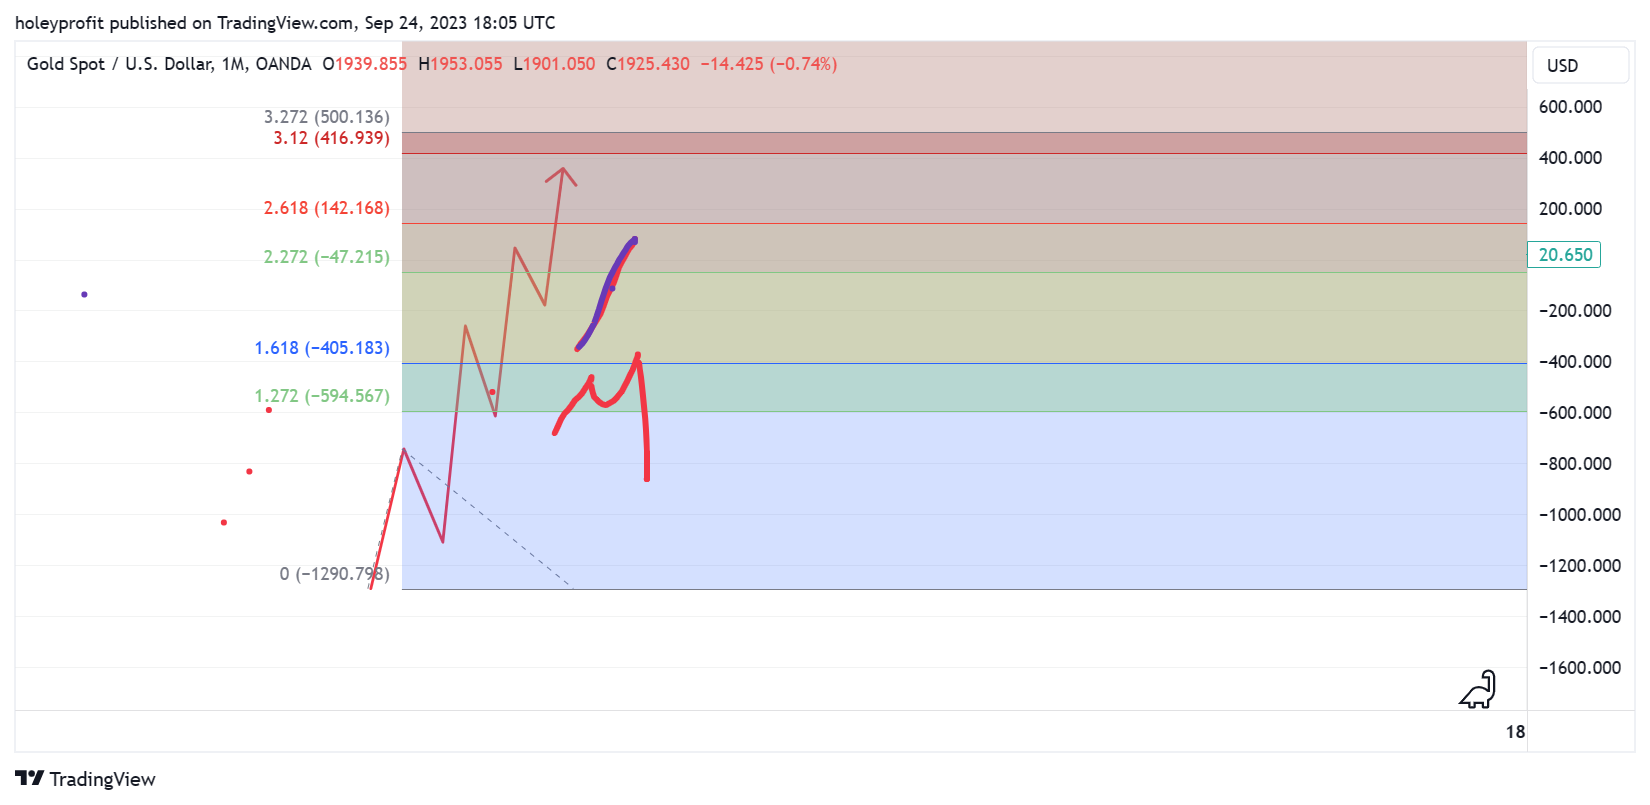
During wave 3 1.61s consistently break and they usually have run through breakouts to the 2.20. From the 2.20 there can be a big correction to the 1.61 and sometimes to spike out the 1.27 (This was where my original strat thrived once I made a few adjustments) and it should not be able to break 1.27. Little spike out, that’s it.
Previous high should not be able to break and once we have seen a breaking of the 1.61 in the downtrend we should be ready to sell the rip on any 1.27 spike out.
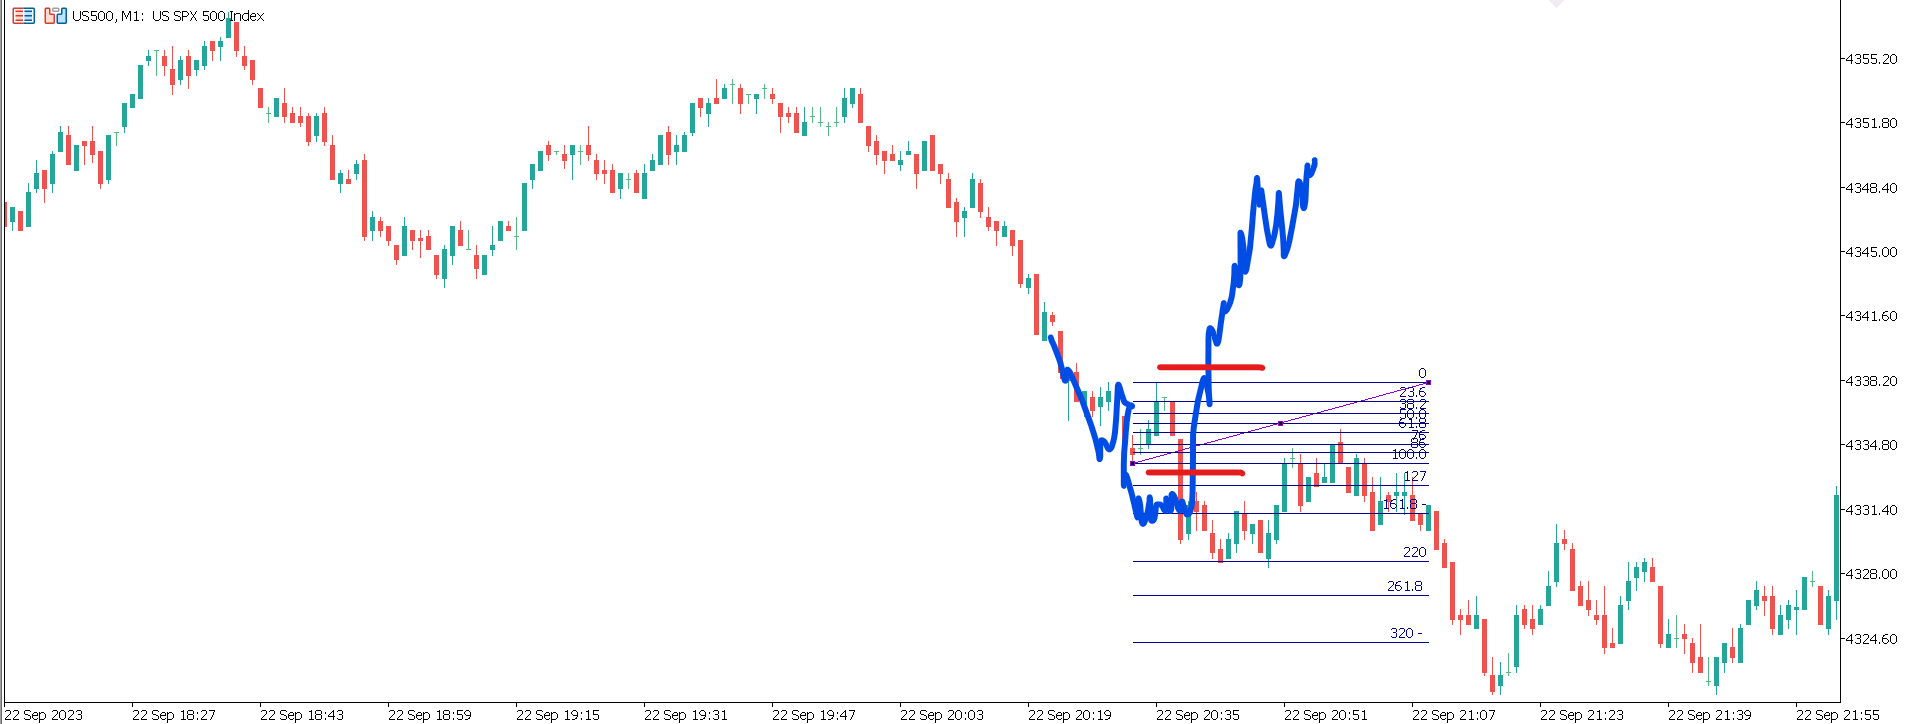
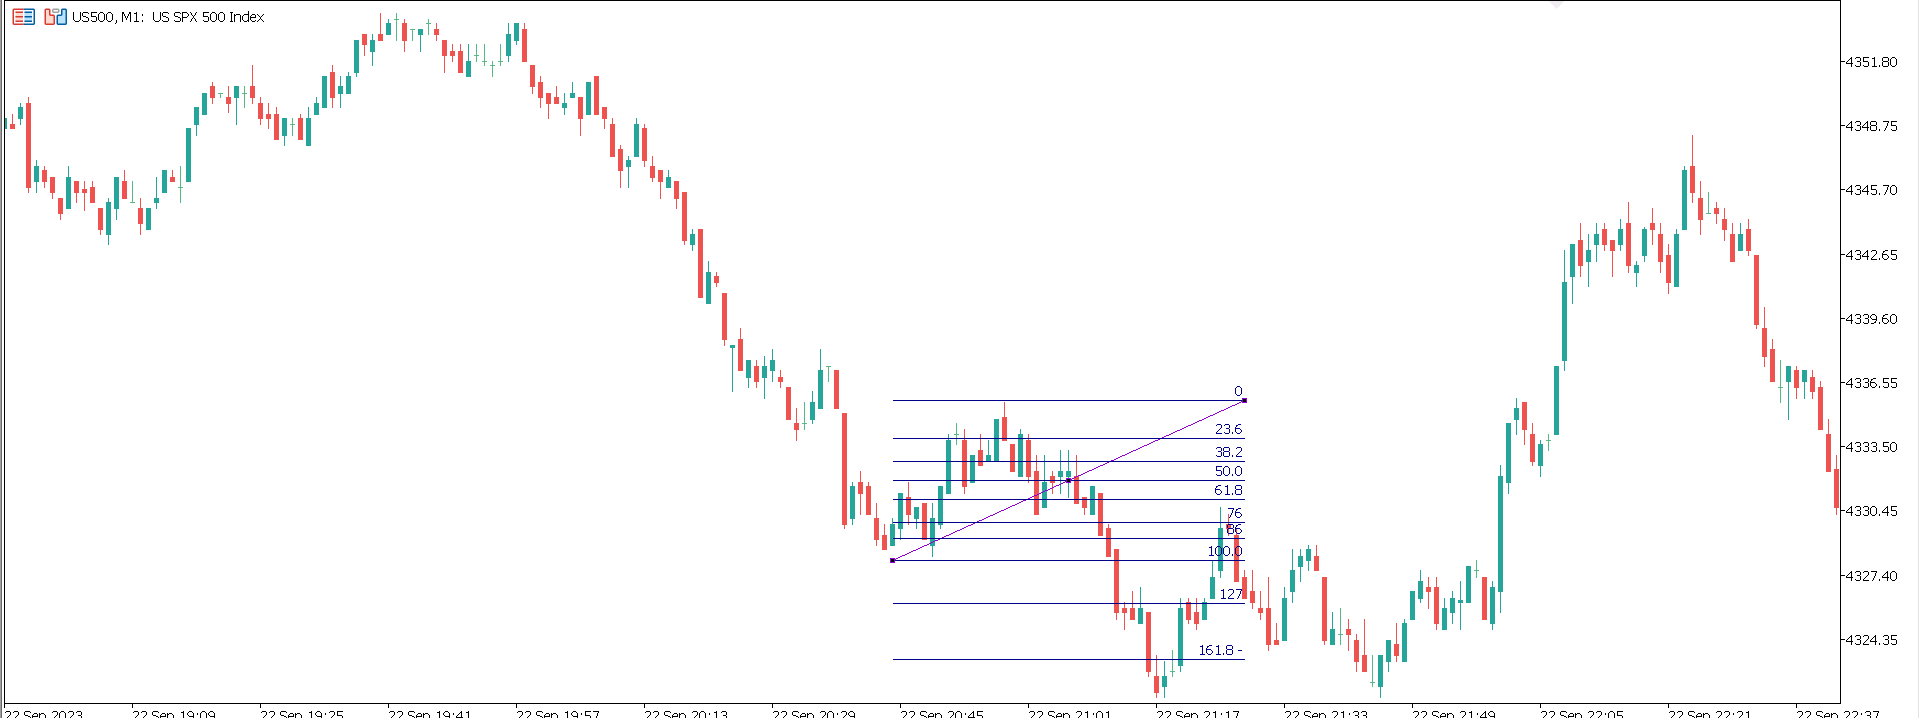
Here’s an example just picked from the last trading day on SPX. A pullback. A low at 2.20. A retracement inside of the last drop. Once 1.27 is broken to the downside and defended the obvious down move comes.
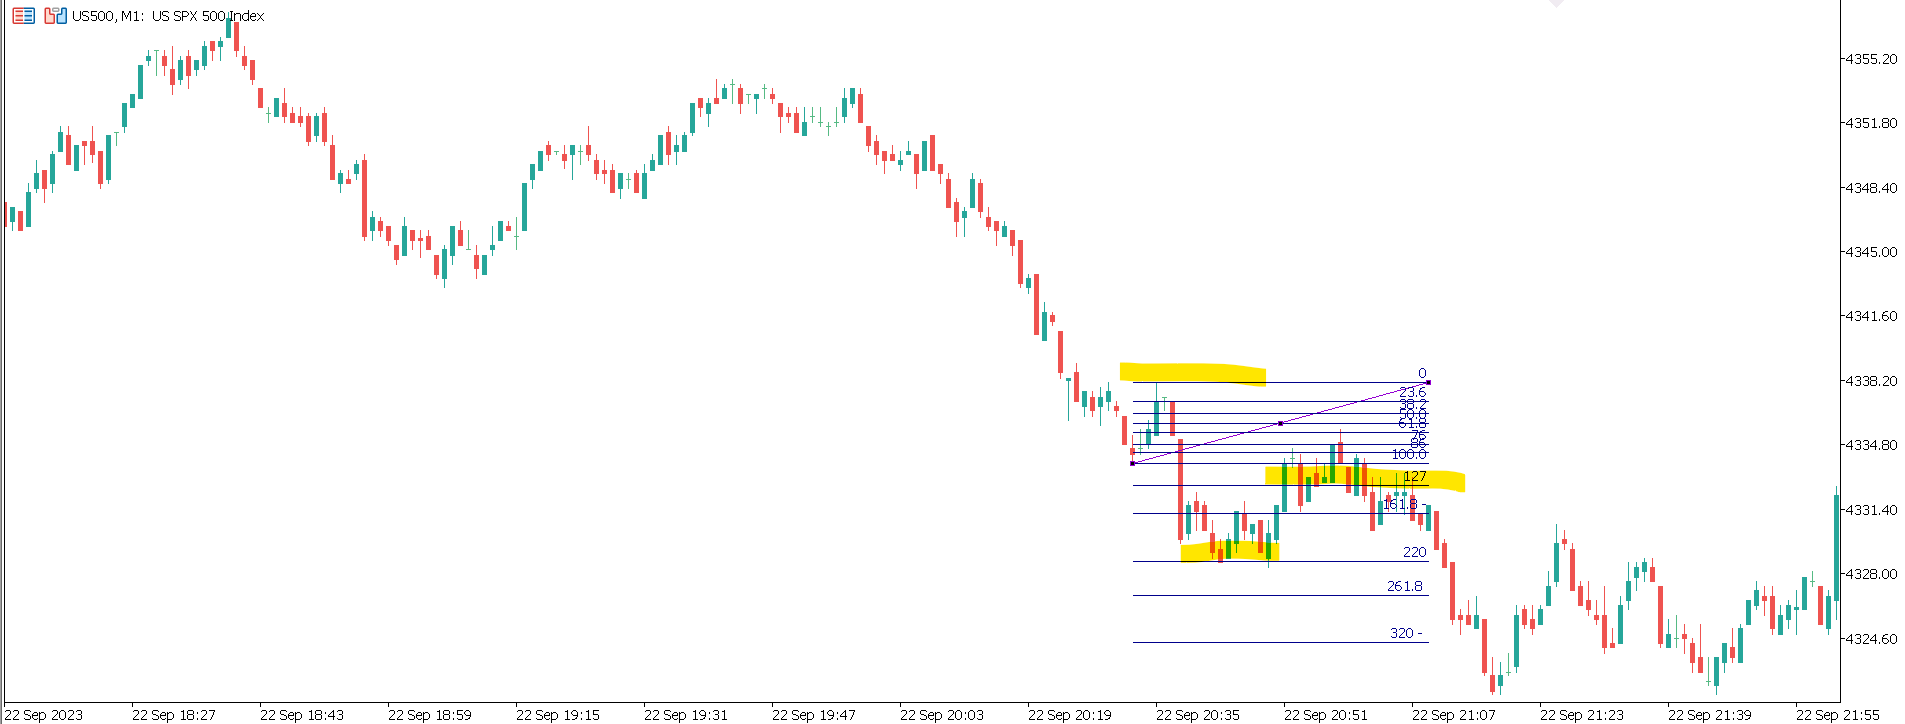
Now … you can see why I thought this made me very clever, right? This trade is very nice when you hit it.
Here’s what I learned that I have found far more net useful than the nice little trade this can produce.
Where a Reversal Fails and Break Starts
This rule has various caveats to it especially when we’re talking about big moves with more stop running but when we’re just talking about the more probable events in day to day trading we can usually determine the reversal has failed and breakout succeeded at the 1.61.
If price does not reverse at the 1.61, then if it does pullback later this is an opportunity to bet on the trend continuing. If it does reverse at the 1.61 it is going to at least break the high of the last pullback. Don’t get me wrong, this is not a perfect rule but it is a consistent rule you can use to inform your bias and know when it’s not working.
When price is dropping here I can be incredibly bearish thinking this is heading far lower and I still am going to be thinking after this pullback is made I have significant risk/opportunity of a big bounce that will correct most of the recent drop and set up the next short.

As we head into the 1.61 I am protecting my profits on running shorts. My stops either trail tight with price action if I really don’t want to give up profits or go behind the last high.
My logic here is if price hits that level it will probably go higher. While I set my stop loss here I set limit orders to short the bounce if it comes. When price makes a clear push lower and hits the 2.20 I think this setup has probably failed. If this setup is failing often the trend is going to be strong with consistent lower highs.

And therefore I know I should be deploying retracement and breakout strategies from here on. This would be invalidated by the previous high breaking.
It is very subtle seeming, but there are very good odds betting if the market has turned at blue it has the potential to have a lot more momentum than if it is turned at red.

If you have shorts on whenever we get to these blue points you trail stops to above the recent highs and set limit orders to enter again.
When following a downtrend I’ll just do this all day long to determine where I have maximum risk of a false breakout and when I have a green light to bet on the trend continuing with a well defined stops loss. Here’s all the instances of this during the drop that led up to the example used.
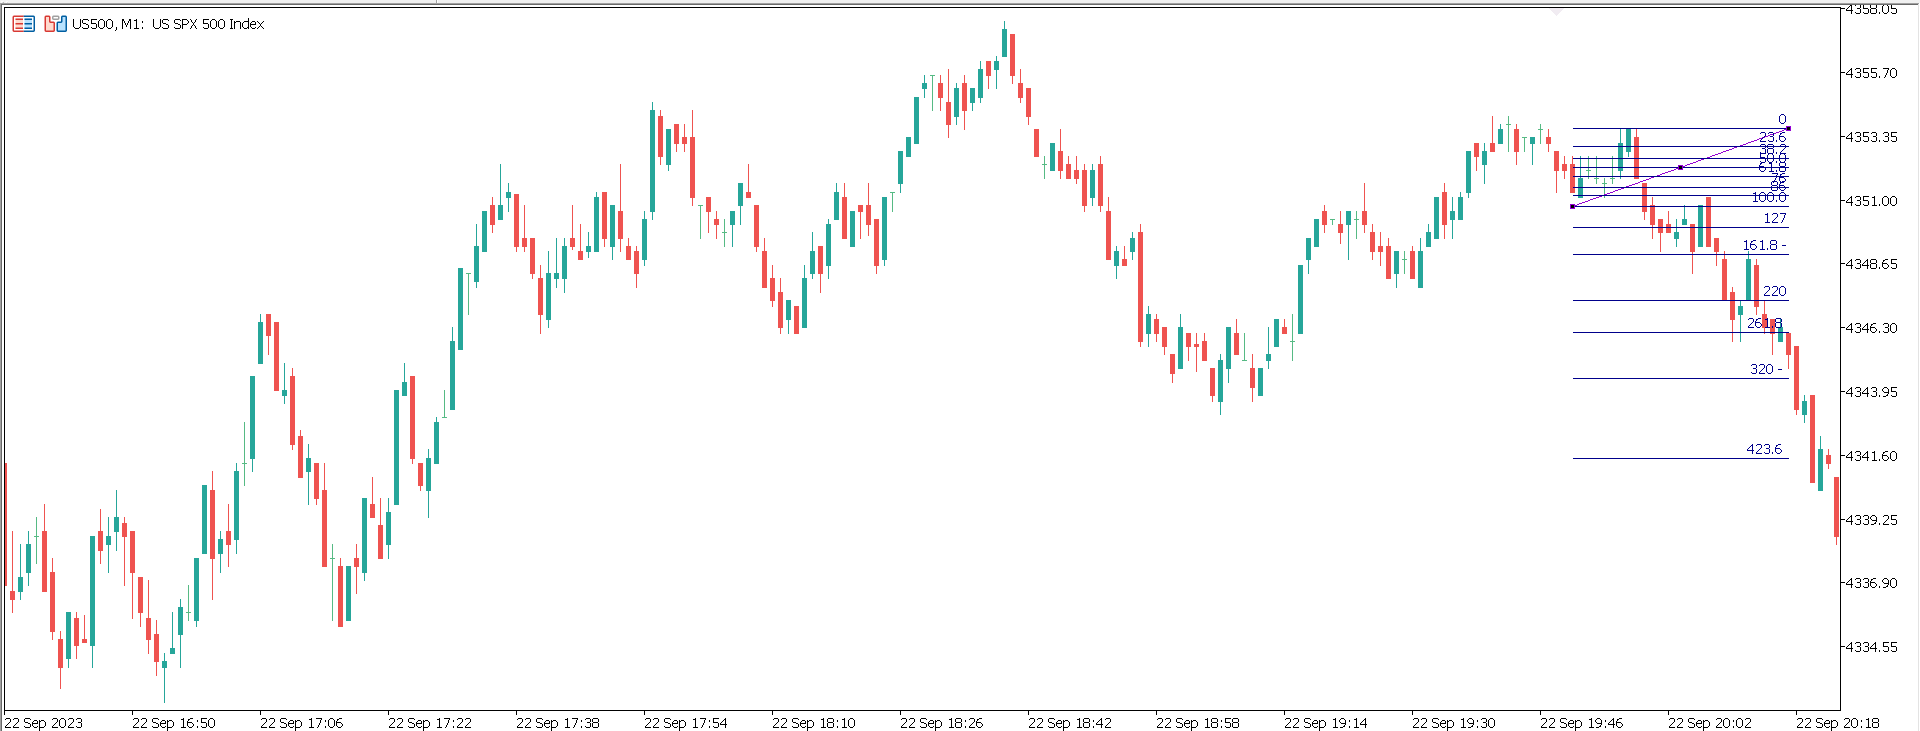
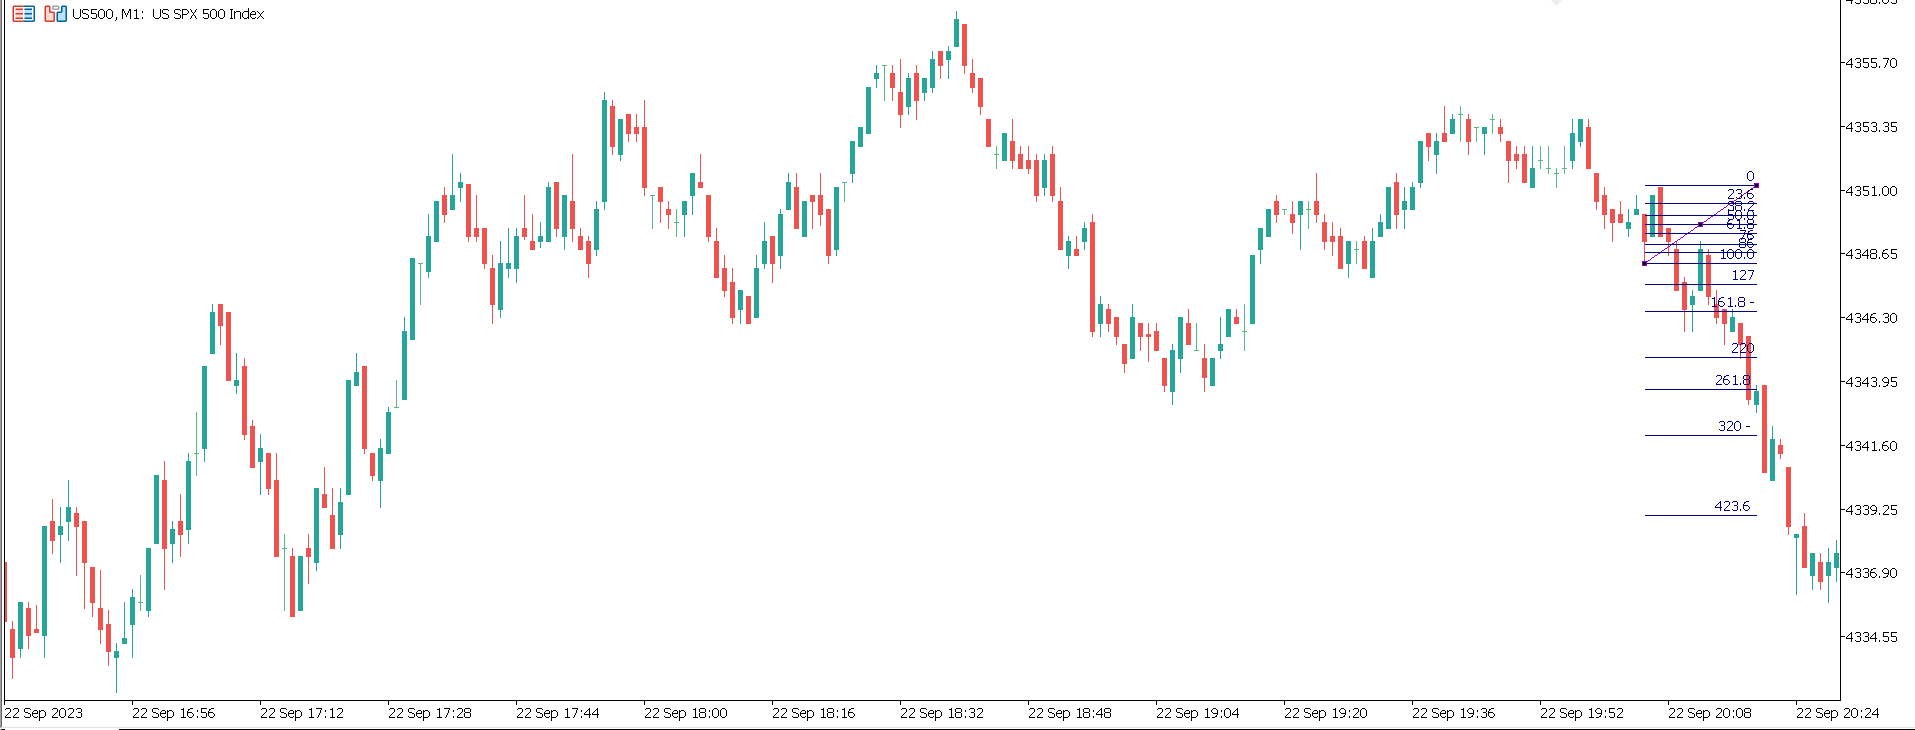
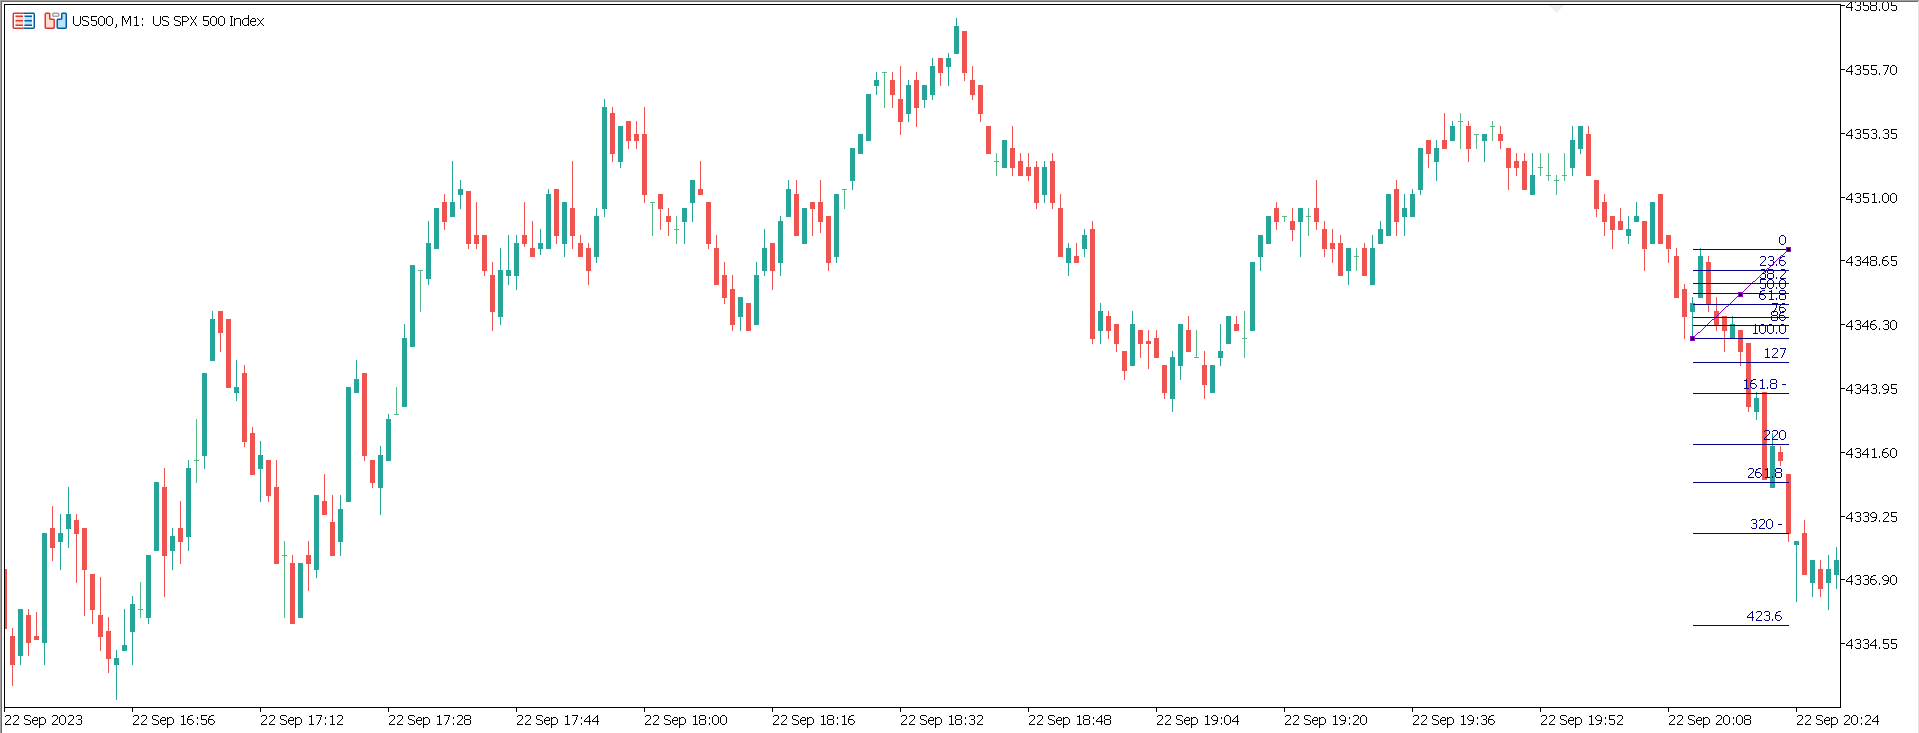
After this came our nice retracement short. Then after that the 1.61 held.
During this downtrend by being willing to remain in trades and trail stops so long as 1.61s did not hold you’d have been able to stay in all the way through the move and then once the 1.61 did hold you’d know that it was time to trail stops tight and set limits to short the bounce.
This is not idealistic rhetoric. Here’s a post showing the execution of spotting the false breakout and then the level to short again during this move.
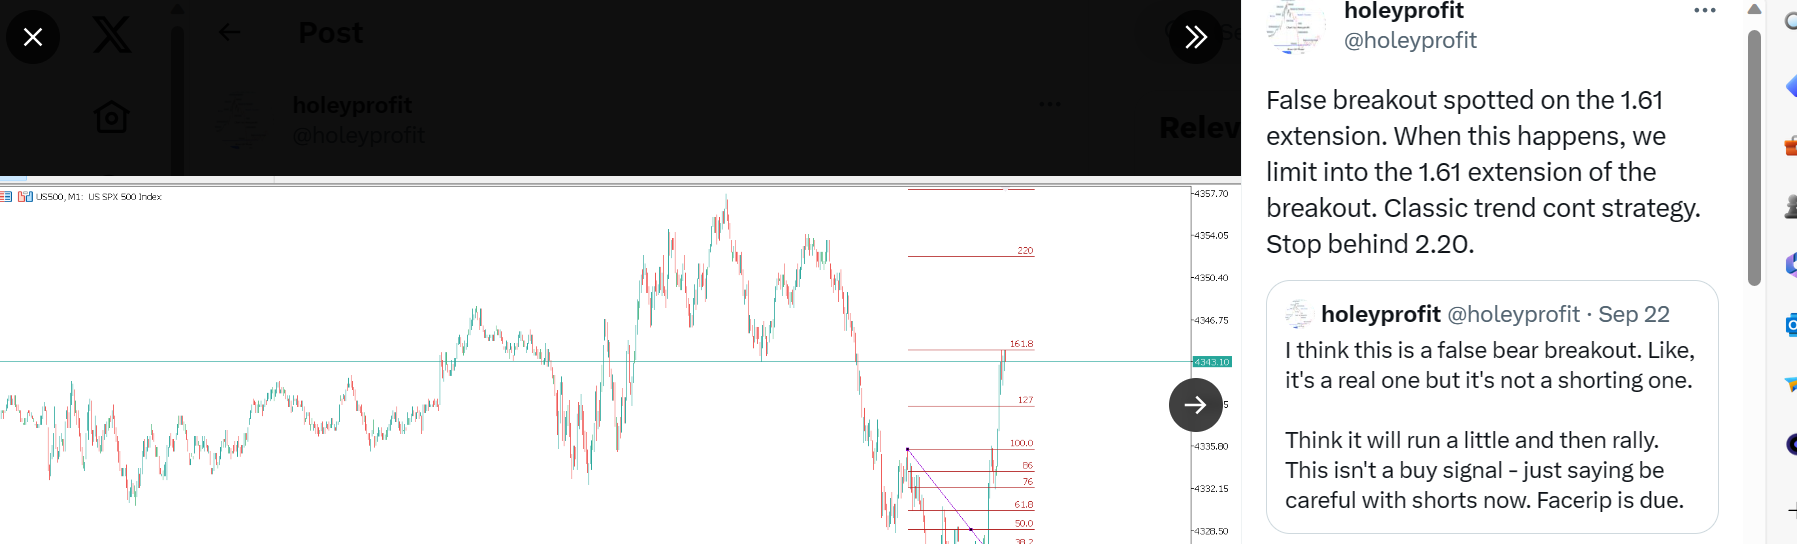
When it comes to taking new signals with these rules, there’s a bit more to it. You have to be clever in how you design your rules because what happens in and around 2.20 can be … complicated. You need a way to protect against failed signals. However, when it comes to running profitable shorts; This!
This will keep you in when it is good and let you know where to place your stops to get out before bigger ABC corrections.
There are many ways the concept of a 1.61 break can be used for trend following strategies. Be it betting on the 1.61 - 2.20 move with no pullback, the 1.27 pullback or various derivatives of break/retracement strategies. Retests of broken fibs for entries and future fibs for targets can work well.
A key benefit of this is also giving you good spots to quit betting on a reversal of trend (Be it a bigger pullback or a full blown reversal). If big 1.61 levels are breaking the momentum is probably still with the trend. For example, I thought there was a fair case to be made for buying supports until this happened.
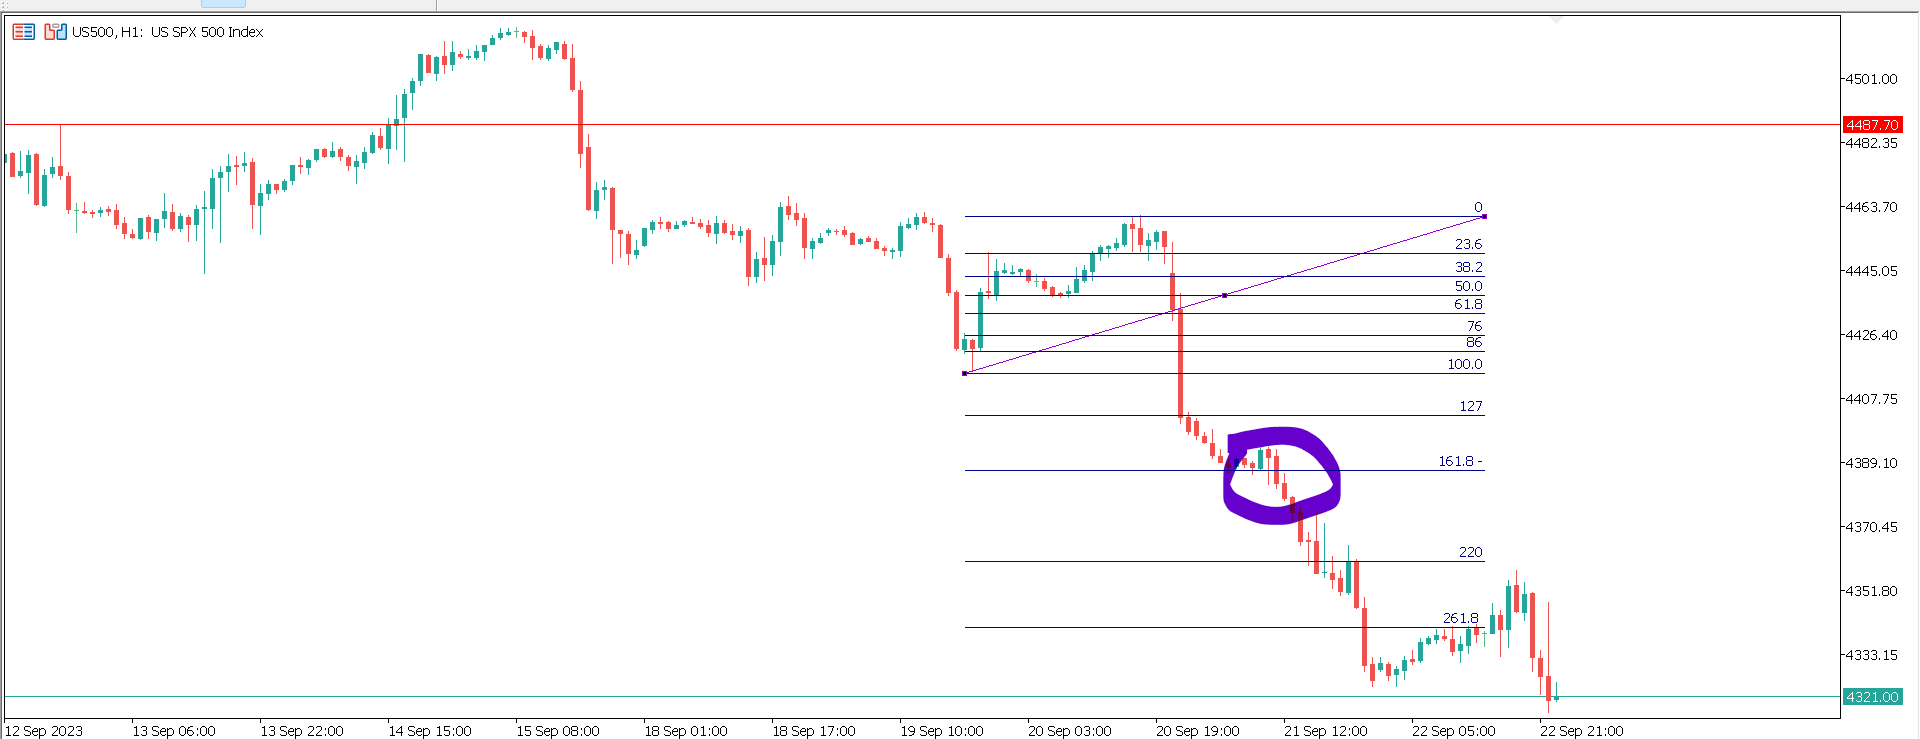
After this I started to be a lot more open about different options because that’s the sort of thing I am accustomed to seeing in a move that has more weight behind it.
I did buy SPX again after this (At the low) but shorted into the rally and now when I see we’ve made a rally and are back to the low I am drawing this fib with an clear plan on how I would trade either one of these moves.
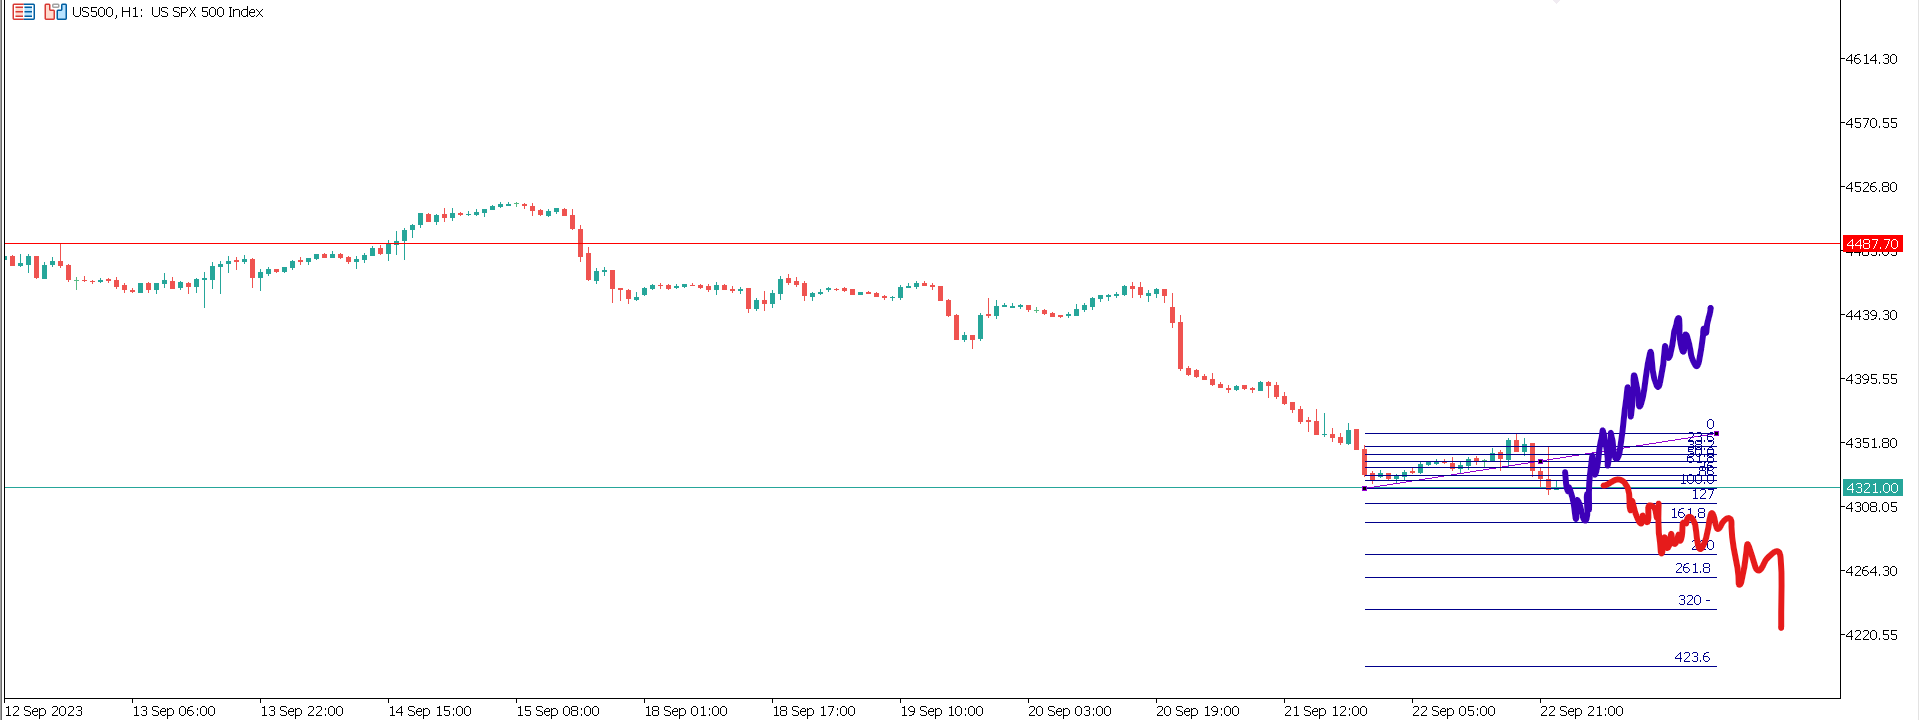
If we get to the 1.61 and hold I’ll be bullish and I’ll probably want to short the rip off this type of setup but if we trend up through it I’ll still have my longs on. The breaking of the 1.61 would make me extremely bearish. I’d be so unless the recent high broke and the question would be momentum or retracement trade.
When following a bear trend this is something that is good to habitually be doing on the 1-4 hour or daily charts. It should not take a lot of time to do that. Day trading can use smaller timeframes. For so long as we remain in a solid hard downtrend, this will help you understand the breaks to short and ones not to. And trailing stop levels.
Out of trend and in ranges these rules are far less reliable but if we go into a state where markets are down-trending on 1 - 4 hour charts (Or even daily/weekly) charts the rules are expected to work as well as they did on the intraday downtrend example shown here.
The edge is firmly short until the 1.61s fight back. Then it’s often time to ease off and sometimes full blown reverse bias.