2024 Possible Scenarios and Roadmaps
Full trade plans for most possible types of moves in 2024 - 2026.

In this piece we’ll aim to roadmap different possible outcomes for trading scenarios in 2024. We’ll break things into different sections where we take an agnostic view. Accept any possible outcome and plan as best we can for each one. Where required, we’ll also add subsections to different stages.
The aim of this piece is to have good roadmaps for multiple different scenarios along with things that confirm or disprove the given scenarios. We can then have multiple different plans prepped for different outcomes and follow the most applicable ones as the market moves.
We’ll cover the whole gambit of different outcomes. From us being early in the development of a bull market (Big correction in and new trend leg up developing) to the other end of the scale where we are entering the early stage of a macro reversal in indices.
Ideally, this post will serve as an ongoing reference point for the full year. From this post we’ll generate our overall plan for various different outcomes. Much in the way when building a jigsaw puzzle it’s easier to do once you have all the edges in place. We’ll have our broad overview to build smaller trade plans inside of.
Please note: Timescales on charts do not attempt to be accurate. Attempts are made to be reasonably accurate with price levels and the broad way price swings form. A by-product of getting this right may be timescales are also accurate - but maybe not. There’s no significant attempts to be accurate on timing made (Unless stated).
Early Bull Market
We are defining an early bull market as us being due to make a valid break of the previous highs and advance further. We’ll map out various different moves to the bull side but in all cases we’re defining an early bull market as market conditions in which we’ll see SPX at least 50% higher than it is today.
An early bull market move can be subdivided into a few potential moves. We can have a relentless bull market with few pullbacks. We can have a developing bull market close to a retracement before a real breakout and we can have a bullish breakout setting up which will retest the last high and then continue higher.
Bull Market with Pre-Breakout Pullback
It’s possible we’re in a really bullish overall scenario and due to see some bearish activity in the immediate future. Where we get close to a new high/make a nominal spike out and then enter into a drop which fails to break the previous lows. We can break this down into a shallow a deep retracement.
Shallow Retracement
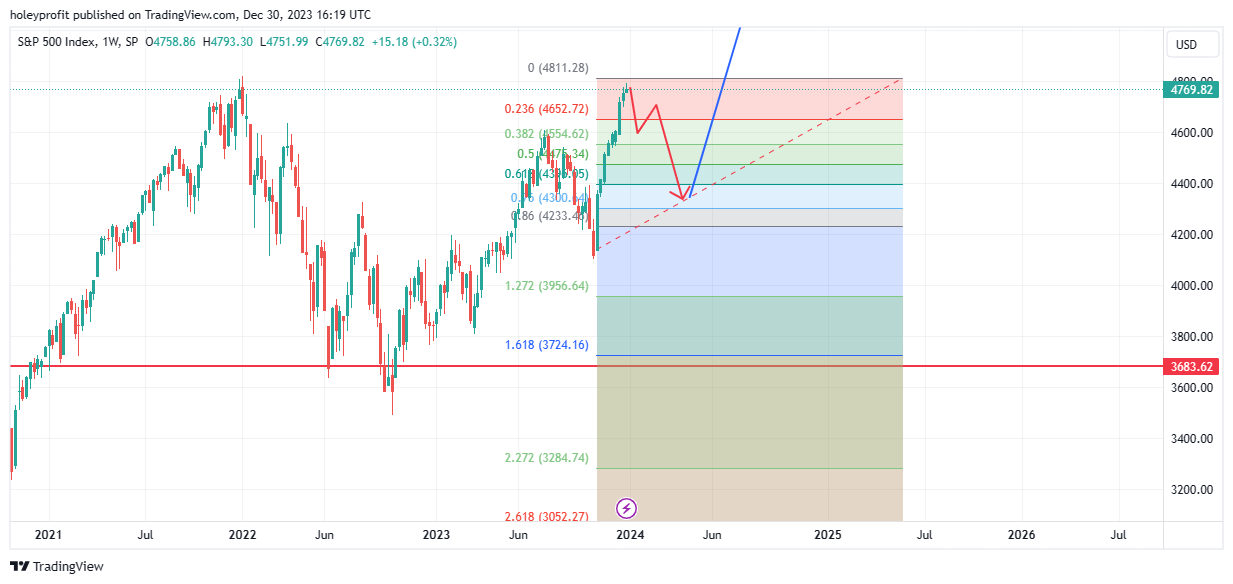
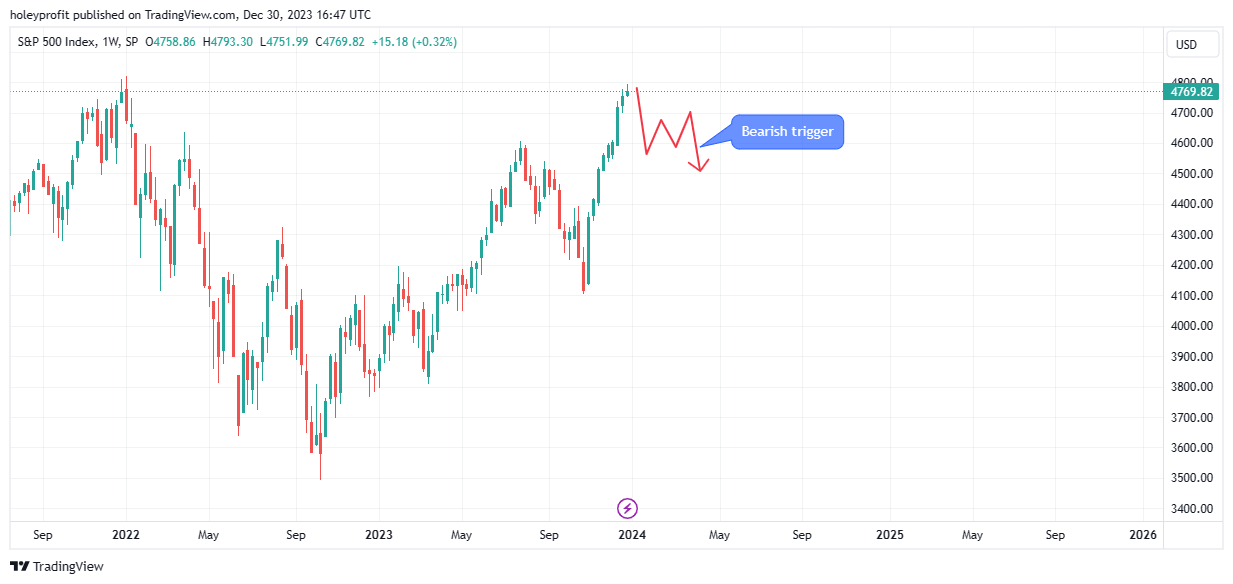
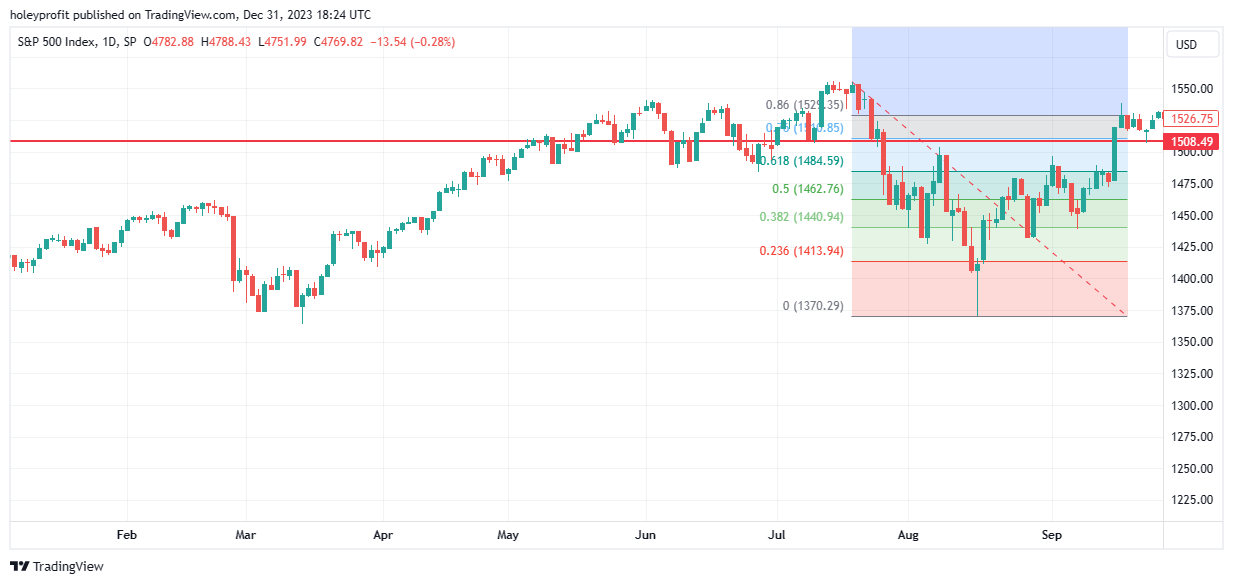
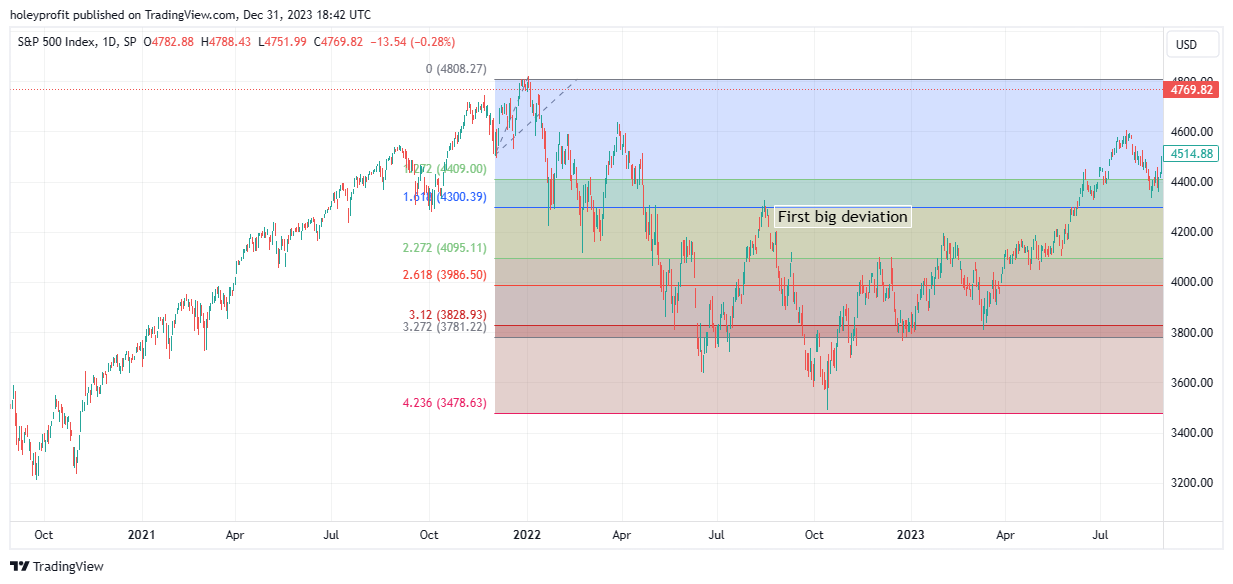
In a shallow retracement move we’d likely see a first bounce off the previous structural high (4600) and then a sharp drop through to the local 76 retracement (4300).
Our first clear trading signal would come upon the failure of the first bounce low. Here we’d have a strong bearish trigger with stops above the high of the failed rally and a target down close to 4300. The expected move here would be a sharp drop of a a few 100 points.
For a developing bull scenario we’d want to see this move ending somewhere around 4250 area. Using the 76 retracement as support and then breaking back above (And holding) the 61 fib. We could look for speculative high RR entries on the 76 fib or more confirmed entries upon the breaking of the 61 fib.
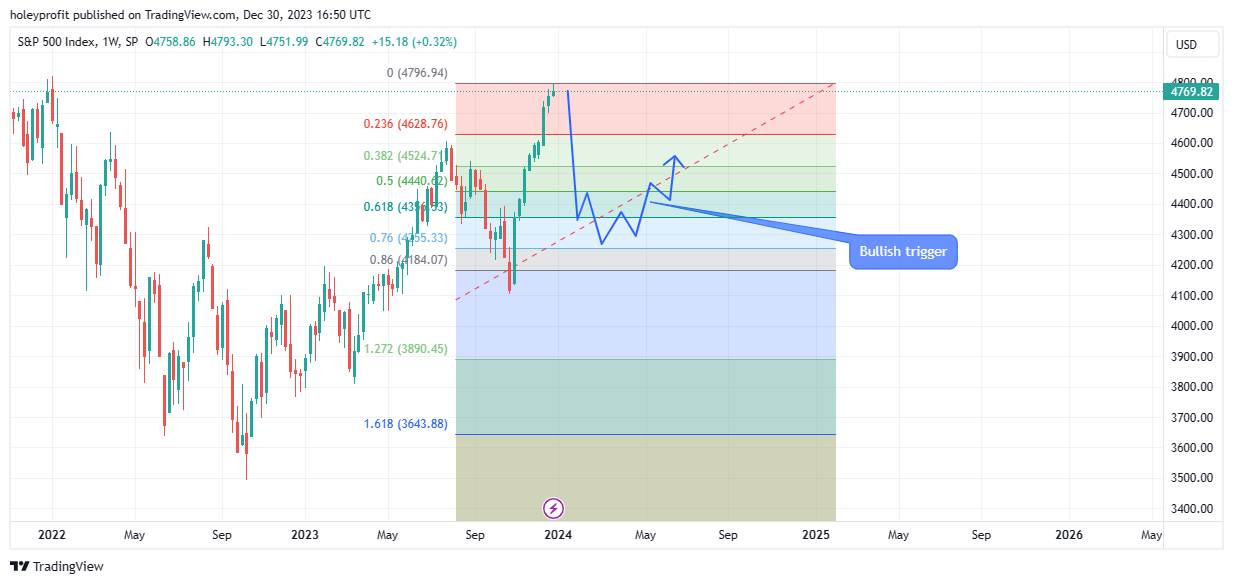
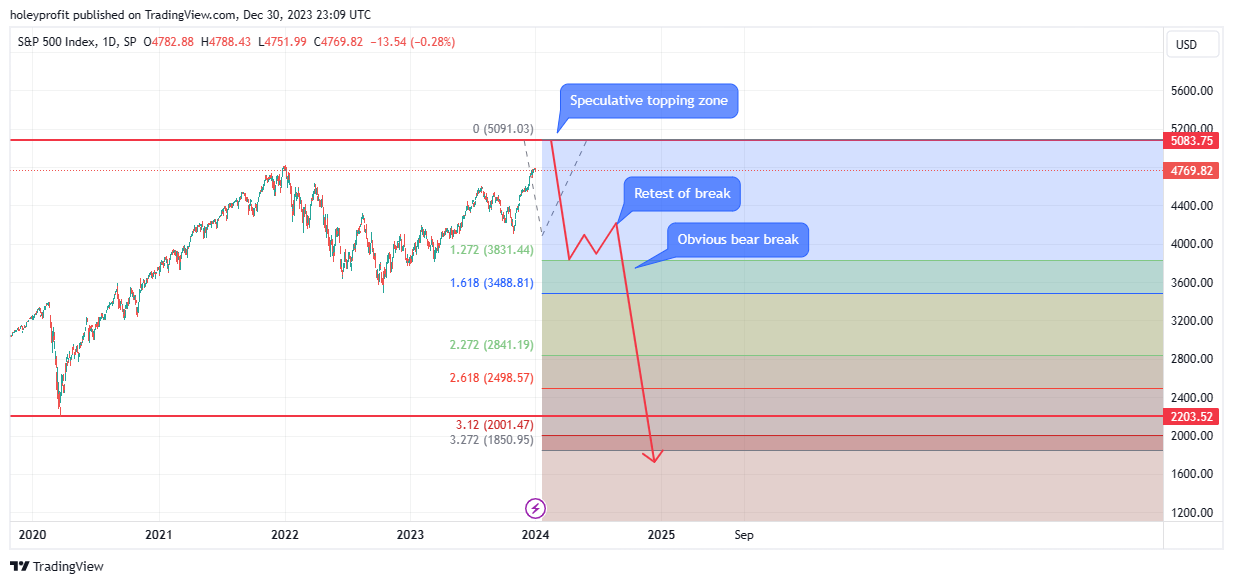
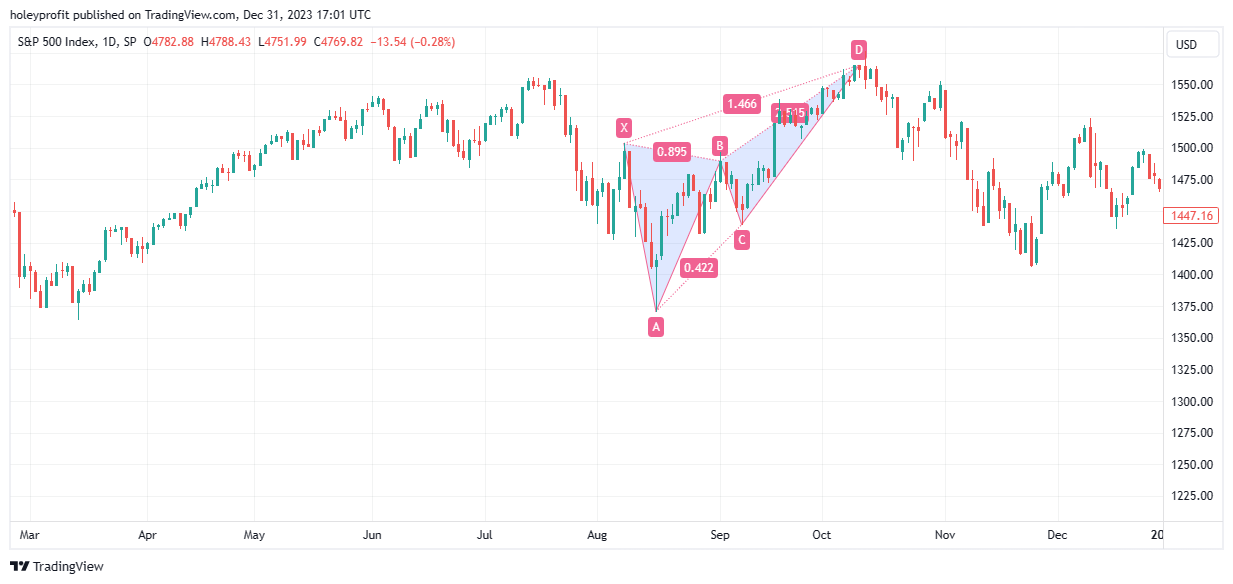
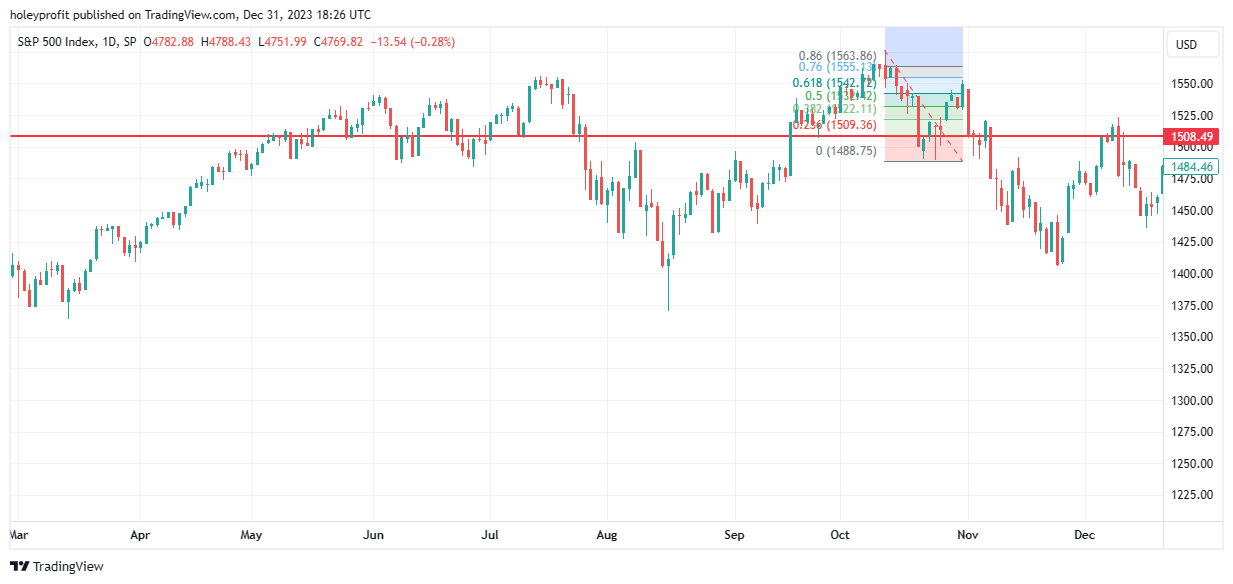
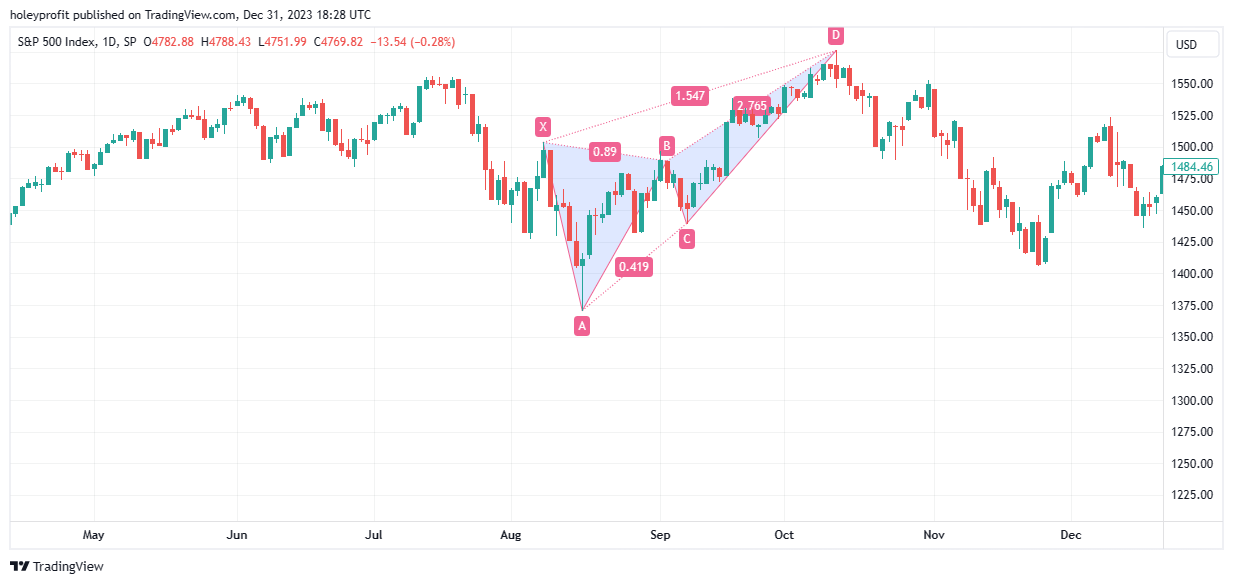
Most big reversals come with a failed harmonic continuation. For this to happen, there are certain things we have to see, and they’re very obvious to watchlist so we can spot them if they are developing. For a bearish harmonic (W shape) to form, we have to have a failed new low or double bottom type of move.
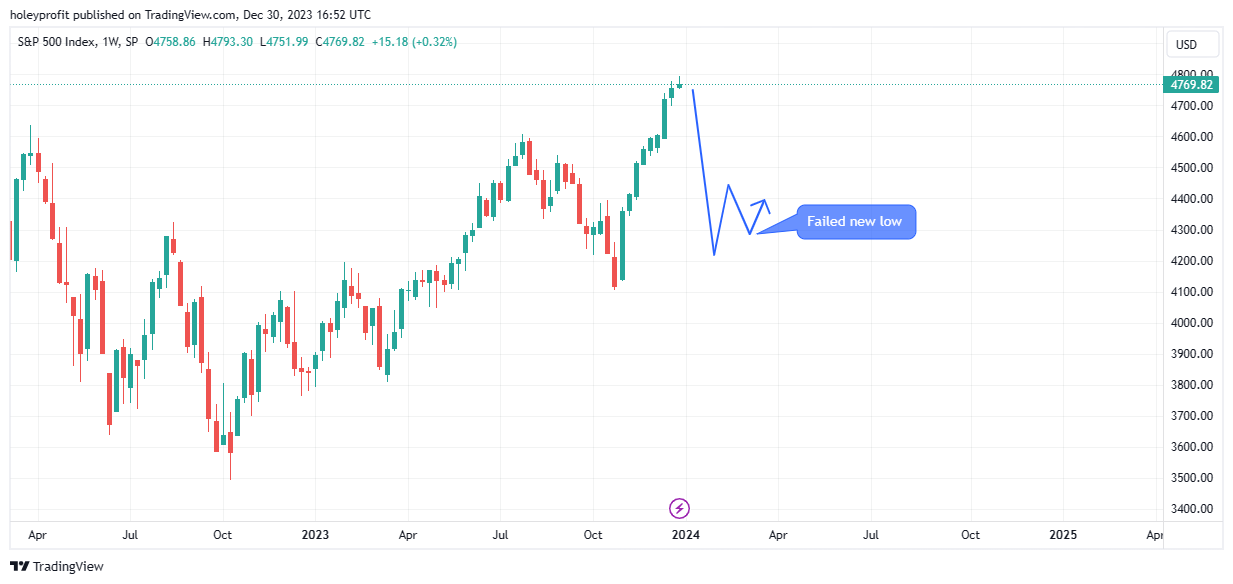
We know to look for a possible low around the fib supports and if we see this we know to pay particular attention if we see a failed new low. If this happens in the forecast area, we can fib high to low of the failed new low and our big breakout level is the 1.61.
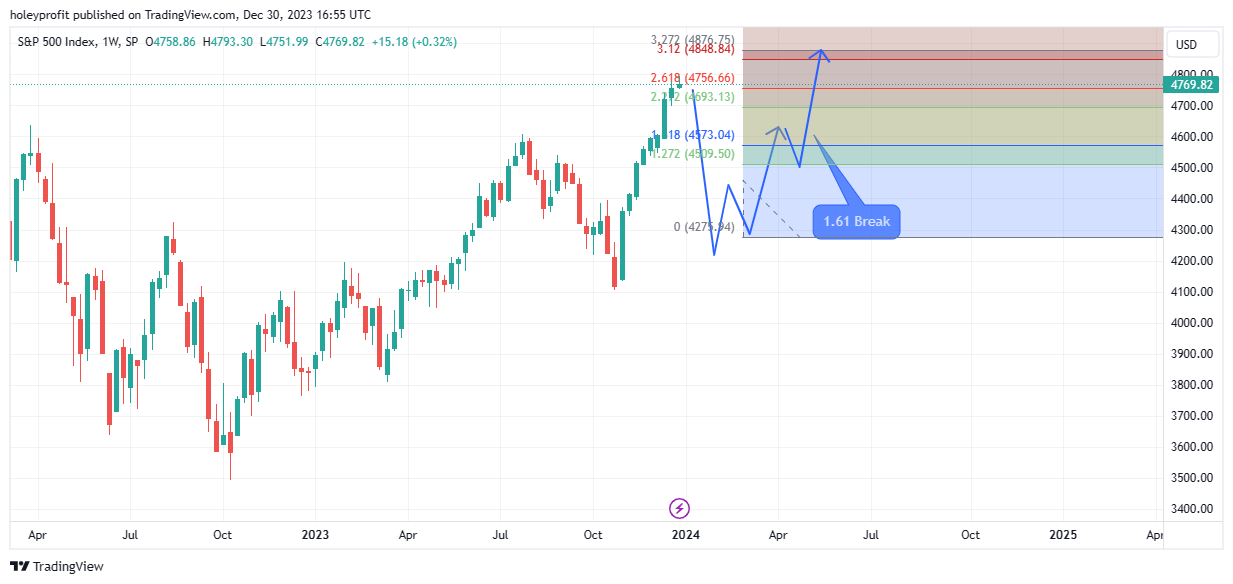
If we see this 1.61 breaking, we have a strong persistent bullish bias with the following upside fibs being target/breakout levels.
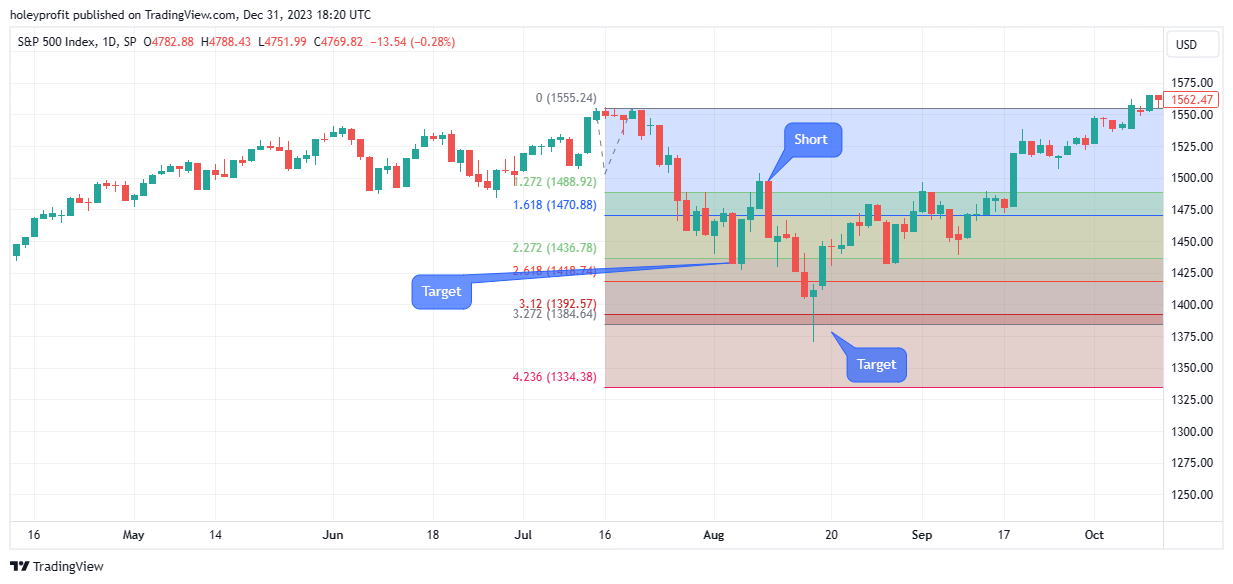
Deep Retracement
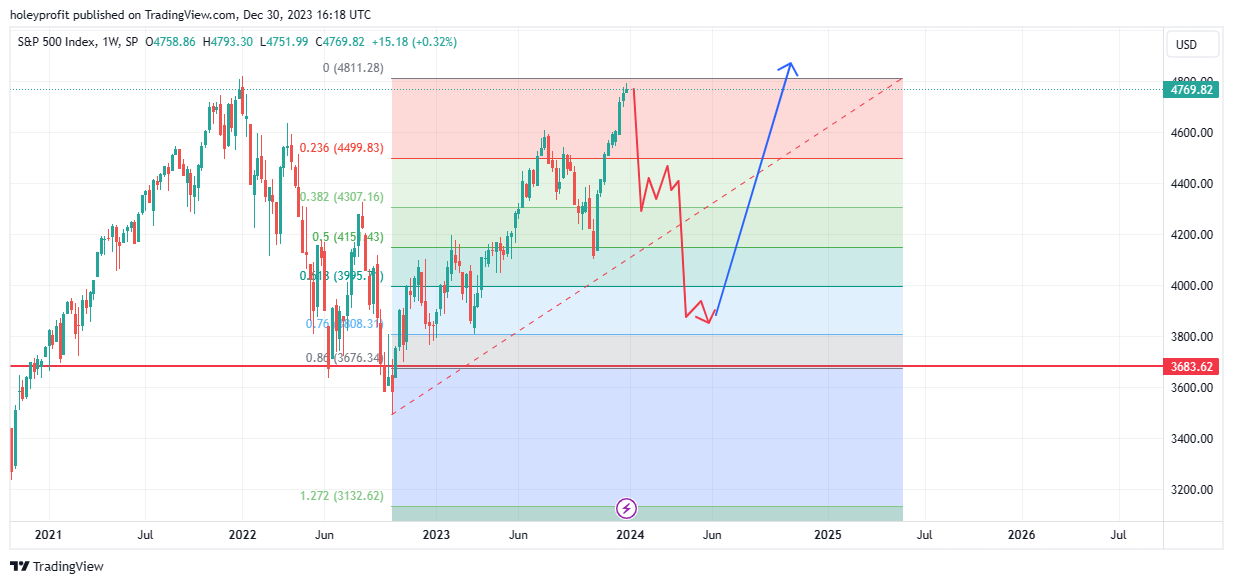
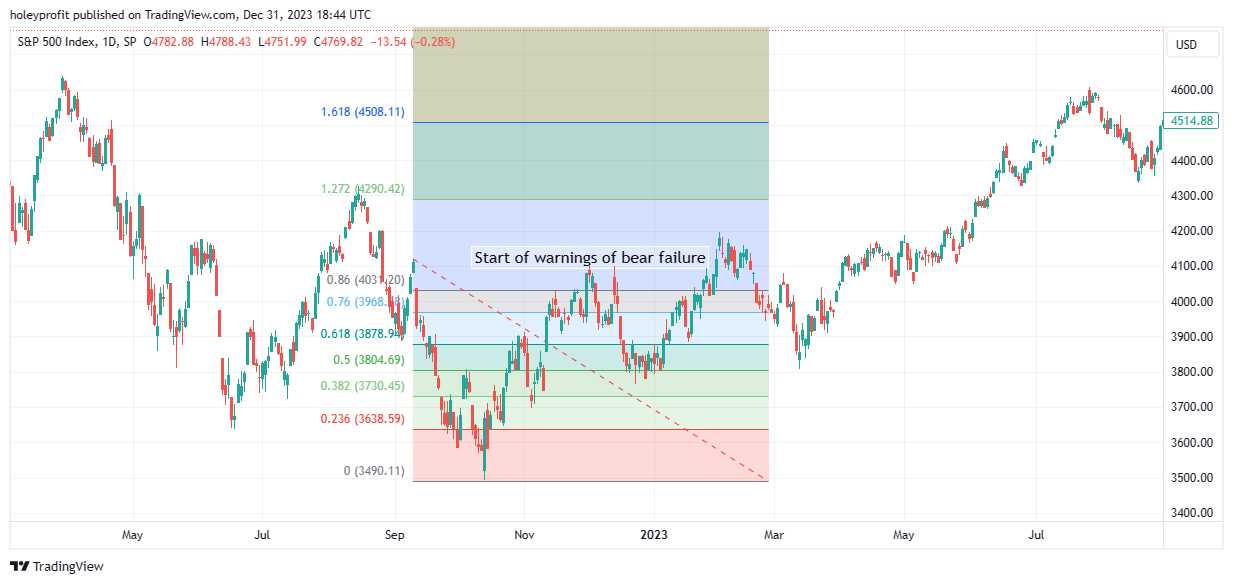
Failure of the 4250 - 4300 zone as support would lend itself to a bias that a bullish move could still have further to retrace, dropping to the 76 of the full rally out of the low. In such a scenario we could use a similar set of signals as given for a shallow retracement - Just at different price levels.
We’d be looking for a failed bounce somewhere around the first big fib support levels but this failing to produce a strong momentum move and triggering a strong near term bearish bias upon the failure of the attempted lows. Again, here we’d be expecting a strong fast move to the next support levels.
Note that it’s possible this move forms substantially similarly to the shallow pullback move explained above. Up to a certain point both act exactly the same. The difference is when the bearish harmonic level is tested is succeeds instead of failing - failure leads to a spell of capitulation.
In our area of interest (The 76 fib support), we’d again want to look for the same sequence of events making a failed attempt at a new low. Forming a bearish harmonic and then the uptrend getting notable stronger once the bearish harmonic fails.
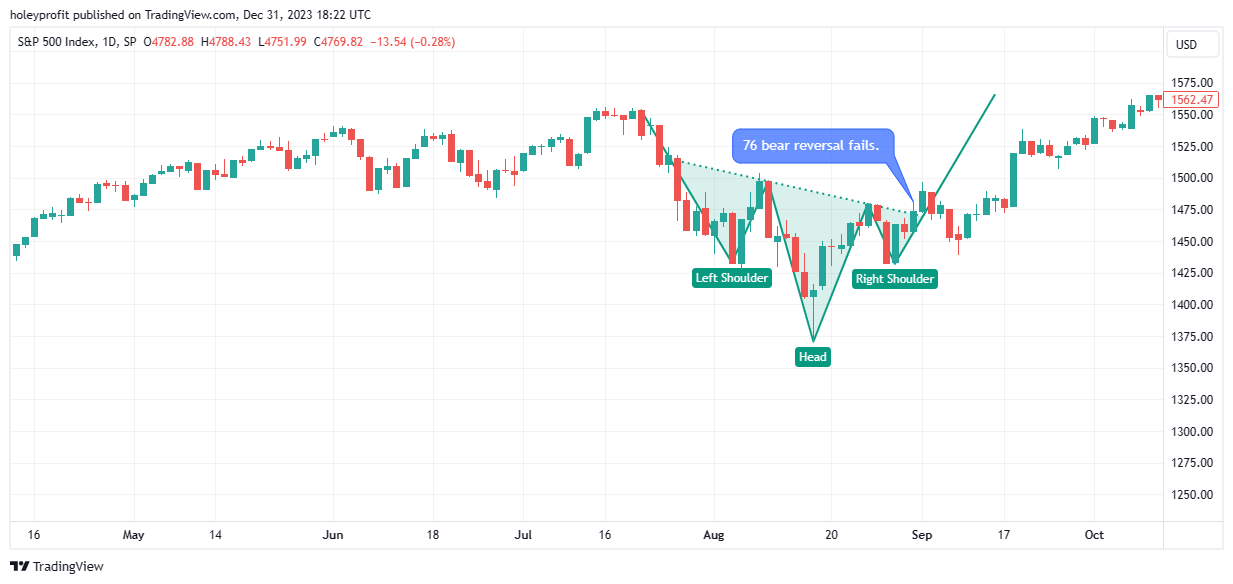
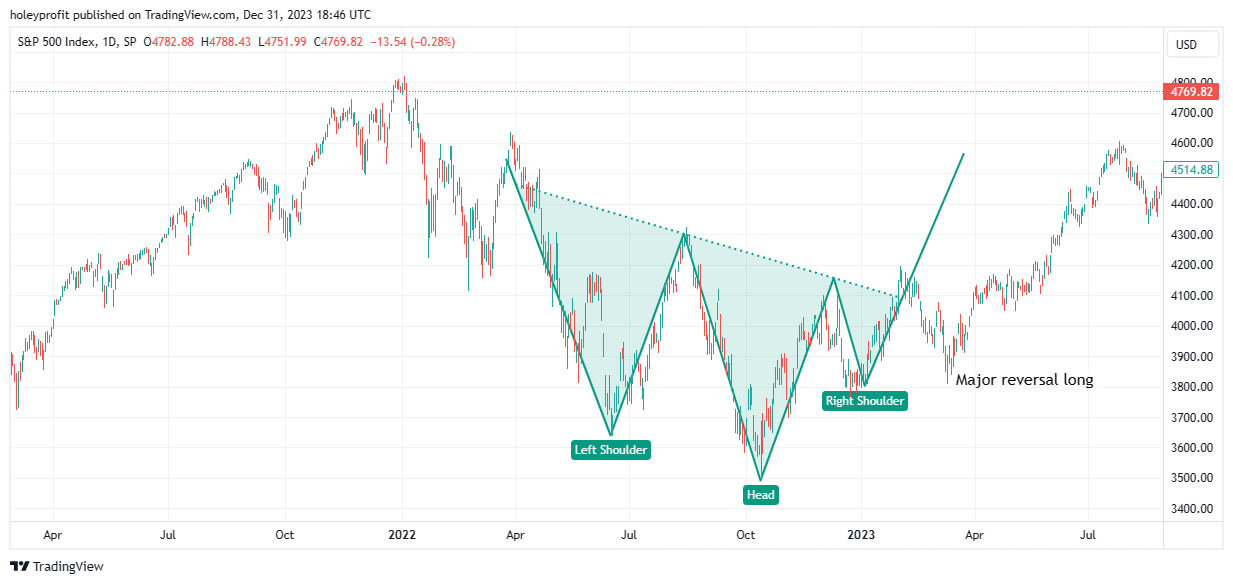
If you have some basic charting knowledge, you’ll recognise the above forecast would be similar to an inverted head and shoulders. When that pattern forms and succeeds there are usually a few key parts to it. The sharp drop. Spike low (Head fake). Failed new low (Right shoulder) and then the strong reversal.
When complete, this pattern should be easy to see but with us having it planned into our roadmap we could look to speculate on the head and shoulders forming into the possible right shoulder. This would be the obvious high RR spot if this type of move was to setup.
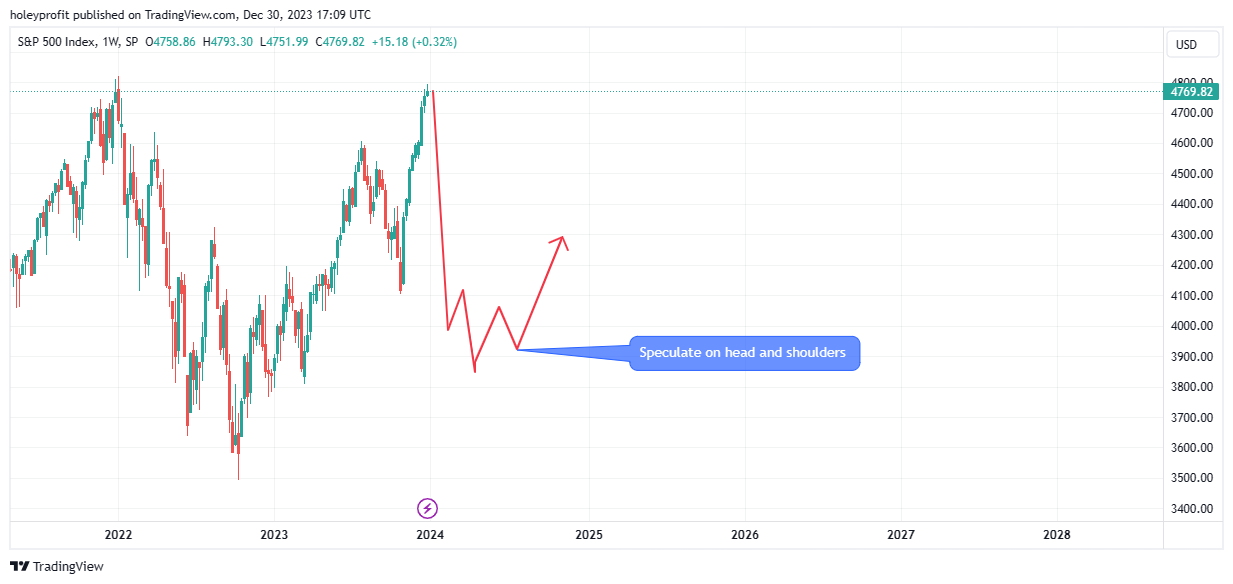
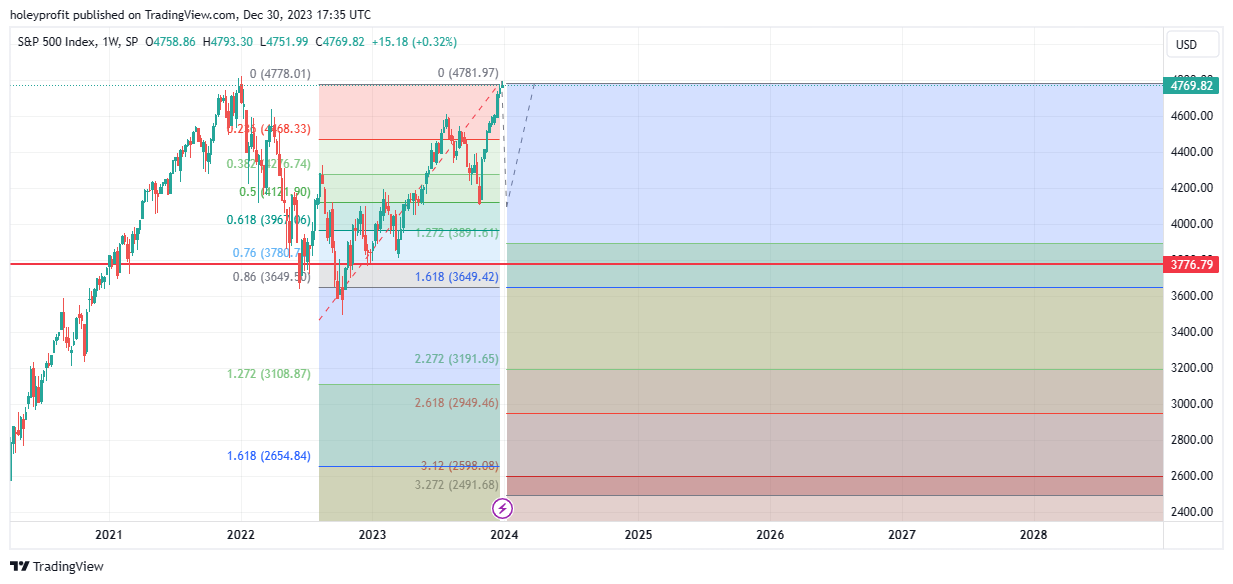
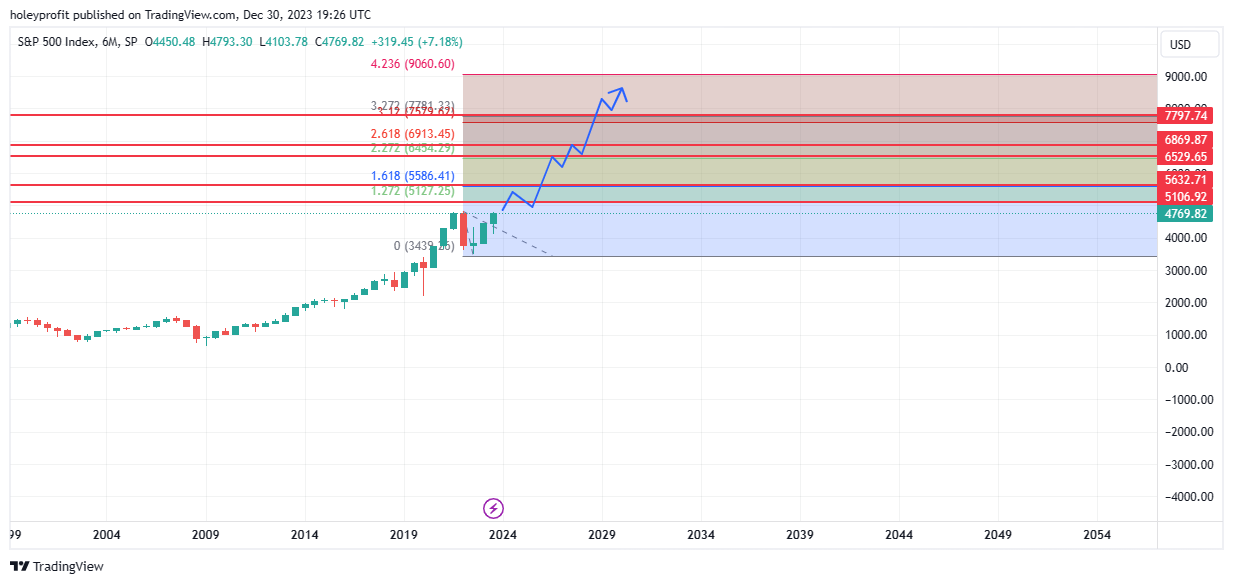
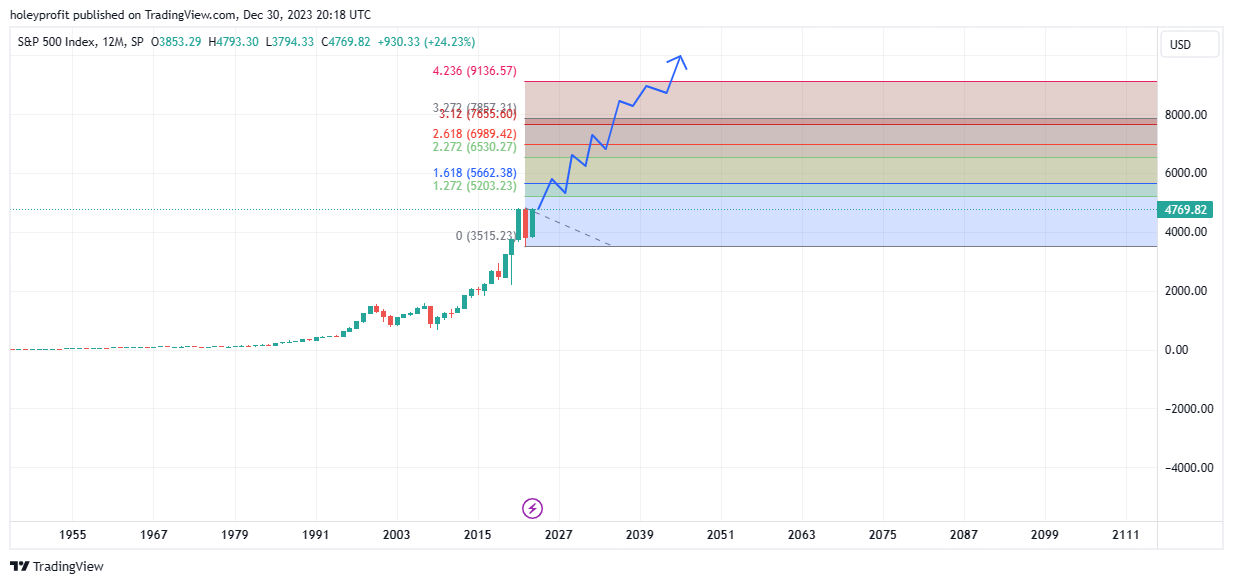
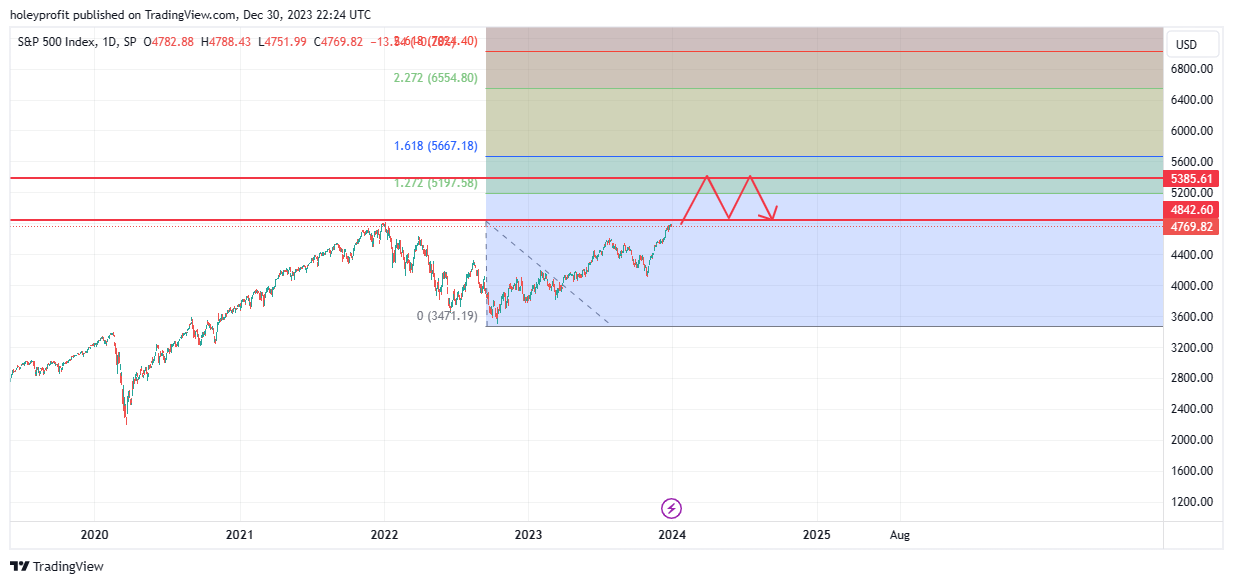
This type move move could imply a move that would go on for a long time. If we get the deep drop and support, the early thing to do is to fib high to low of the drop and look for the extension levels of that being the breakout levels and targets. Overall the implied move would be over 6,500.
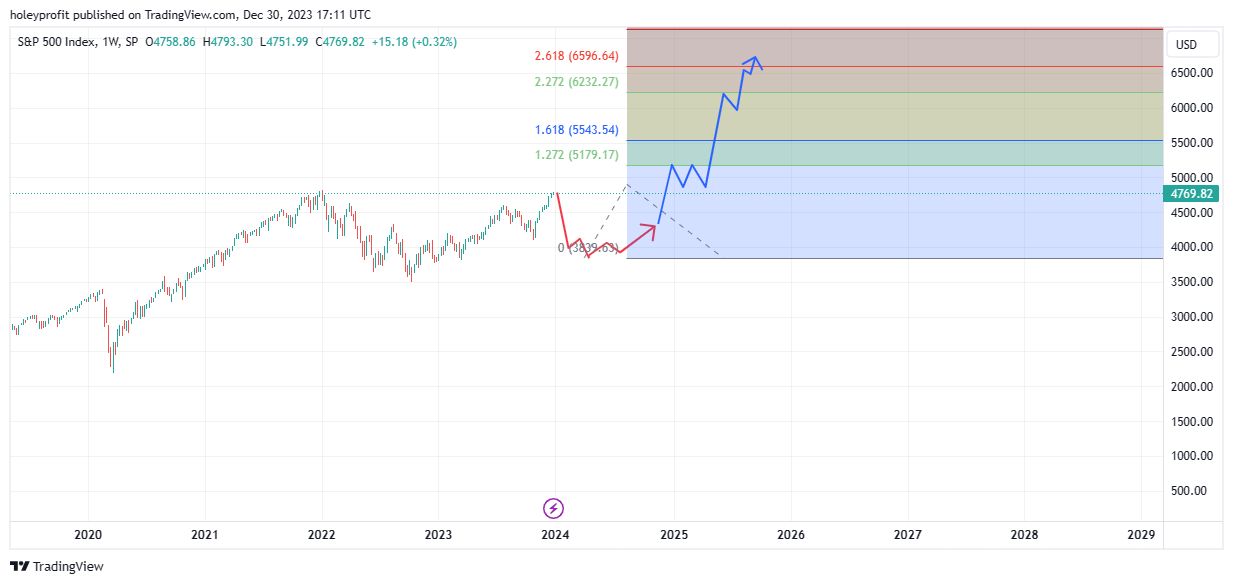
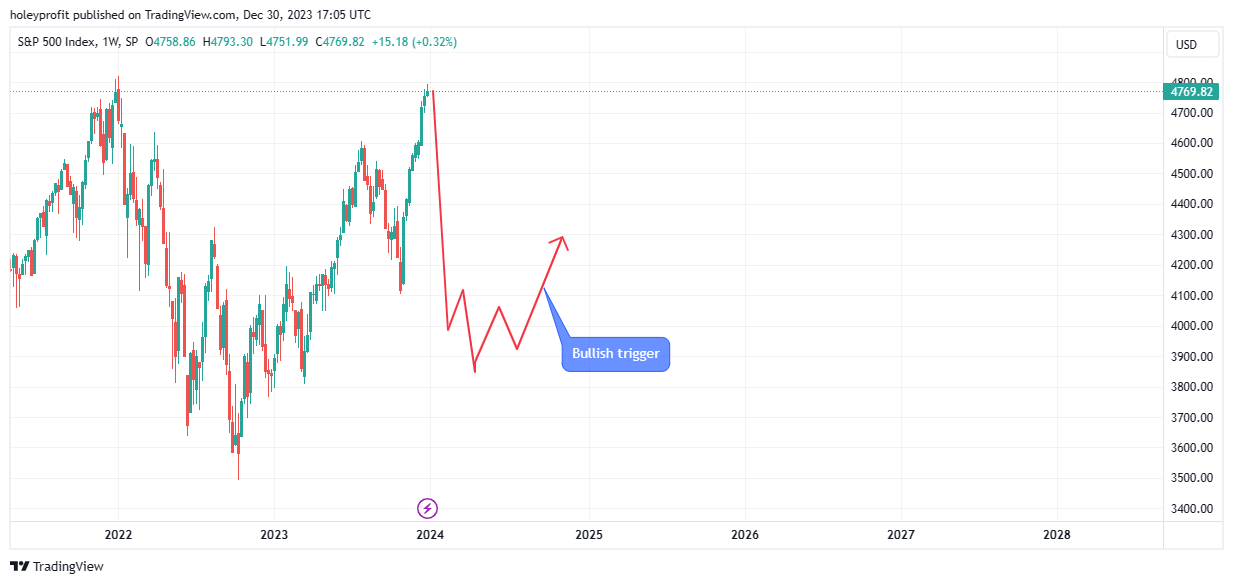
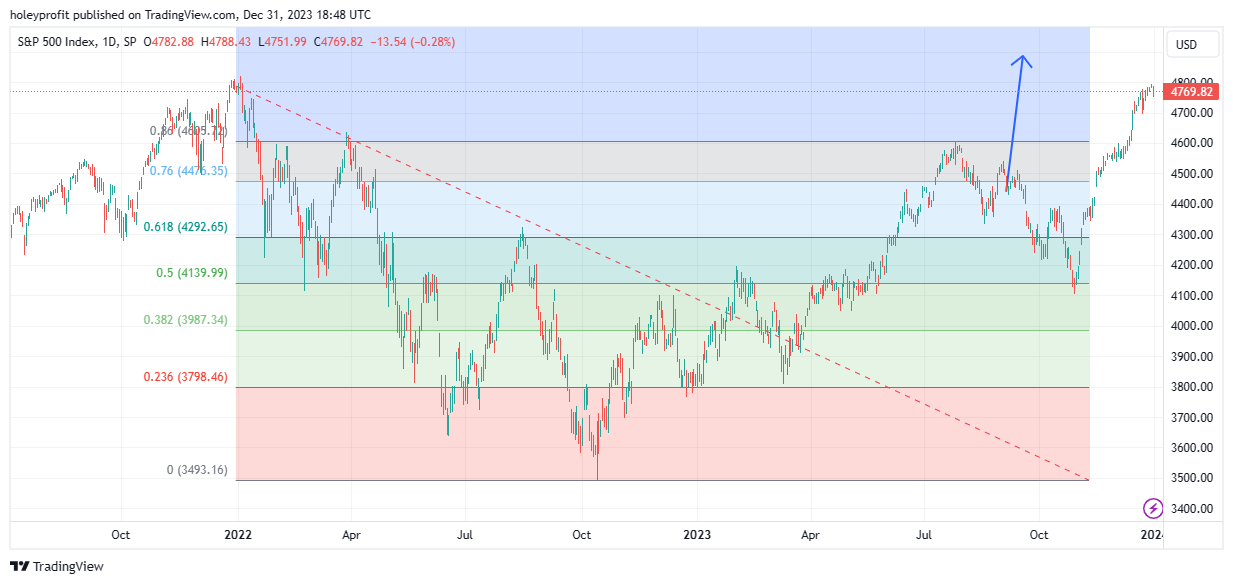
We’d look to see the following sequence of events (Common to a developing bullish move);
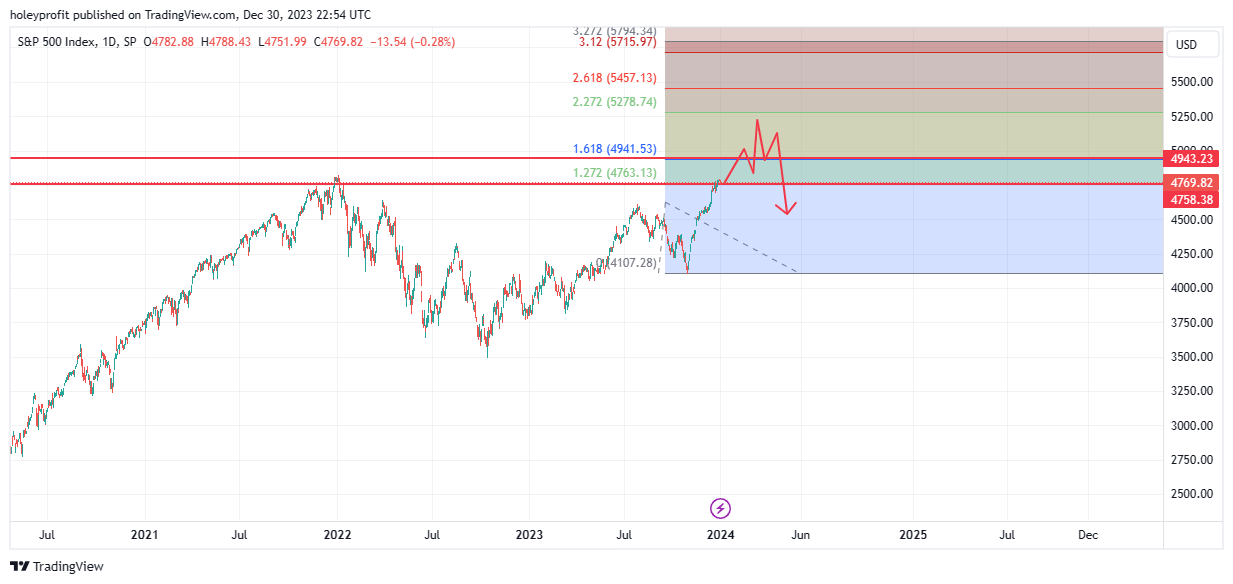
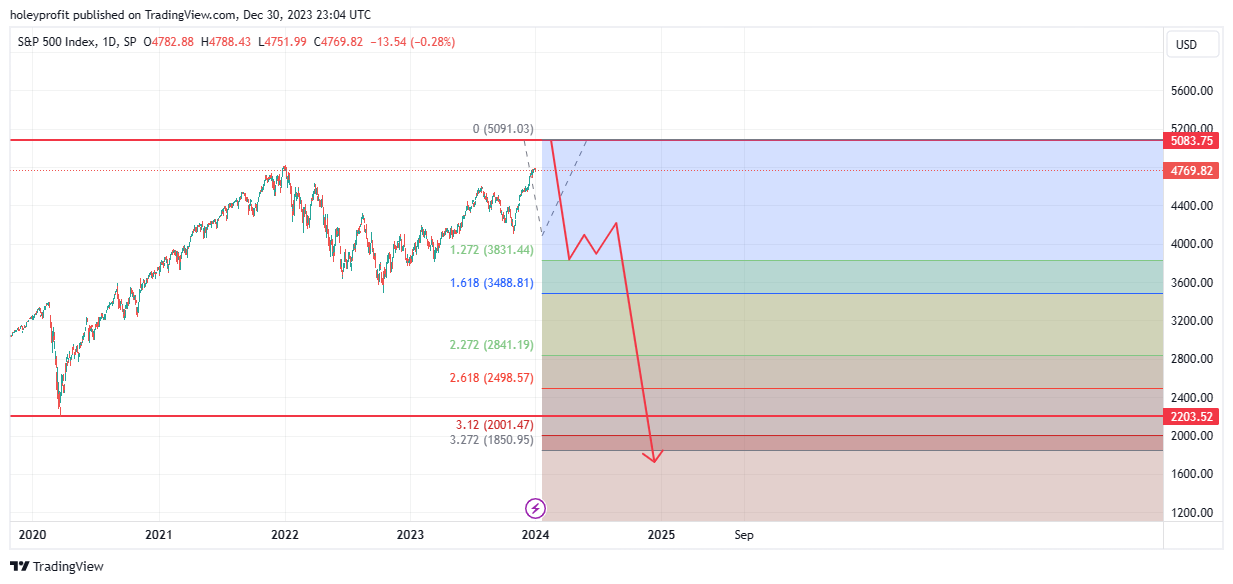
Pullback from 1.27 fib (5100).
Retest of structural high (4800).
Momentum Break of 1.61 (5550).
Minimum upside target of 2.20 with probable spike to 2.61 (6200 - 6600).
If we have the confluence of classic scary flash crash correction, a strong 76 hold and then a breaking of the bearish downtrend patterns (Such as harmonics), there’s a very strong chance the bull move is “Safe” to at least the 2.61 fib. From there, a lot of flash crash risk would come into play (Even in a larger bull move, big risk for bulls at 2.61).
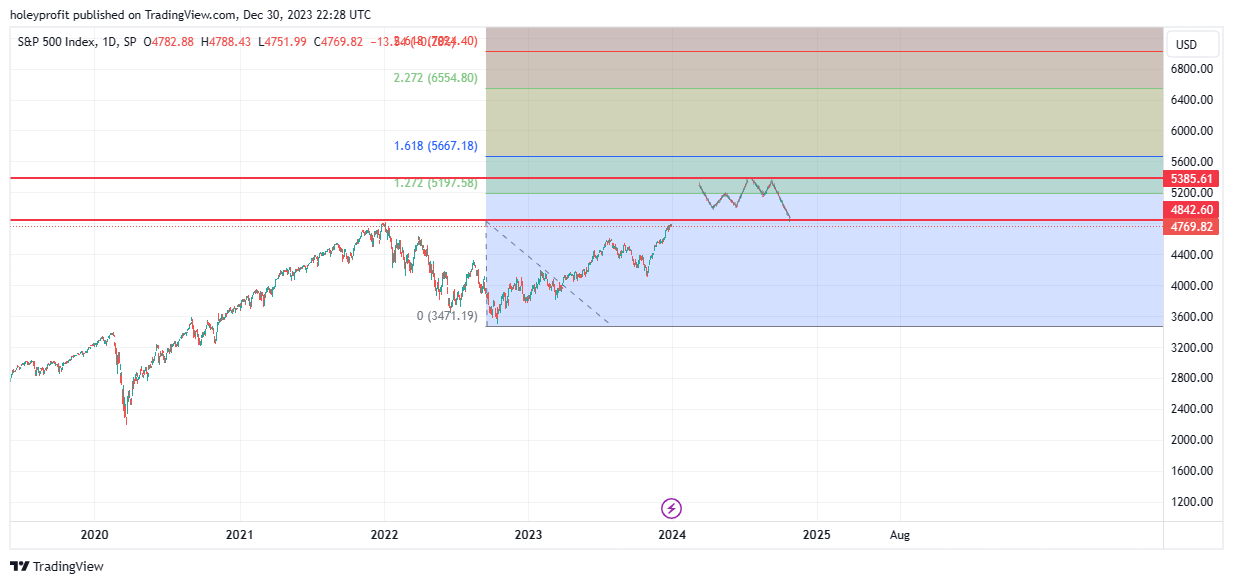
A 2.61 fib drop here would typically be reaction than reversal. We have to map in the possible 2.61 correction because it would be big at the time but it probably would not hurt the overall bullish trend. Norms would be a drop to 1.61. Dead cat bounce there and then a spike out of 1.27 before the uptrend resumes.
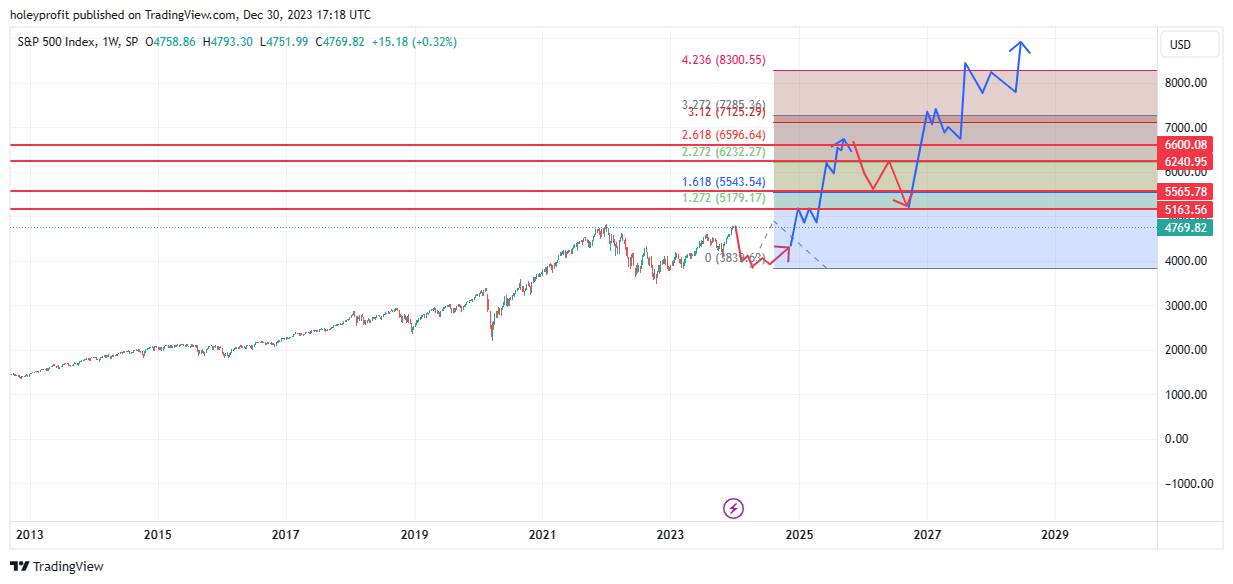
The uptrend is liable to have a bit of a wobble around the 3.20 - 3.60 fibs but in such a strong trend we’d typically see 4.23 hitting and probably see some sort of big blow-off spike. In this scenario we’d be looking at a blow-off top somewhere in the area of 9,000.
From that area, we could see a really strong drop. Taking out all of the gains of the big rally.
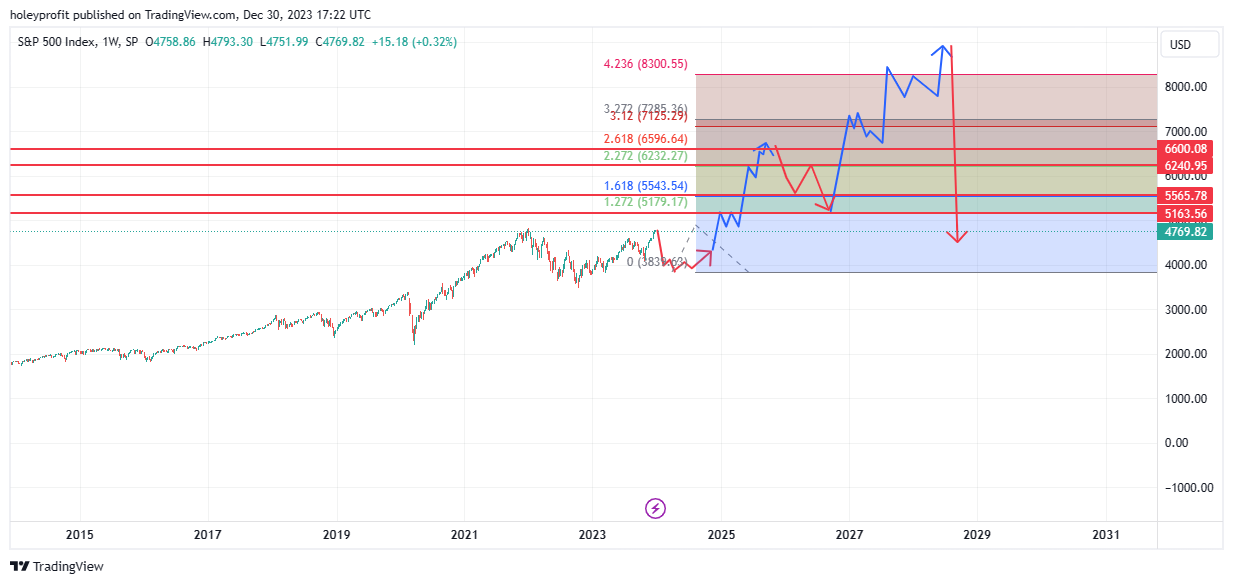
This is about the most bullish scenario I can envision. The overall rally to around 9,000 followed by an exceptional crash. I’d really love to be a bear in the 9,000 - 10,000 area. Any notable breaking of 10,000 would probably highly discourage me from further attempts to short SPX (More because I’d be confused than bullish).
I don’t think the deep pullback scenario charts very well. My main gripe with it is in this setup I’d expect to see a 1.61 of the last spike high coming in just before the 76 of the full drop. As things stand, the 1.61 has to come in under the 76. I find when this happens a break is more common than a hold.
So I really am sceptical this move can happen. The “Final spike” has went on a big longer than it should to have a 1.61 inside of the 76. While this is a small detail, I’ve noticed it is an important one on various occasions. With that being said, the deep retracement move would seem the ideal trading op.
Trading ops down to 3800.
Then up to 6600.
Down to 5150.
Up to 9000.
Down to 4000.
I do think the odds are against this set of swings, but these would seem like the best sequence of swings to make the most money in. Some really good trends. Big turns in reasonably predictable areas. Likely a progressive increase in volatility. Ample chance to make money in easy up trends. Potential for spectacular final reversal.
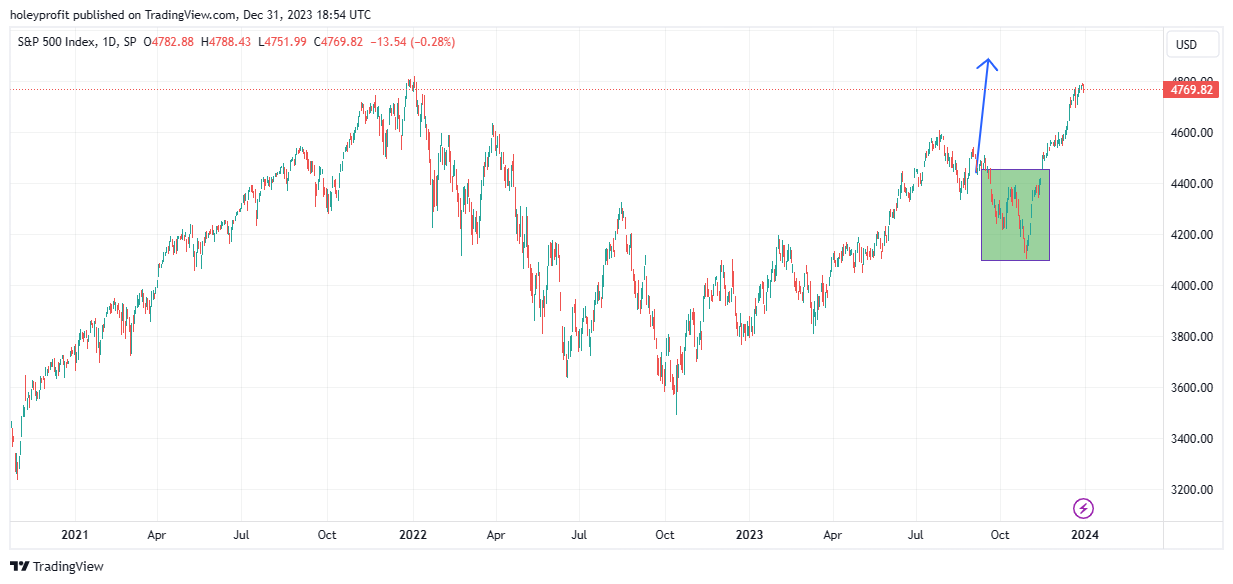
Bull Market with Post-Breakout Pullback
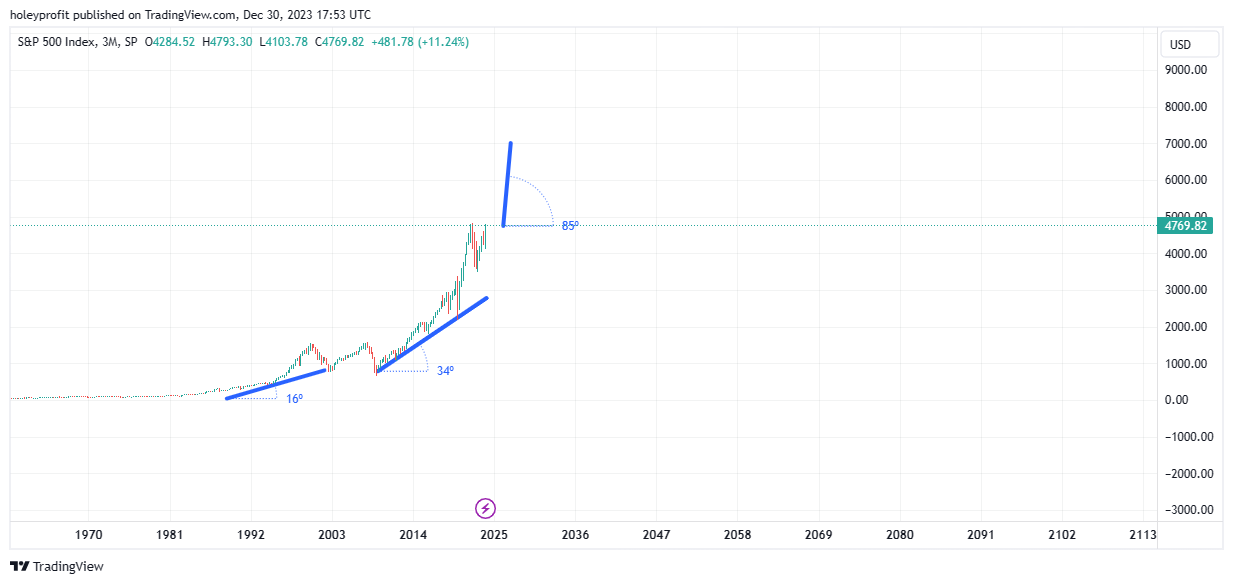
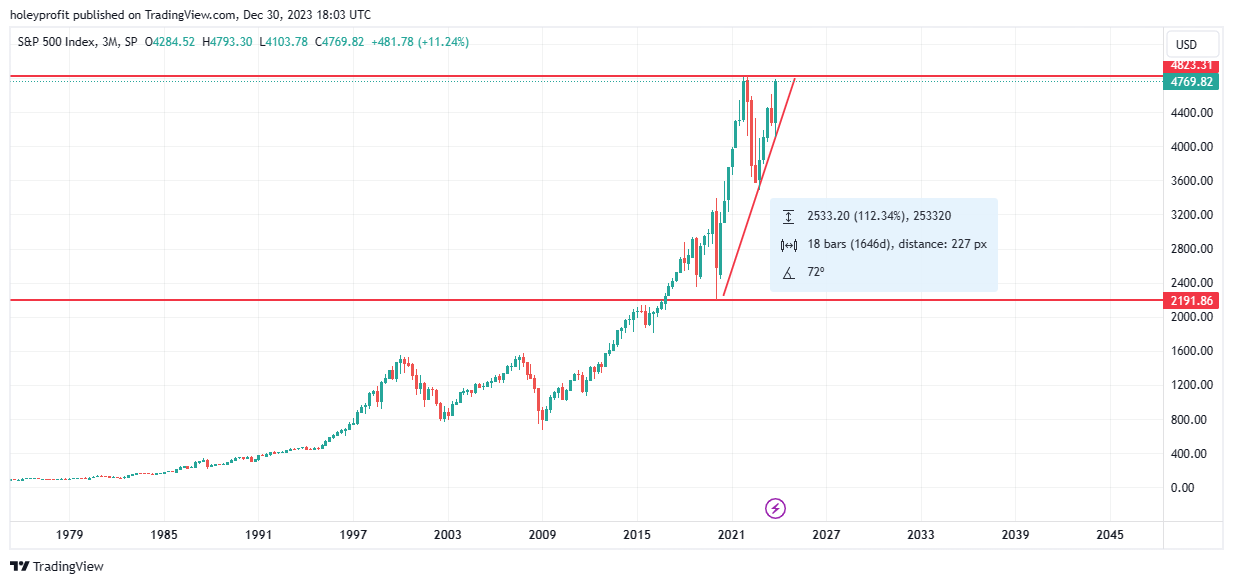
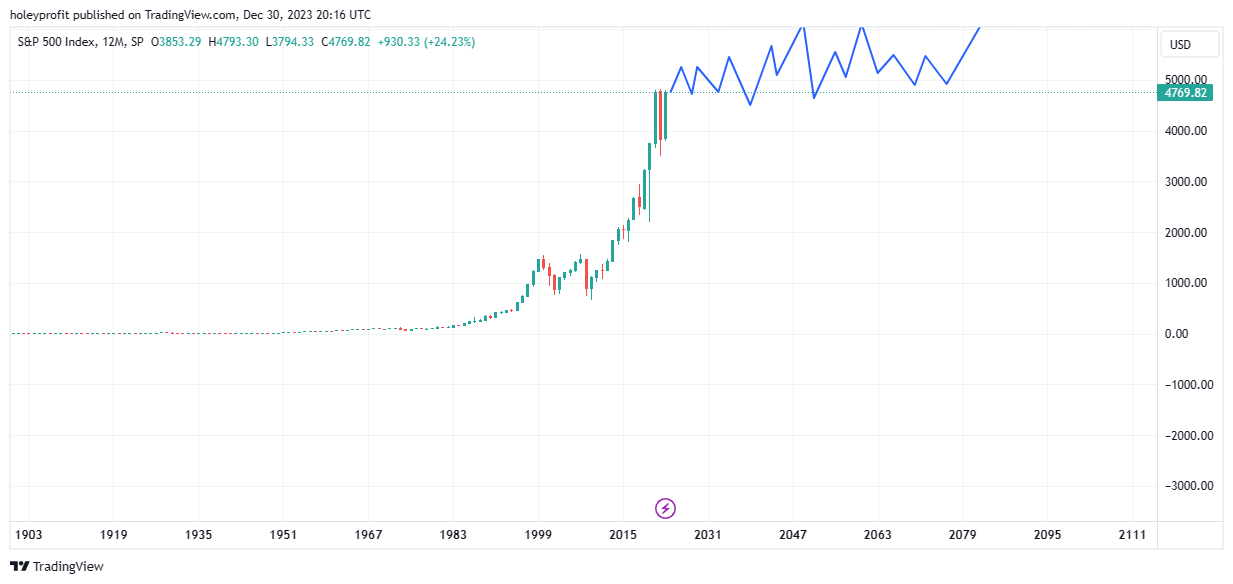
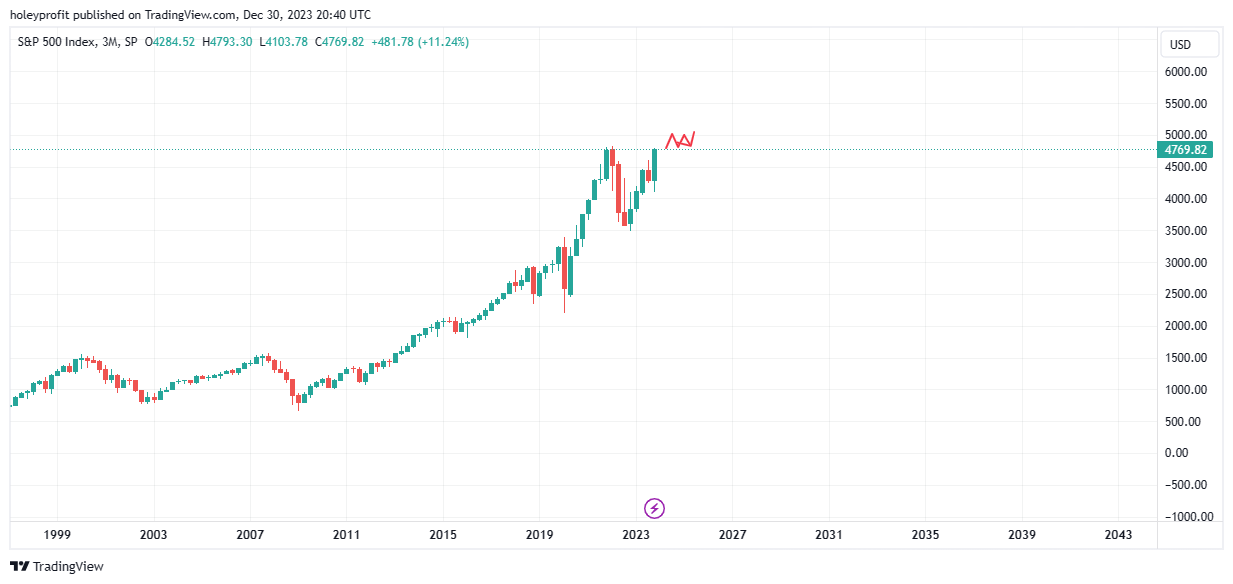
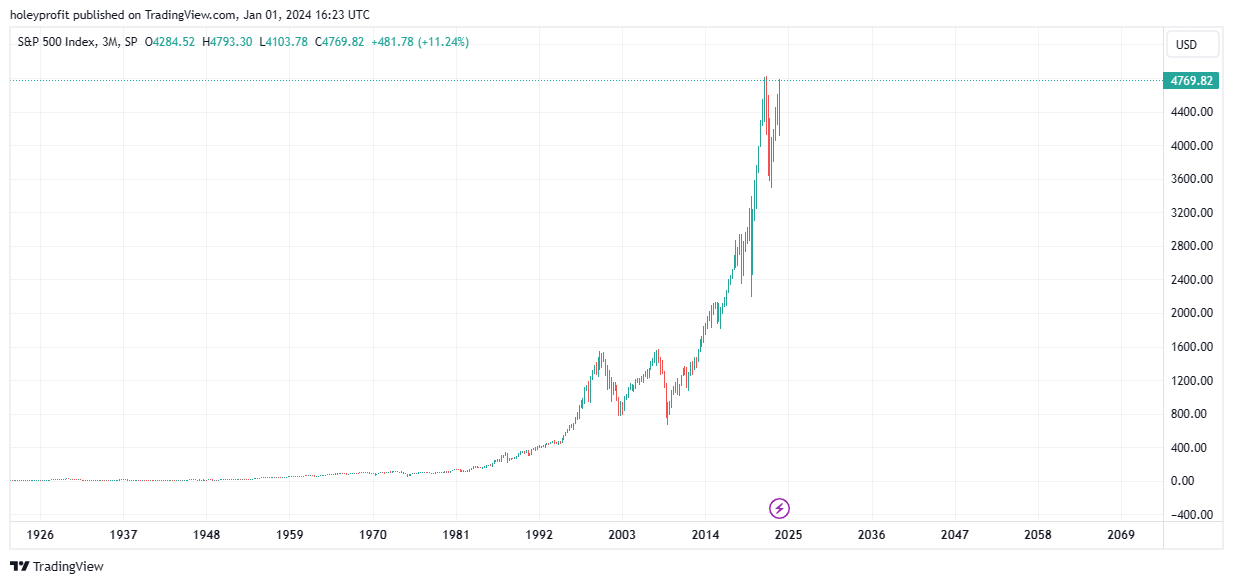
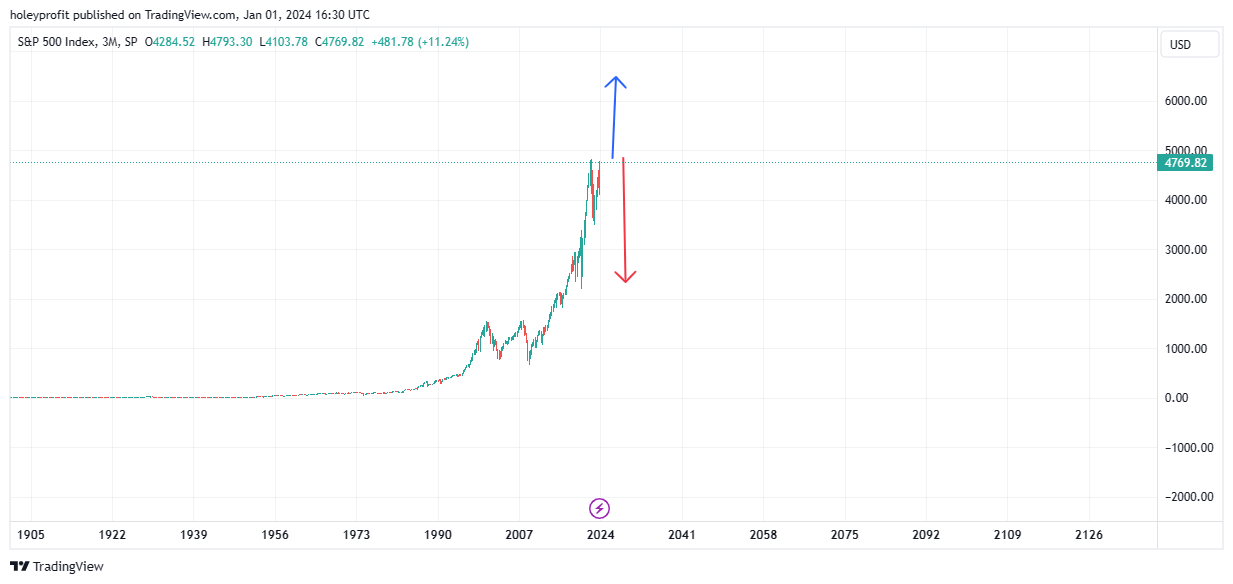
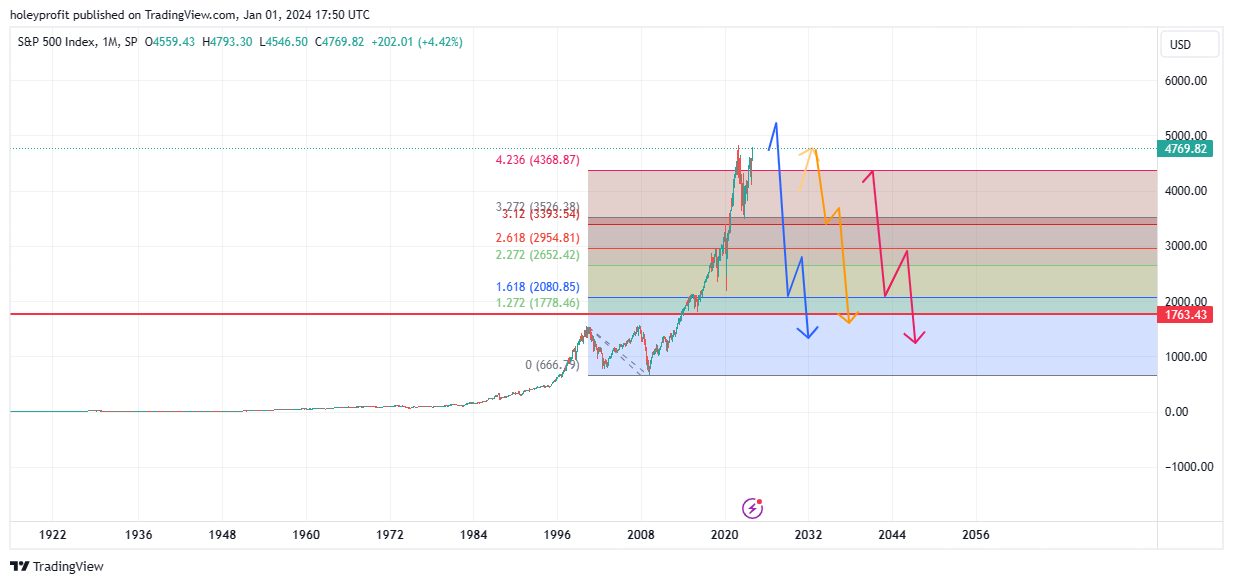
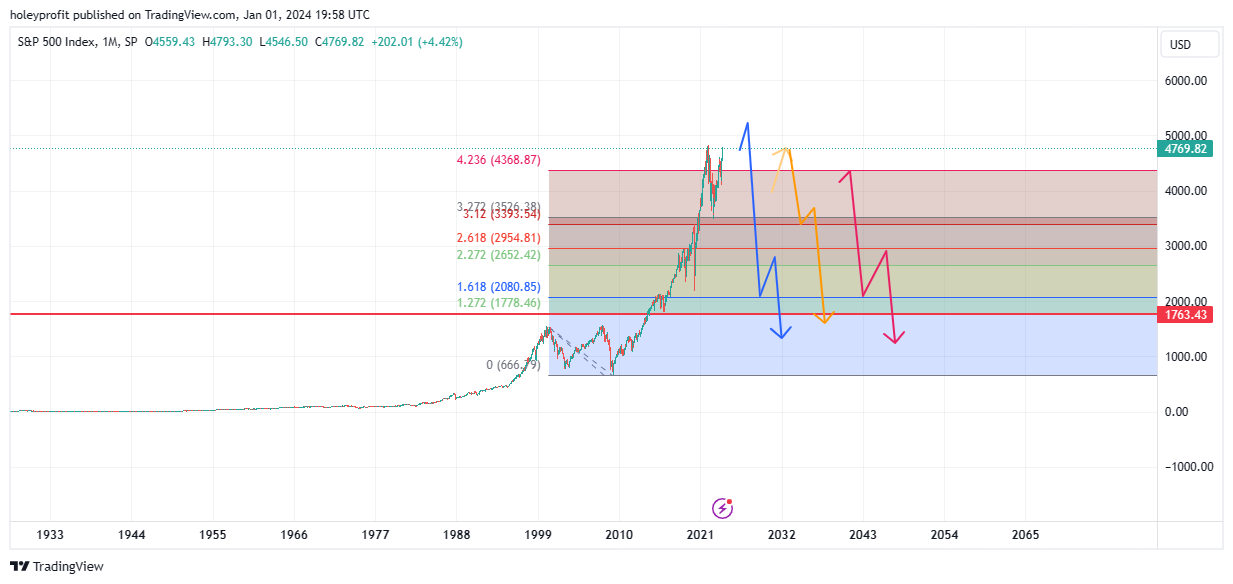
I believe indices are in an obvious bubble. The question, to me, is which stage of a bubble are we in. If we’re not at the end of the bubble, the only reasonable thing to expect is not only will price move higher, but it will move higher in a more aggressive way than it has to this point.
When viewed from a bird’s eye perspective after the fact, it’s always observable that bubbles get progressively steeper in their angle of incline. And if we’re not at the end of the bubble this means the only reasonable thing to expect is that the market will be unreasonably strong. That’s just how a bubble works.
After there has been a parabolic climb like this, market do not just calm down and go back to some sort of reasonable sustainable climb, like pictured below.
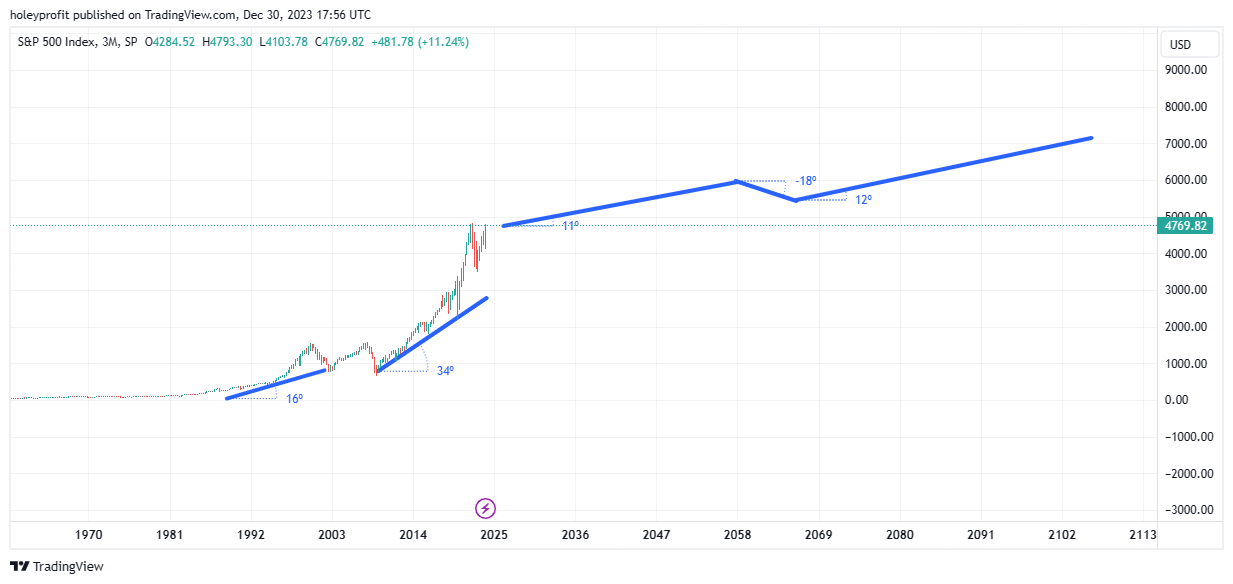
It just doesn’t happen. I’ve looked at a lot of things, and I can not see any reason to believe this will happen based on how all bubbles in history have worked.
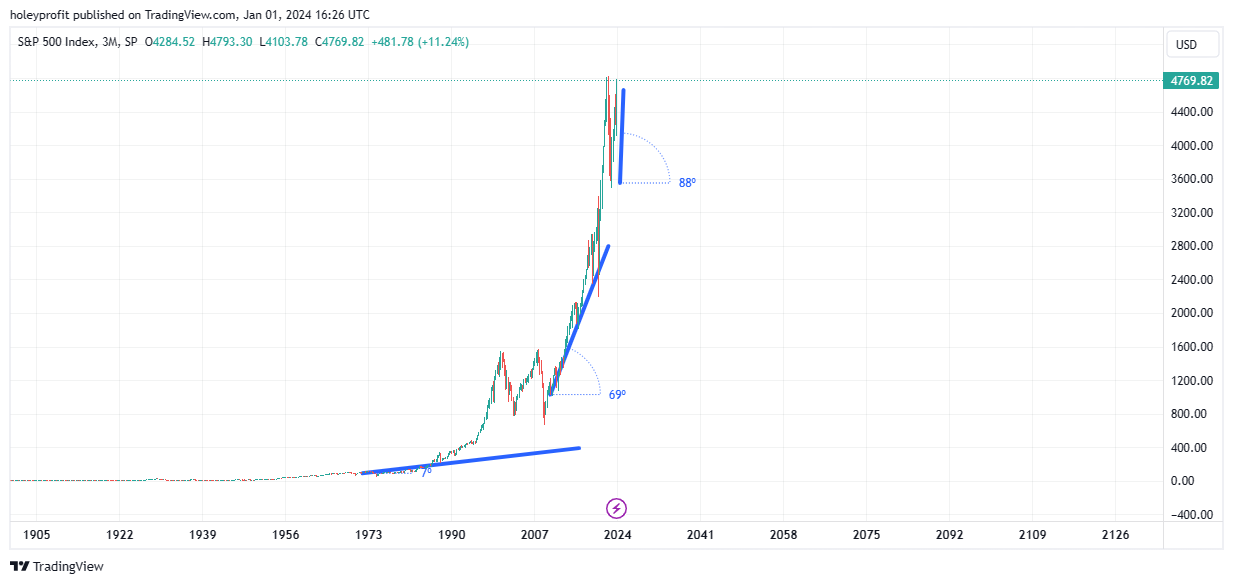
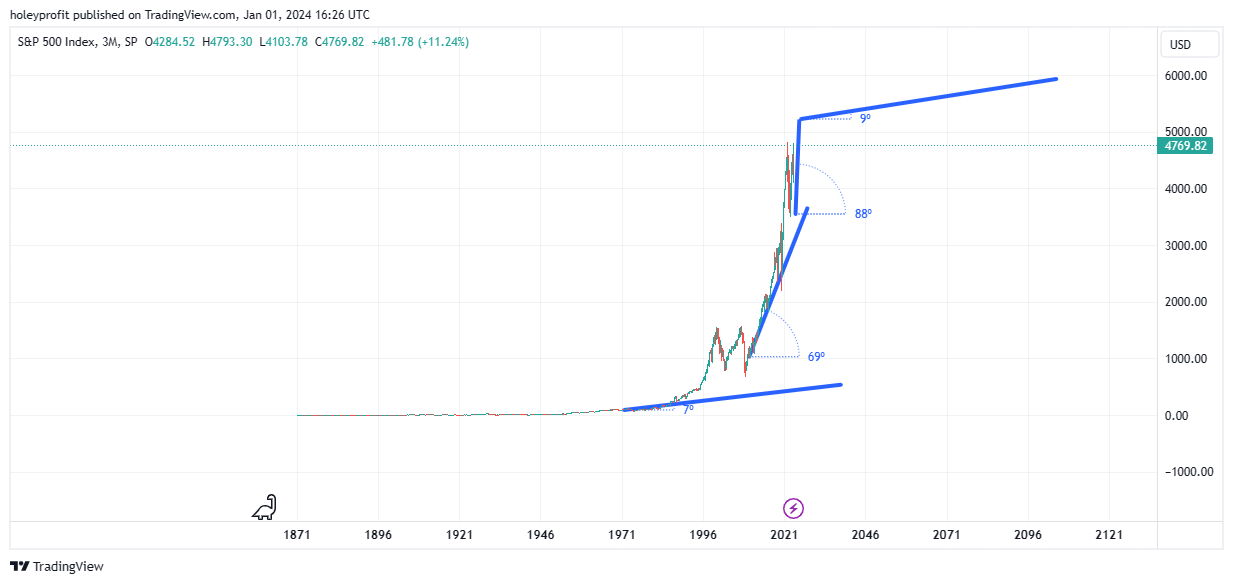
I think it’s very rational at this point to expect that there’s a strong chance we’d soon going to head into a trend of over 70 - 80 degrees. If we drop, we’d be looking at capitulation (Which is the nature of drops in indices for the most part, anyway) but if we rise we can be looking at exceptional overperformance.
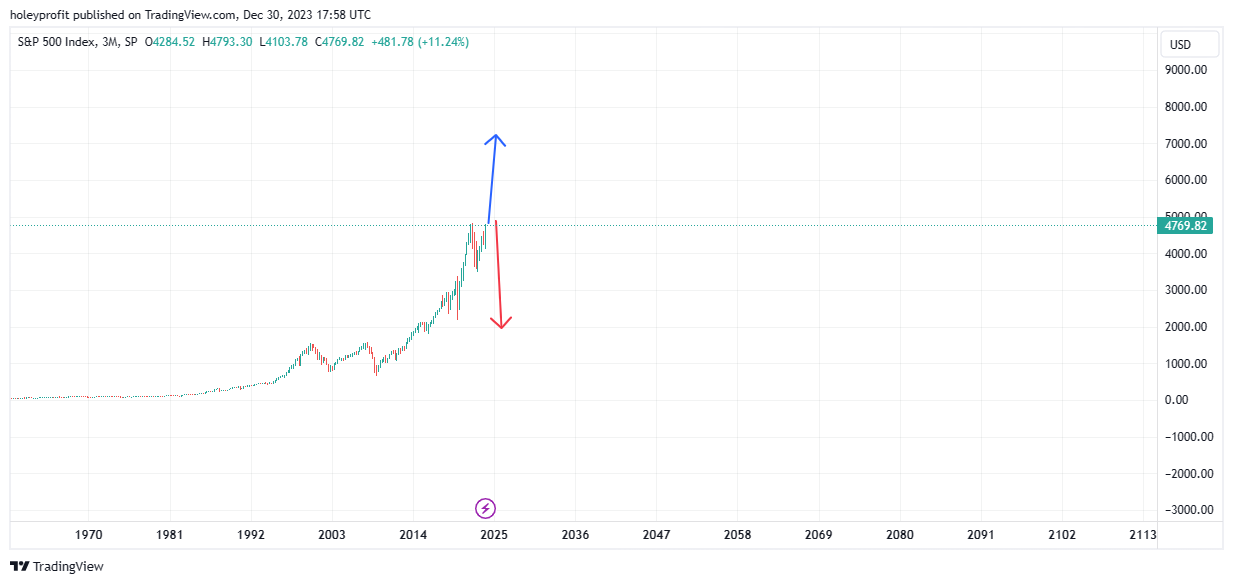
Parabolas do not resolve sideways. It’s probably big up or big down. In either event, we’re probably now inside the start of what will become a fat tail event - with the market moving up or down in an exceptional way. If we are mid-bubble we should expect two things:
SPX can double from here (Or come damn close to it).
This will be the fastest part of the overall move.
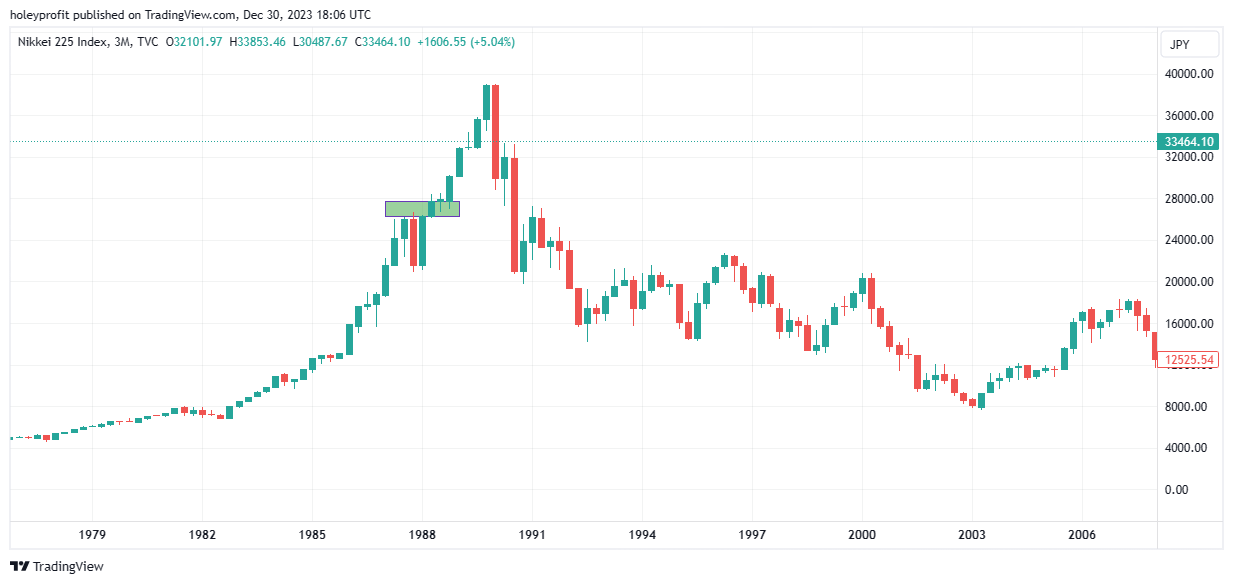
These are norms in bubble top. During the last leg of the bubble the asset in question about doubles. It does this incredibly quickly.
During 2021 this happened. The market doubled and it did it quickly.
Which I think is a major supporting factor for us being in the topping section of a bear move. However, if we’re not - then the norms of a bubble would suggest to us that it’s rational to expect that price can a) Double again. b) Do it faster than it did previously.
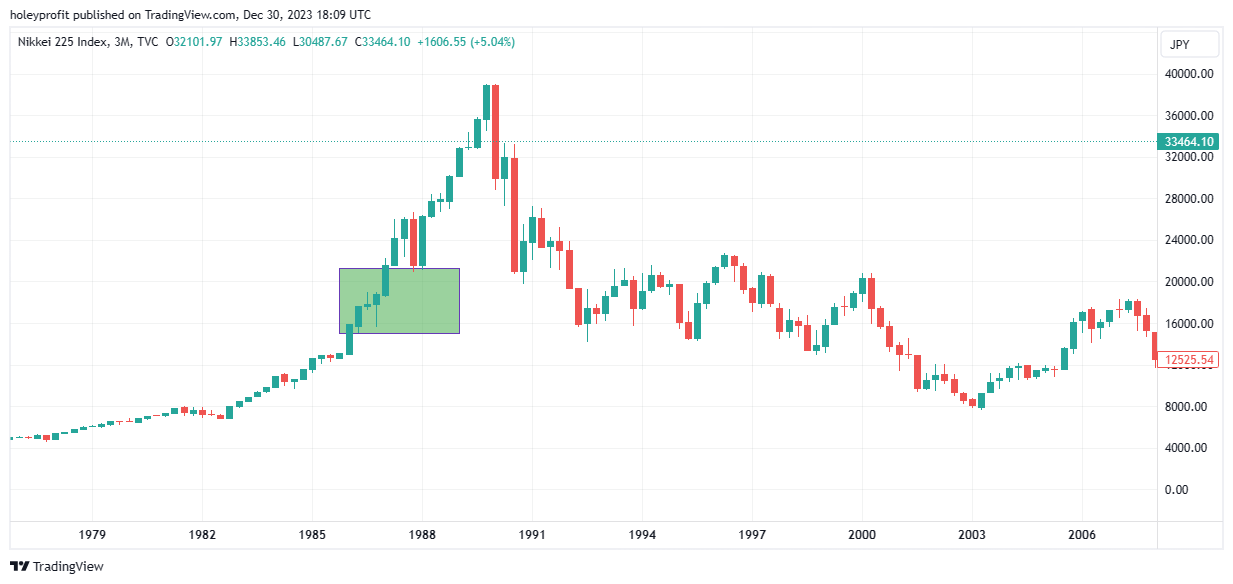
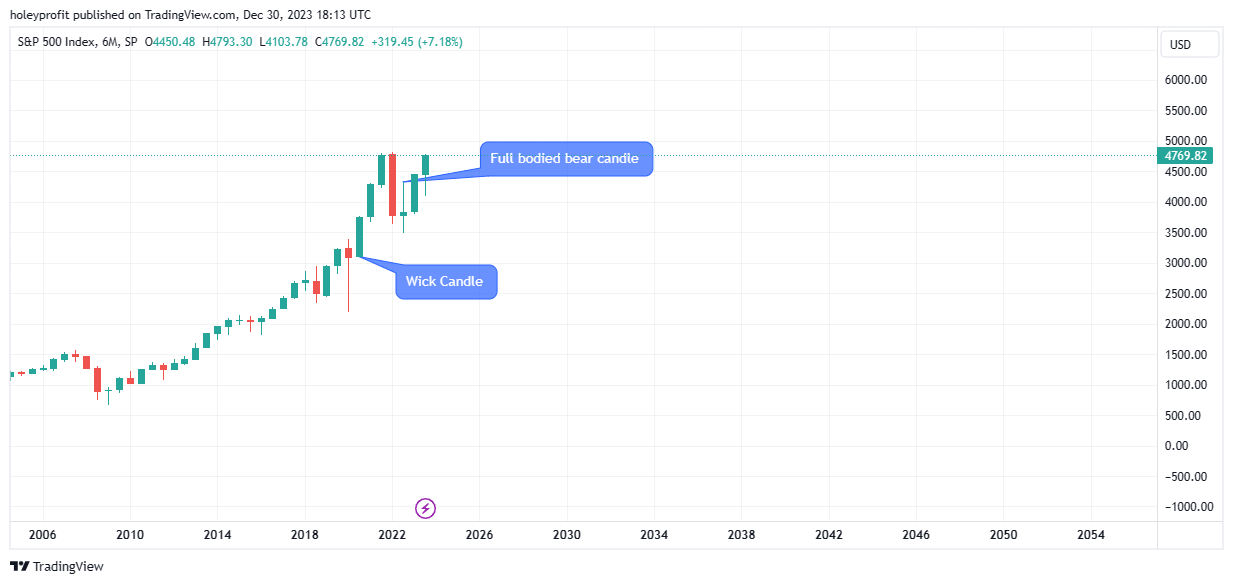
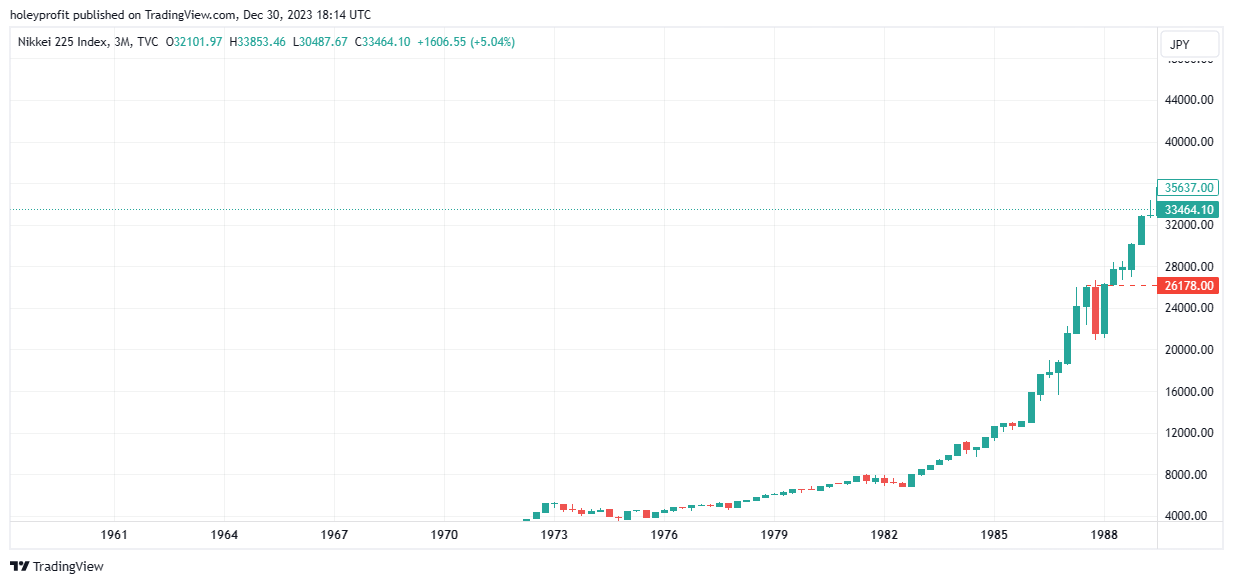
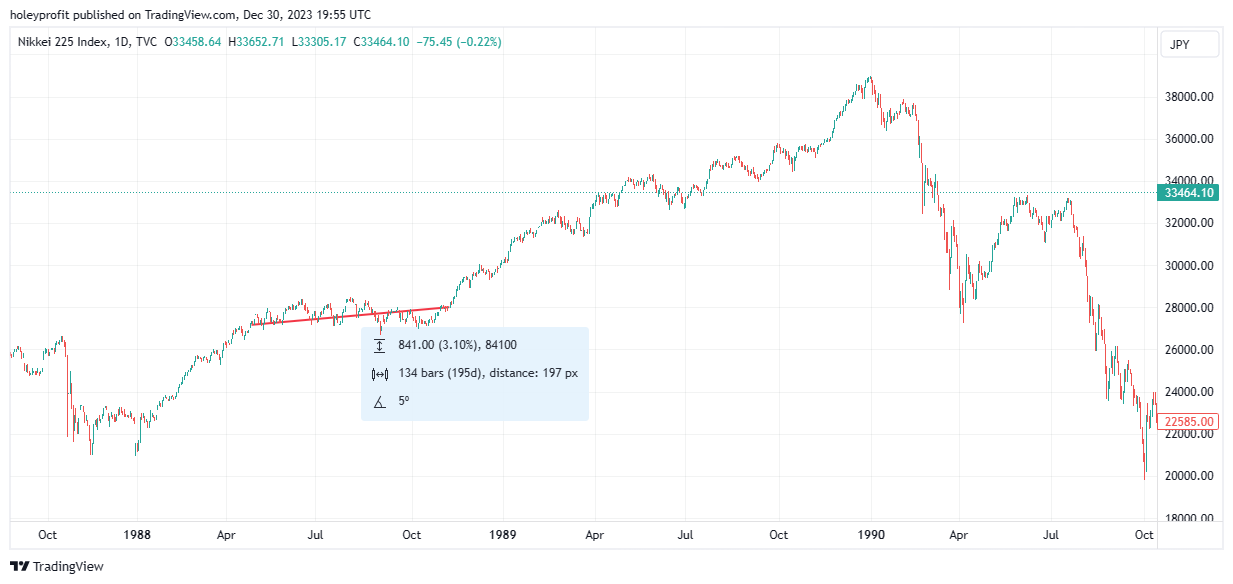
To provide a visual example, if we were not yet into the top of a bubble (But we are indeed in a bubble), we’d have to be somewhere similar to this point in Nikkei.
When presenting the case for SPX making a macro top in around this level my premise has been that this final blow-off happened in 2021.
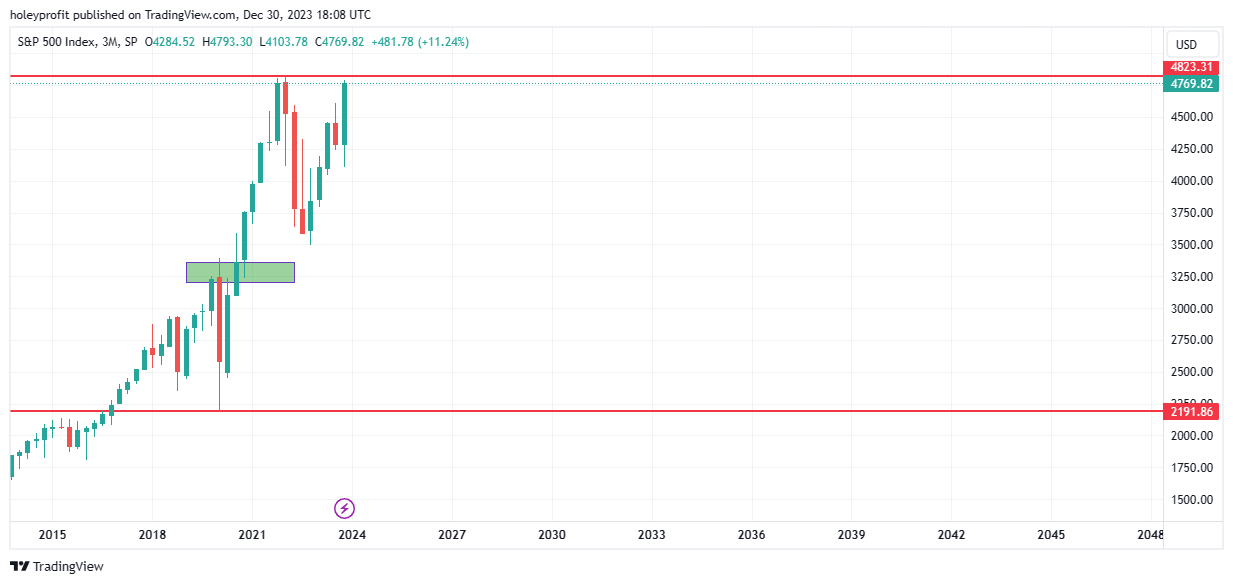
It makes a lot of sense to me. Similar charts, percentage gains, style of moves and (As much as I do not track these things for my analysis) fairly similar central bank stuff.
But if I am wrong about the specific top while being right in the broad thesis, it’s possible 2020 was just like this little wick candle.
A sharp pullback and rapid recovery. Then a slower pullback. And then a multiple candle uptrend into the true high.
And if we jump up timeframes on SPX this looks all the more compelling.
The only difference in these charts was the Nikkei bounce back to the high happened all in one candle. The SPX one has formed over three candles. That detail aside, there’s a good case to be made for SPX only being at this phase of the bubble - and still due another final rally.
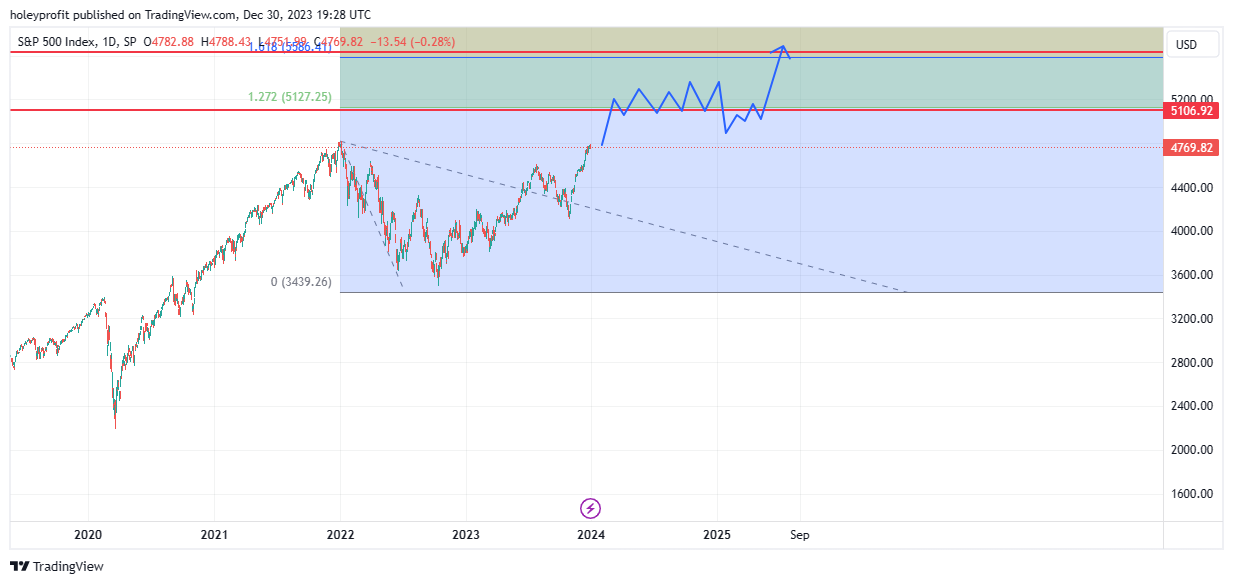
And when I drop this down to a daily chart so we can see what the trading above there looked like, this is what we have.
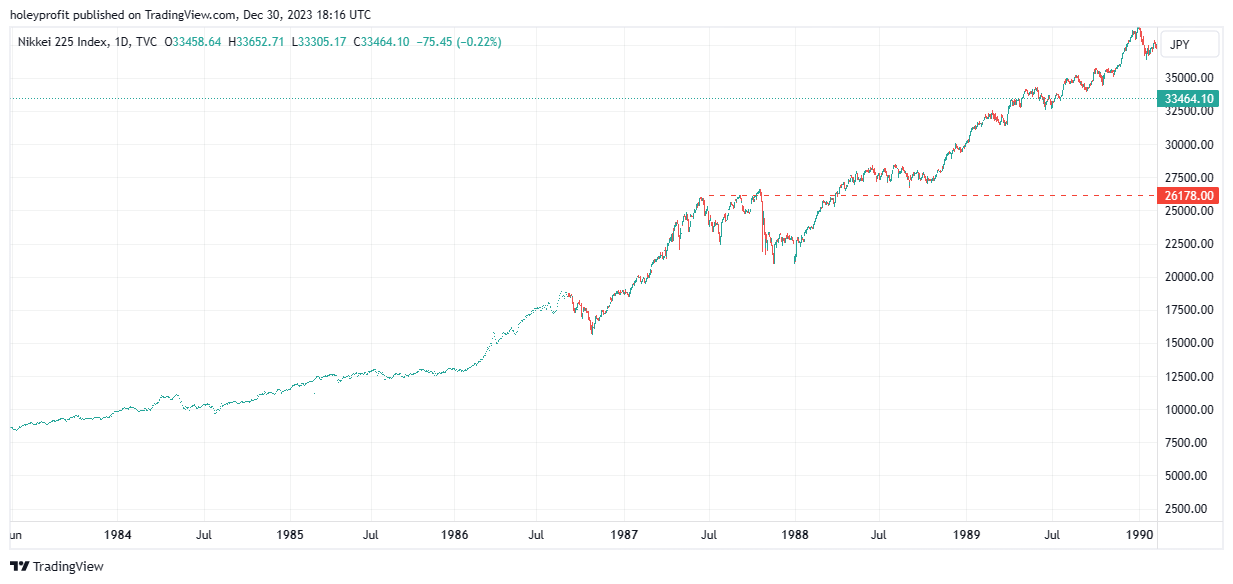
And this action I think is exactly what we want to be looking at the help us building our roadmap for a continued bull run without pre-break corrections.
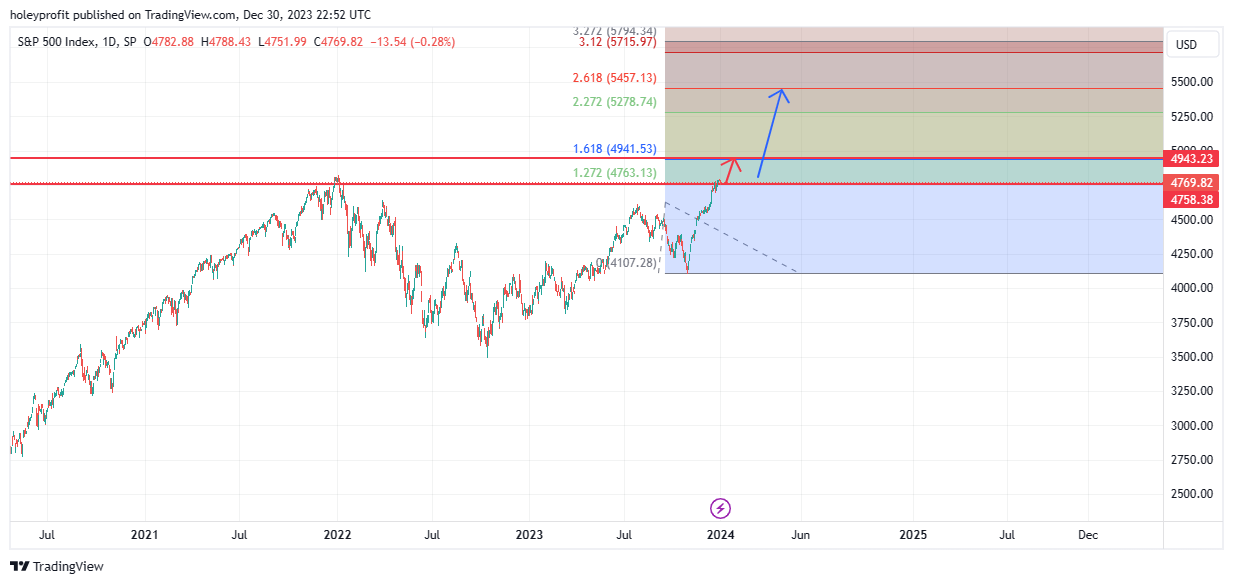
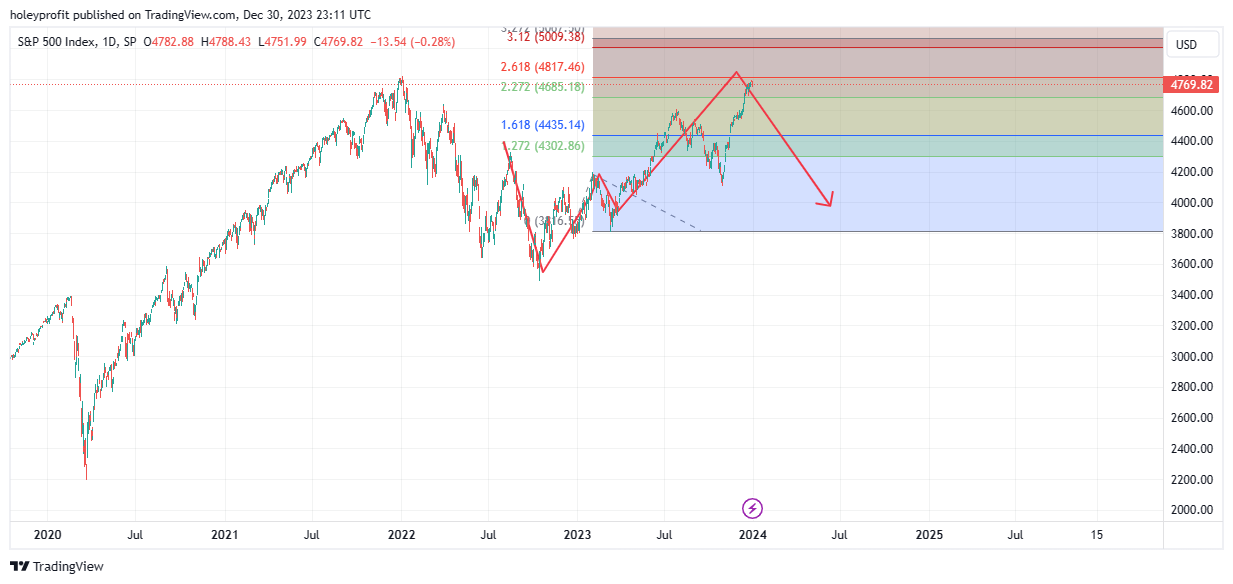
1.27 Pullback to 3.20 Head Fake
When planning for this style of move we want to fib to high to low of the 2022 move and use the extensions of this as our target and break levels.
In this setup we usually see the following sequence:
Pullback from around 1.27.
Retest of last structural high.
Accelerated uptrend through 1.61.
Following fib levels as targets.
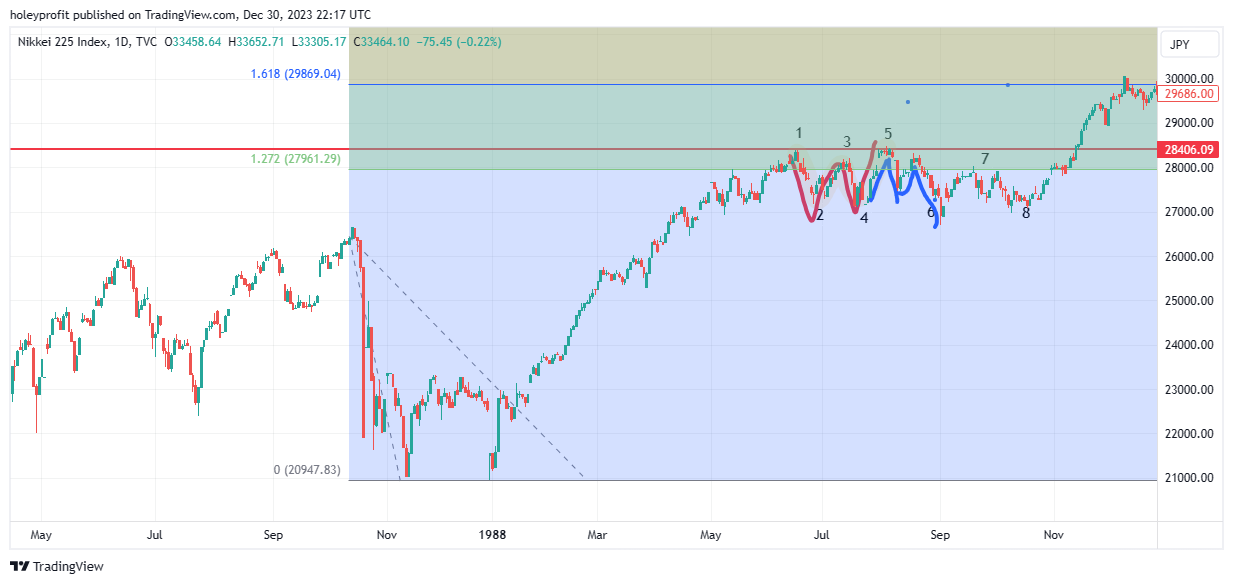
The Japan case was not perfect in these rules, but we can see something like the general stages of this when we draw the fib.
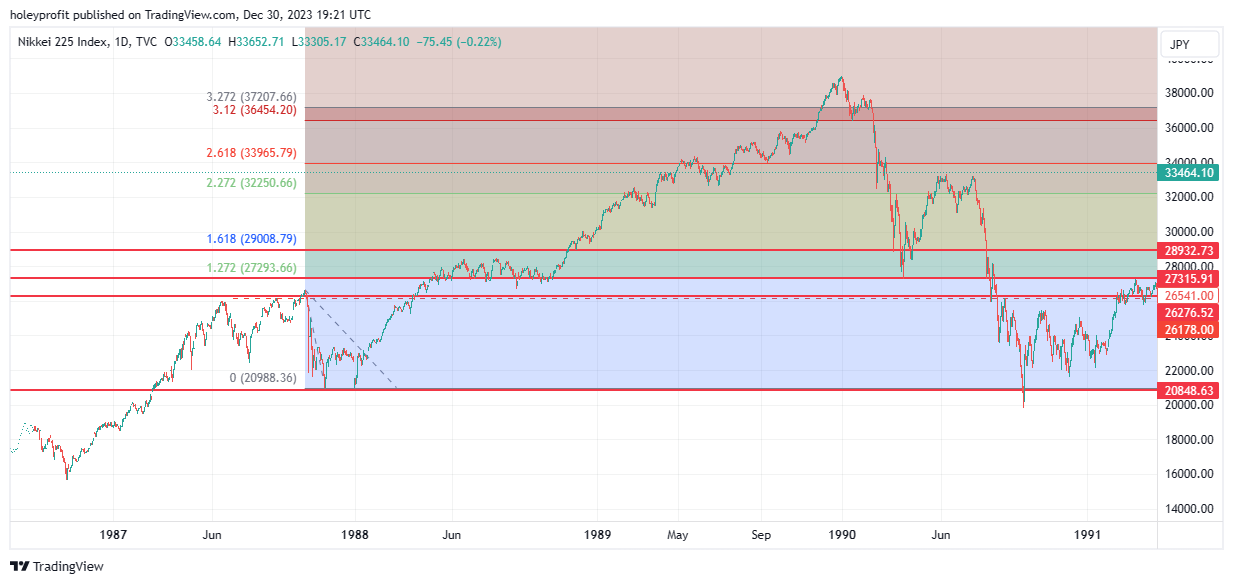
Trades a bit over 1.27 and does not quite retest the last high but clearly enters a stronger uptrend once breaking 1.61. Clear reactions on the following fibs. Once the uptrend is over, the same fibs set act as big target levels for the short trade.
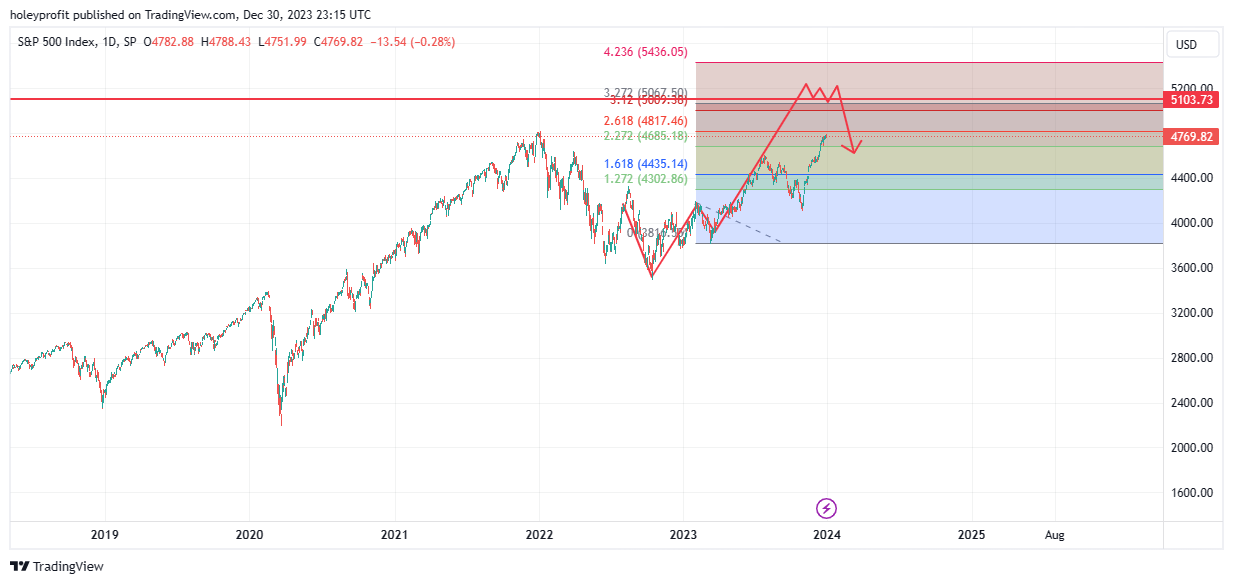
Extrapolating this move onto SPX gives us a trade plan like this.
With our big bullish trigger being the breaking of 1.61.
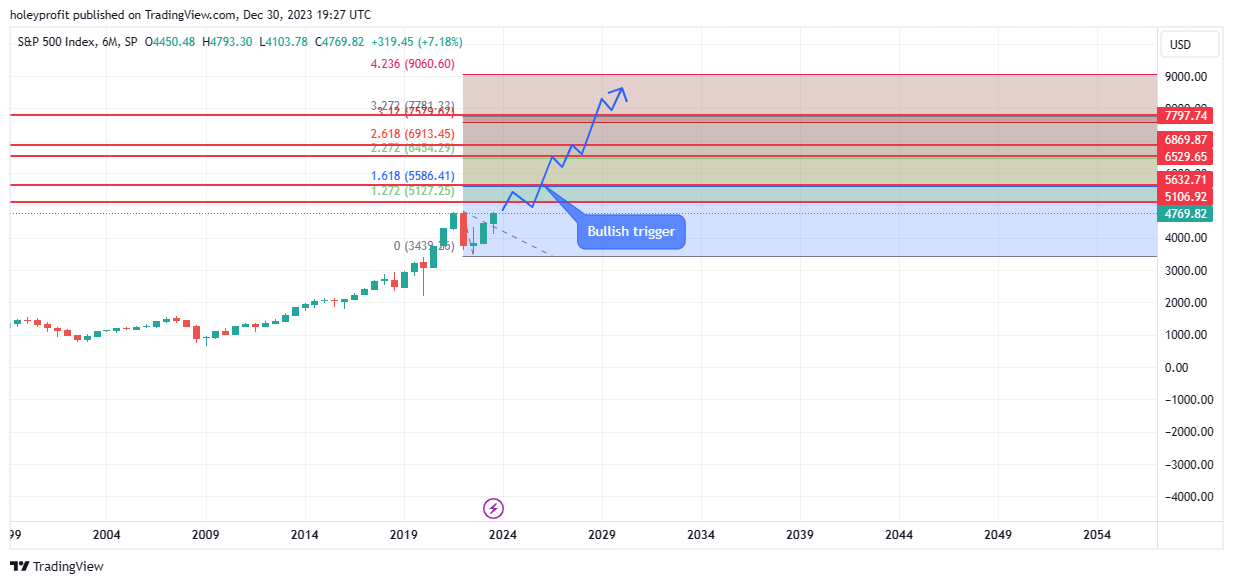
After the 1.61 break the uptrend is smooth. Before the 1.61 break we’d be likely to have a choppy market for a while in which there’s a lot of false breakouts.
In this scenario we’d be looking for a move to around 8,000 in SPX. This is also a scenario where we we could have a better chance to gage the amount of time the move would be expected to take since it should be the fastest move. To surpass 2021, we’d have to see this happen inside of one year.
If just trading naked options, it’d probably be best to wait for the pullback and something at least close to a retest of the last high before taking aggressive bets.
Since the potential for a range of a month or more is possible.
Call debit spreads targeting the furthest away strikes at today’s prices have extremely high return potential and since we’re dealing with spreads the theta decay of the range period would be offset. A bit over 6,000% return could be made in a rally to marginally over 7,000 in SPX.
Below is an example of a debit spread for late January of 2025 targeting a break of 700 in SPY.
Long Call:
- Option Type: Buy
- Option Details: 17th Jan 2025 $700 Call
- Price per option: $0.14
- Contracts: 1 x 100
- Total cost: $14
Short Call:
- Option Type: Write
- Option Details: 17th Jan 2025 $705 Call
- Price per option: $0.06
- Contracts: 1 x 100
- Total cost: $6
Spread:
- Spread Price: -$0.08 (net debit)
- Stock Price Range: $464 – $712
Estimated Returns (As at 30th Dec 2023 - SPY $475.31):
- Entry Cost: $8.00
- Maximum Risk: $8.00 (at SPY $700.00)
- Maximum Return: $492.00 (at SPY $705.00)
- Max Return on Risk: 6150%
- Breakevens at Expiry: $700.10
The above is exceptionally pay off and, as I’ve stated various times, I think if making bullish bets it makes most sense to bet on extremes. I think overall it’s a somewhat binary outcome for the bull move. There’ll be an extreme bull move or there would be any notable bull run.
Problem with this is the potential time a range could take. If we look at Japan we can see it took about 200 trading days to complete this range. basically a year.
Which means the overall bet of a move to over 7,000 could be correct but the move would only be starting to pick up around the time of options expiring.
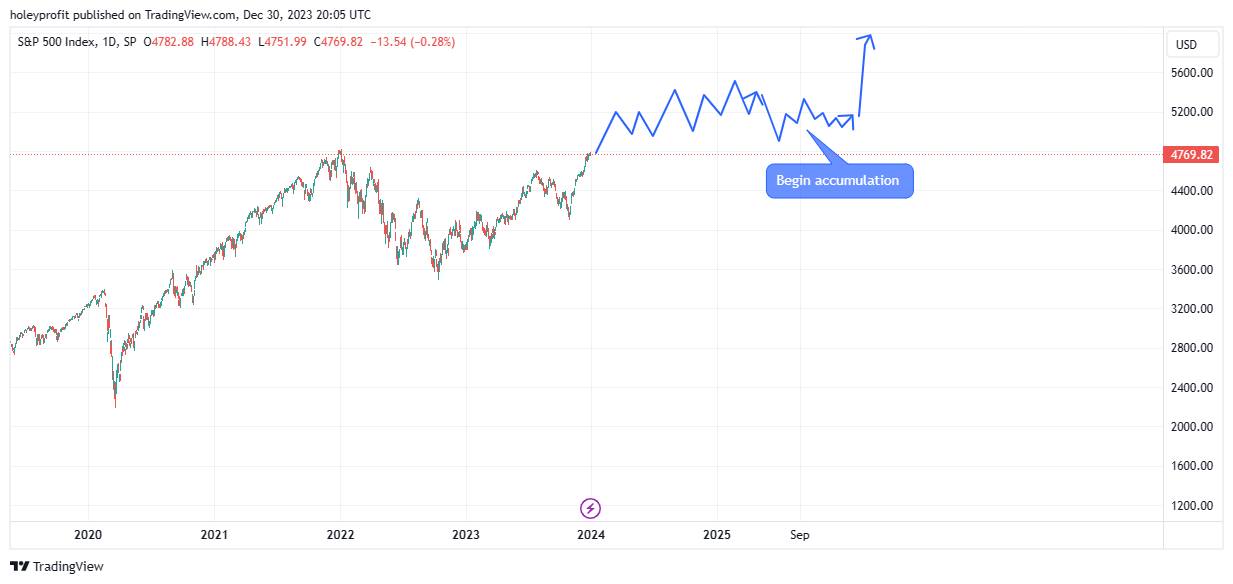
In the range into big breakout scenario, trading prospects could be somewhat dull for a while as the long term range forms. A big range would produce short term trends but there’d be no big moves to take advantage of for a while. A ping pong market, big bear trap. More range and then a real break upwards.
If this was to happen in the same style as Japan it’d be tedious for a while but we’d get a really good signal the move was getting ready to start when we had a false bear break that ending in a bullish harmonic pattern.
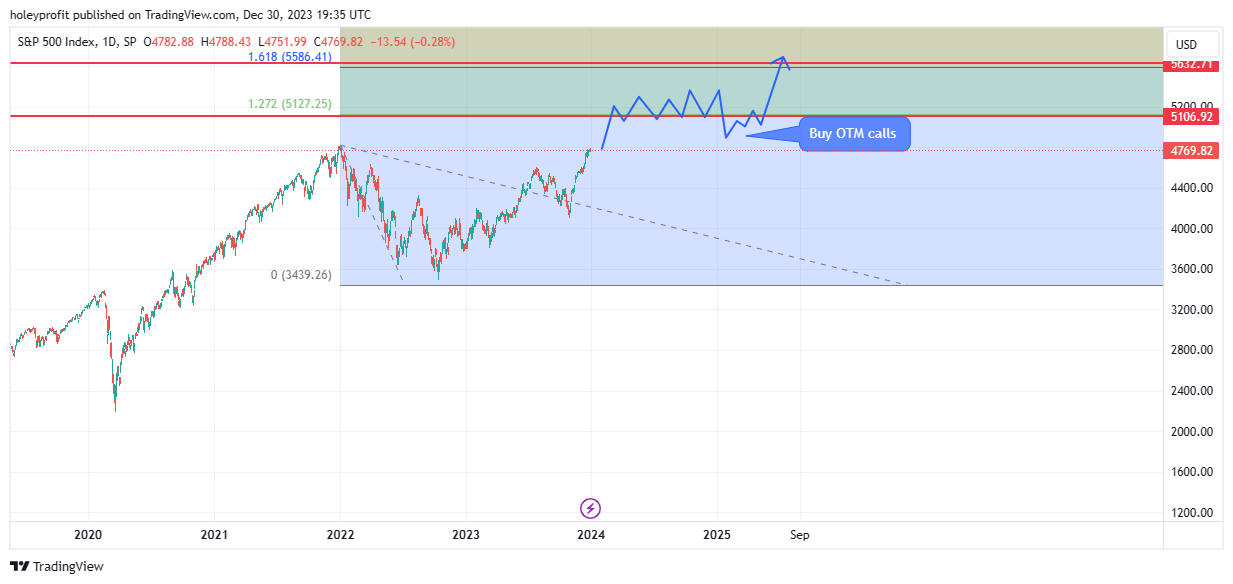
The market still trades flat for a couple months after this, but this would seem like a great time to start to accumulate a deep OTM call position.
This would be a great opportunity because we’d have a couple months to build up a position and the IV would be low since the market would be starting to price in a continued range much more than pricing in big breaks to either side - But be setting up to essentially double.
During the latter phase of this SPY calls for the 7,000 with 12-14 months on them would likely be priced under $15. Could be significantly lower, not likely to be higher. A decision on how much net risk you wanted to take could be made and then the position taken in sections as time passed.
As an example, if options cost $15 and I wanted to risk a total of $120 I’d look to buy one of these every week we stayed inside the range until I got to full risk. If I wanted to risk much more I’d buy them daily to build up my position. Either way, I’d be looking to scatter the time of my entries a bit - building a position for a breakout.
I think this thesis has a lot going for it. Would be a good mirror of the Japan bubble and also it seems like the type of move that could really beat most market participants. Bears would just be wrong about a sell off coming. Bulls would be right, but after long enough to make things really difficult for them.
Parabolas do not resolve sideways - but that does not mean the market can not go largely sideways for a year before something interesting happens. To see the true parabolic curve of SPX it’s best viewed on large charts. Annual charts, for example. And a year range on an annual chart is just one little candle.
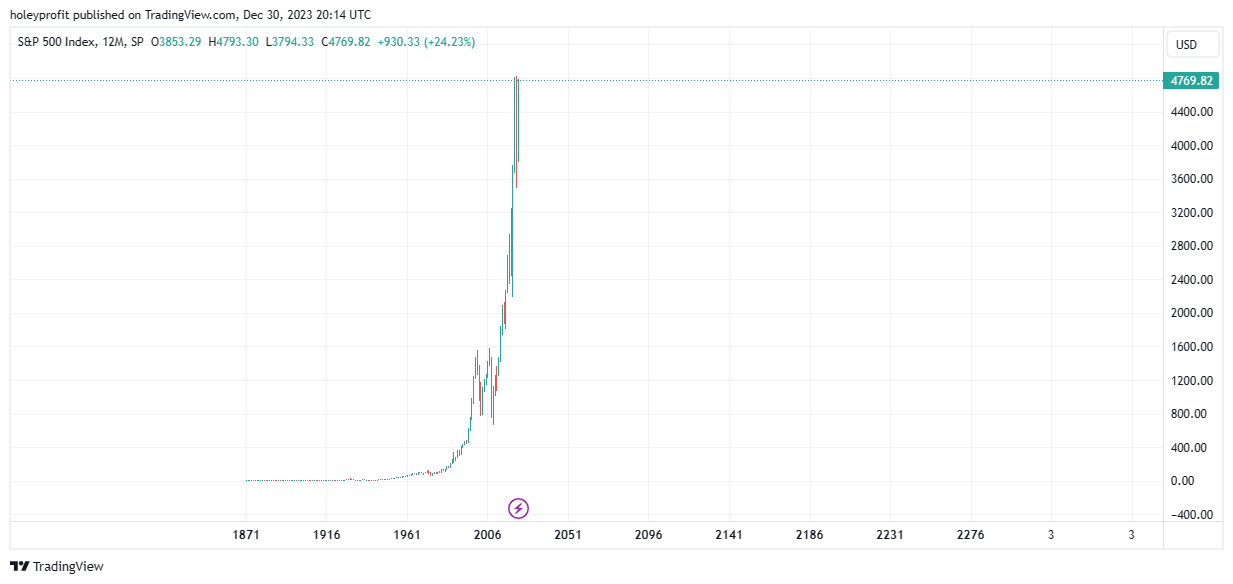
The move is highly unlikely to resolve itself in a long sideways trend.
But the year of 2024 being essentially a flat year is entirely fair game. It’d seem like the most punishing move given at this point most people have expectations of either a big top forming or us being inside of a blow-off top that can do nothing but pick up momentum.
1.27 Pullback to 4.23 Head Fake
Essentially identical in all comments as the 3.20 move described above but with another 1,000 or so on the expected top. A run to the 4.23 would be different from Japan but a bit more typical of the overshoots in trends we see in the modern day.
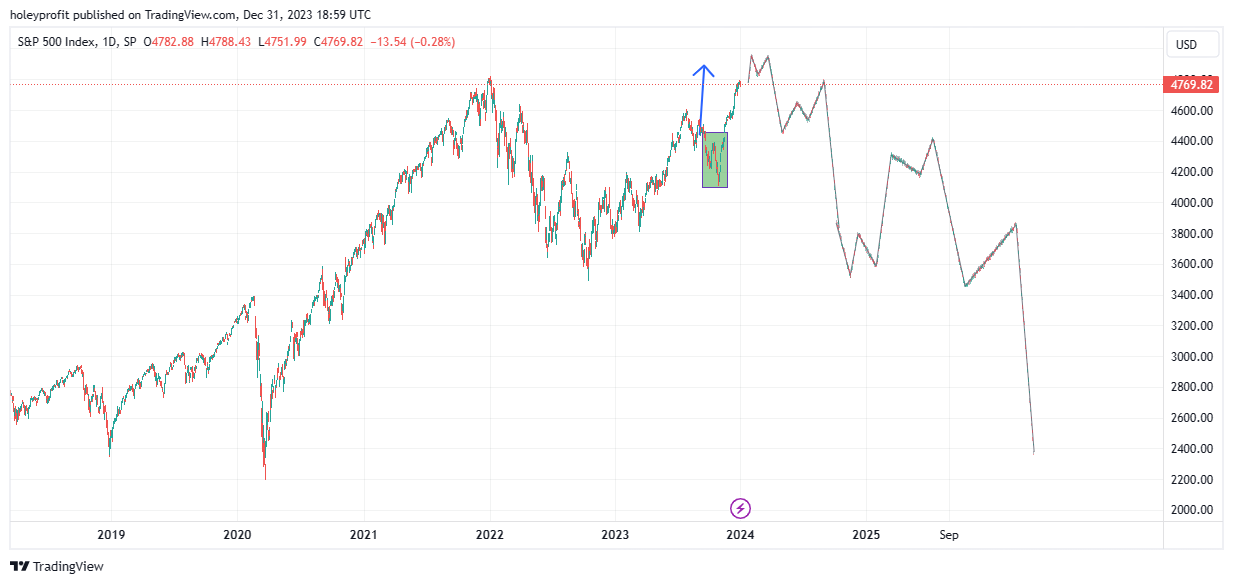
Late Bull Market
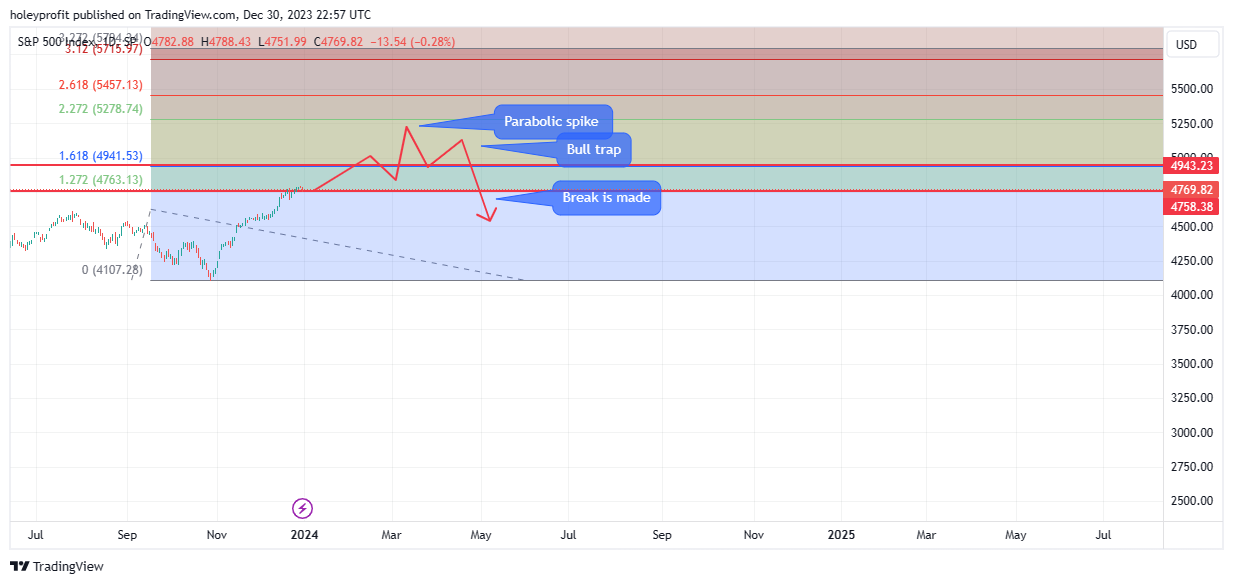
A late bull market scenario would be us building up a harmonic spike out of the all time highs before setting into a prolonged bear move. In this scenario the bulk of the bull move is now over but bears would be for the horn one more time before the selling started.
We’d be very late into the bull move but we’d probably be yet to see the most impressive short term move. Unlike in the more bullish scenarios above where the market creeps higher and ranges for a while before heading much higher - this would have us looking for a strong spike upwards to mark the end of the trend.
We’d be looking for extensions somewhere between 1.61 and 2.61 of the last big pullback in this scenario. There’s a lot of cross over between this analysis and the “Approaching Bear Market” analysis so we’ll cover the bulk of trade planning for this in a later section.
The one point we’ll make here is if we were heading into this type of move the signature of it would be an exceptionally strong final push to spike out the high.
Theta / Flat market
The risk of a 3-9 month range seems high. As discussed above if we were looking for a Japan-esk move we’d be looking for an uptrend to go a bit higher but then the market entering a trendless state for over 6 months. Short term intraday trends but overall monthly range.
This range risk also applies to a bear move where we nominally spike out the last high. In this type of setup if we were topping we could build up a bearish harmonic or some traditional topping patterns like a triple top or head and shoulders. All of these are going to express themselves as big ranges.
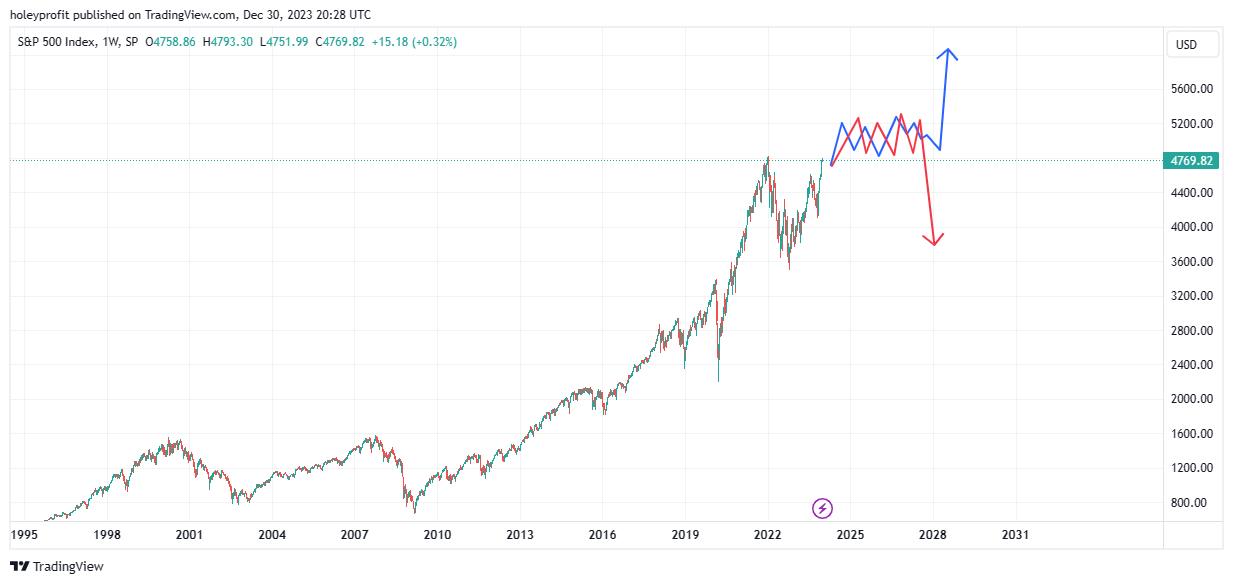
I think this is a considerable risk. Maybe one of the most unexpected moves at this point. We get to 5,000 and then the market just goes dead for 3-9 months. Trading in this scenario will be mostly looking for mean reversions. Every time we get to extremes of the range bet we return to the middle of it or the other end of the range.
If we get a serious long term range, we will most likely see a big false breakout of the range to the opposite side of where the true break will come. So the game plan will be basically to bet on the range holding. Take a hit on the false breakout but once that move has happened start to be more active in planning bigger trades.
I’d go as far as to say that some sort of 3-9 month range trap may be the most likely outcome. It can be well supported in both bullish and bearish scenarios and I feel like it’s the move fewest people have on their radar. I think sentiment is in the main split between SPX over 6,000 and SPX under 3,000. Not SPX 5,000 for a year.
As much as I feel some sort of major move much come from this setup (Given this style of move usually resolves in a crash or a steepening of the angle of the uptrend) we are looking at these things on big charts and everything would still make sense in these big charts if the market did nothing for a year.
Whether you’re looking at bullish or bearish patterns, if the 3 month chart went up and down for four bars - it would change nothing.
The market doing this would not invalidate various different analysis points to be bullish or bearish, but it would wreck any bets on big moves made based on it.
I feel like I lean towards this being the outcome I find most likely. It’s far from my preferred one. I’d pick various different trend moves over a 6 month range. It’s just seems devious enough to be what will happen. Lots of action goes into lots of chop - and then some sort of exceptional move.
Ranges are complicated for traders, in my opinion. I used to just say I didn’t like ranges because it’s easier to make money in trends and reversals. However, I’ve learned through the years that making money in a range is exceptionally easy if you know to bet on us being in a range. High RR spots on either side of it.
The problem is, at which point do you define the market is in a range? Usually by the time you can say the market is ranging it’s more accurate to say the market “Has been” ranging and the longer the market has been ranging the closer to a breakout we, logically, should be.
Usually to define a range we’d be looking for the upper and lower ends of the range to hold two to three times. This is when we’d spot that we’re obviously in a range. But we’d not see these things until usually at least half way through the range. The more obvious it is, the closer it should be to breaking.
Making money in a range can be really simple. If I know we’re heading into a 6 month range and I can define the upper and lower parts of it, I can make money for 4-5 months with almost zero effort. Ranges are the conditions where it’s easiest to run automated strategies or passive strategies (Like option selling).
The key to our success in a range is knowing the area in which it would be likely to happen and being willing to bet early on range like conditions happening. Because if we bet early on a range developing and are right - then by the time we’re into the riskier part of it we’ve already made much more than we can lose in a range break.
I really would prefer we did not make this move but it’s one of the ones I am allocating most thinking energy towards. There are various things that imply range risk. Getting the range wrong would be exhausting. Months of tedious false breakouts wear you down if you’re not ready for such action.
Range risk exists in both the bullish and bearish setups. We’ve covered the Japan-esk range risk and also it’s a known of market tops that we can range there for a long time. With that being said, if we range for a sustained period of time my bias will be firmly skewed towards the bull breakout and accumulation of calls late range.
As an approximate timing guide, 3 months of range for a bearish move and over 4 months I’d be more bias towards the eventual break being a bullish one. If we range for over 6 months, I’d think this sufficient to “Refuel” for the run to over 7,000 in SPX. A bear top I’d expect to be tedious but take less time.
Bullish Range
Bullish/bearish range is an oxymoron but we’re using these terms in the context of what we expect to see after the range. A ranging top and a drawn out range before a bull run can be expected to behave differently from each other. Let’s now look closer at the Japan range before the breakout.
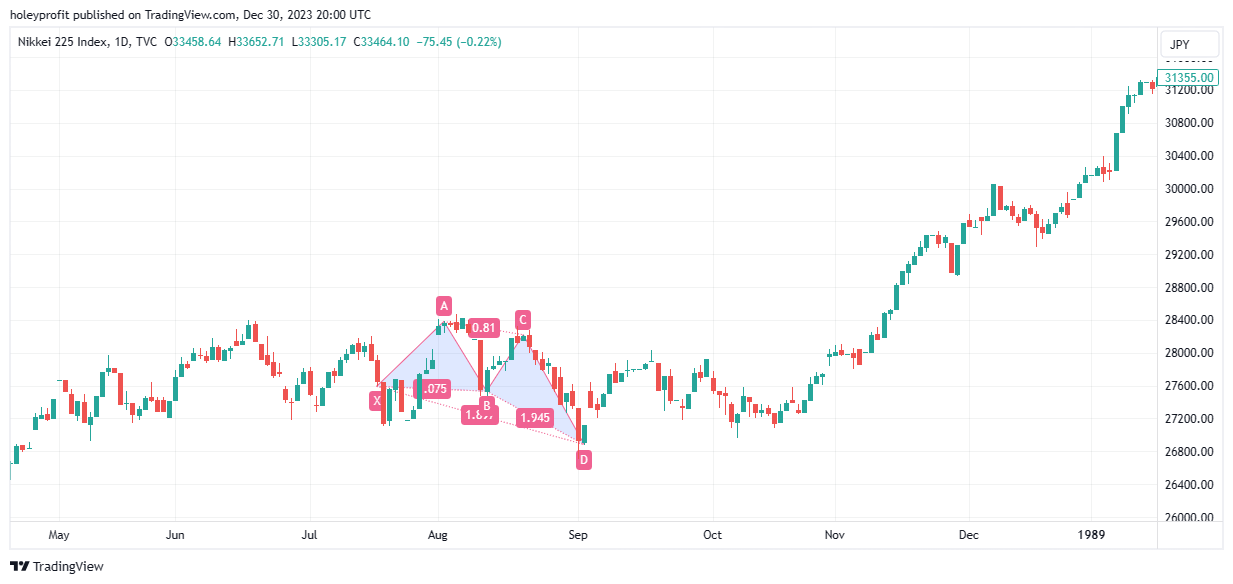
We can break the Japan range first into around 8 main moves.
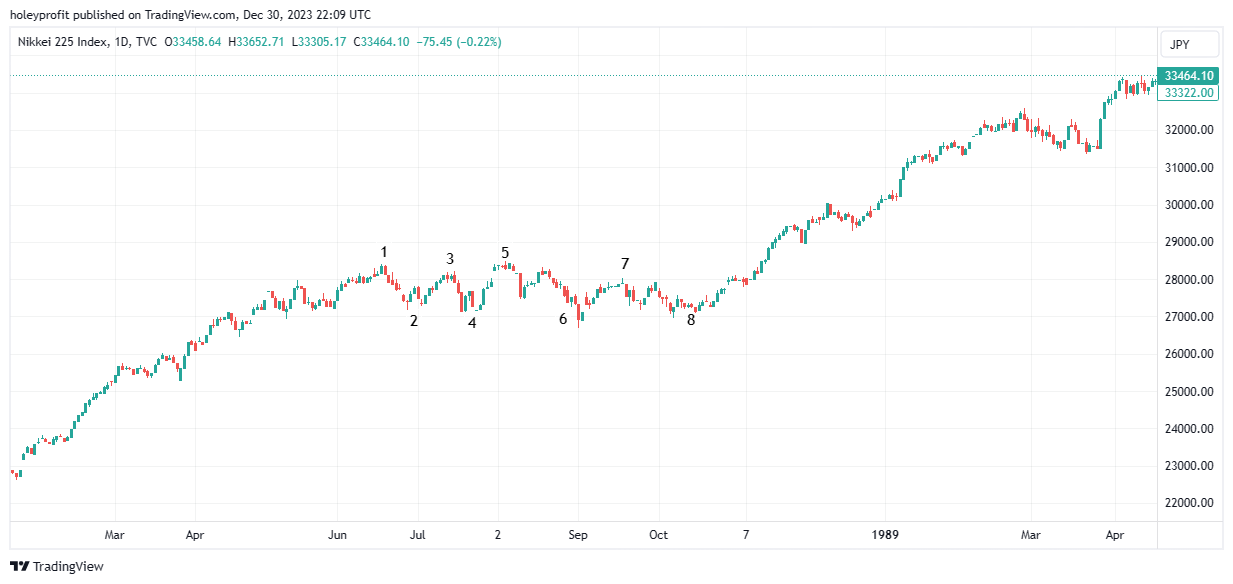
Number 1 is where the range begins and number 8 is where it ends. The easy uptrend stops at 1 and 8 is the last time we’ll hold the range.
The first part of the range can be broken into two harmonics. We have a W like shape and M like shape - combined, these make up the bulk of the range.
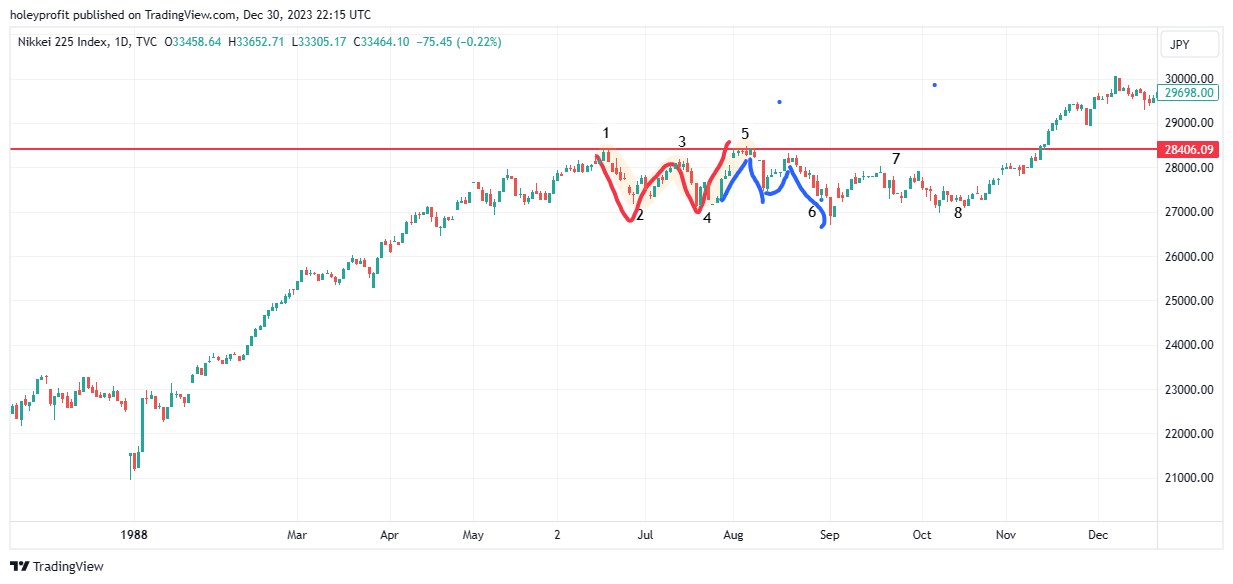
This happens around the 1.27 extension of the last drop.
This isn’t atypical of a range. They will usually be able to be seen after the fact to have been mostly built of harmonic patterns. In a bullish breakout, the range most commonly comes in the 1.27 area and it retests the breakout. Chaotic in real time, unless you know to be prepared for this type of action.
Ideally we want to do three things;
Define range zone.
Approximate length of range.
Know when to bet on a range breakout.
If we were about to enter into a 6 - 9 month range. these three things would be the most important for us to look at. With these three things, we have high probability of success during and after the range. Without them, we have low probability of both. Even if we pick the right direction, we' can be chopped to death first.
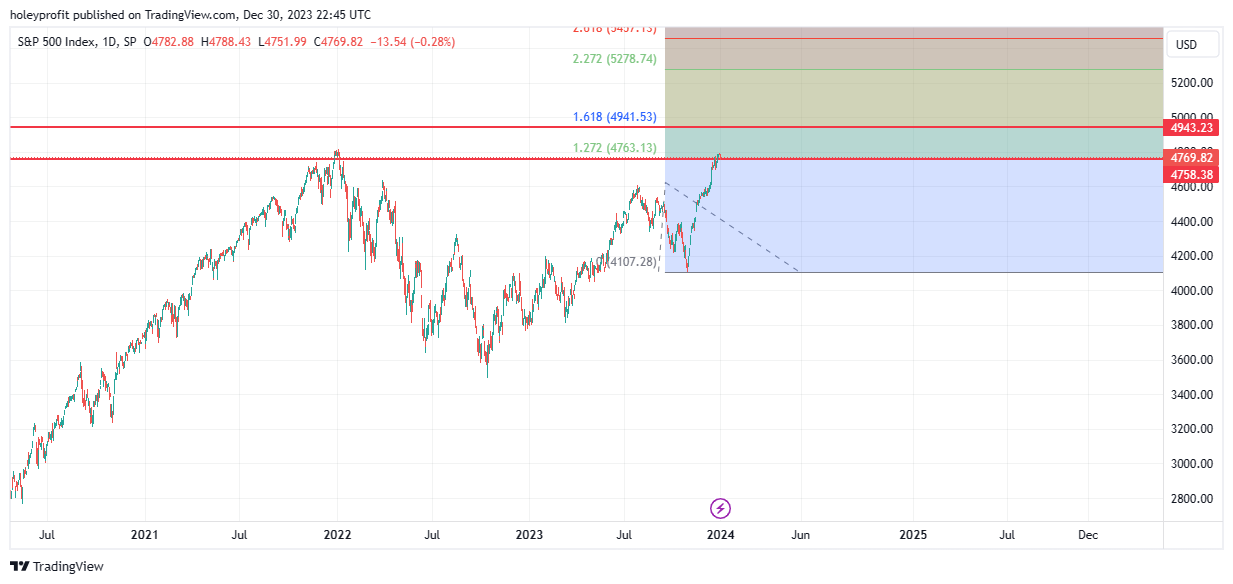
Our range zone is quite easy to define. We need to fib high to low of the 2022 drop and we know we’re looking for our range high to be somewhere in the 1.27 area. And since in this setup we’re looking for biggest drop to be a retest of the break, we can define our extreme range low as the 2022 high.
We can broadly define our extremes of the range as 4800 - 5400. 4900 is low in the range. 5300 is high in the range.
If we were to make something similar to the Japan breakout we’d be looking at three main short levels high in the range and then a big false breakout of the lows.
Once we have seen the false breakout we can start to accumulate long positions. If we get a big 1.61 break we can then start to trail our stops aggressively betting on consistent higher lows and we can add to our positions expecting the uptrend to hold until at least the 2.61 fib.
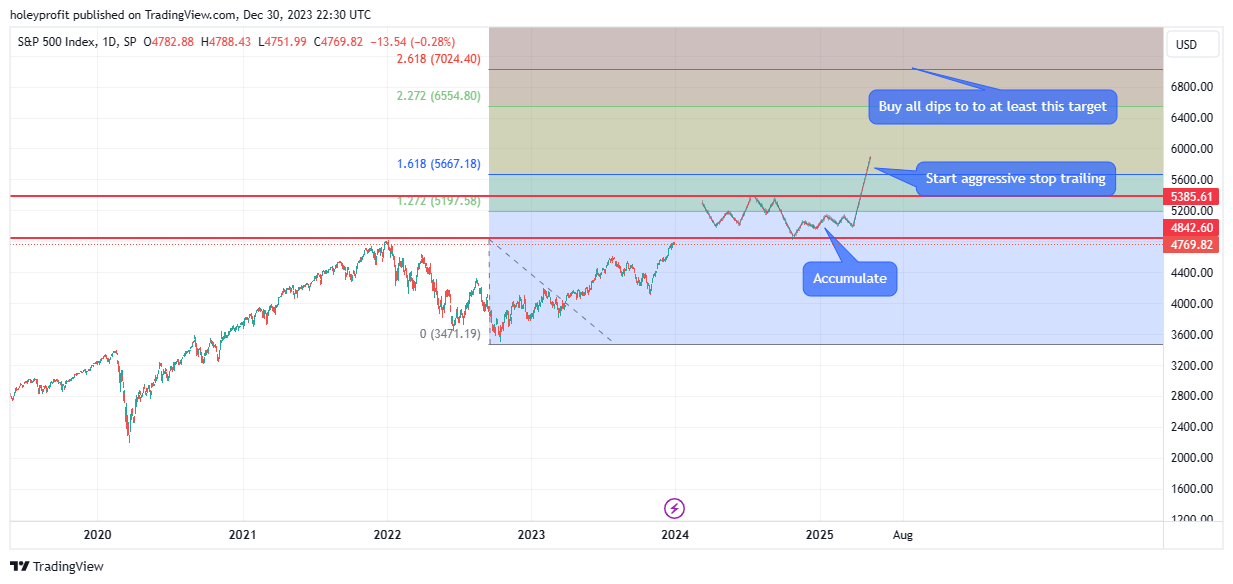
If we get that high, then there’s likely to be a strong and smooth run up to the next fibs for a final target. All dips should be shallow. We just have to trail stops as per structure and be patient. As we get close to the next fibs we apply increasingly aggressive (Even automated) trailing stops.
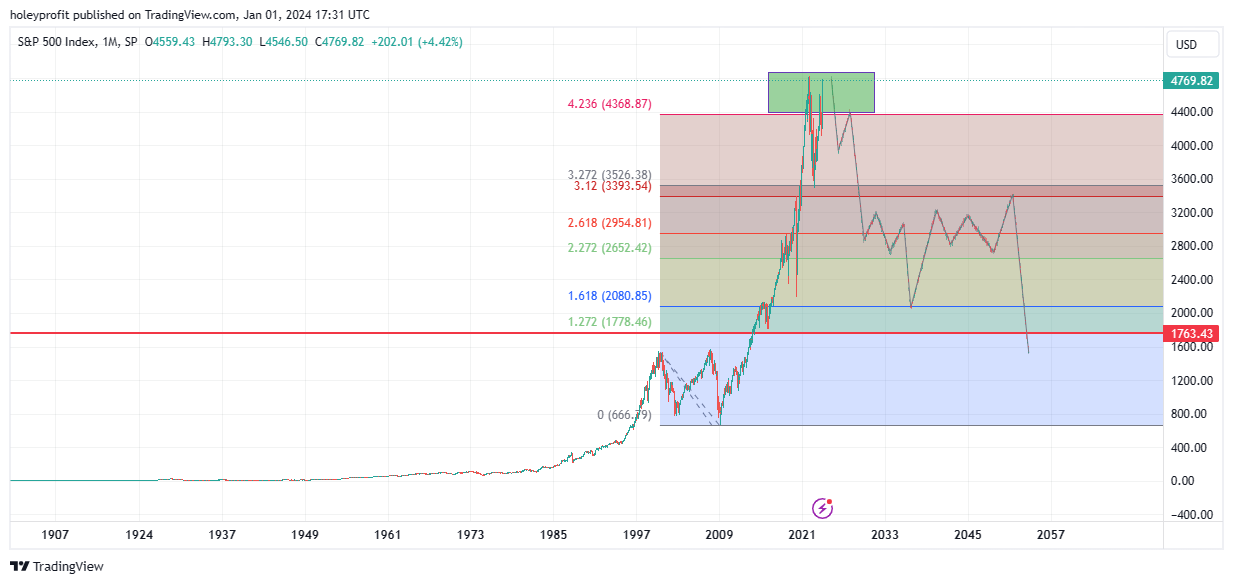
Bearish Range
A bearish range could form is we complete a butterfly pattern that will go on to be successful.

In this type of move all the real action happens very quickly but there’s liable to be long periods in which nothing much is happening.
A butterfly will typically travel quickly to the 1.61 and false start off it. Then making a second big spike out. This will be expressed as strong trending swings both ways in real time but is effectively creating a range with spike outs. Usually a smaller harmonic builds up.
This move would take us up to this section. Where the high is made.
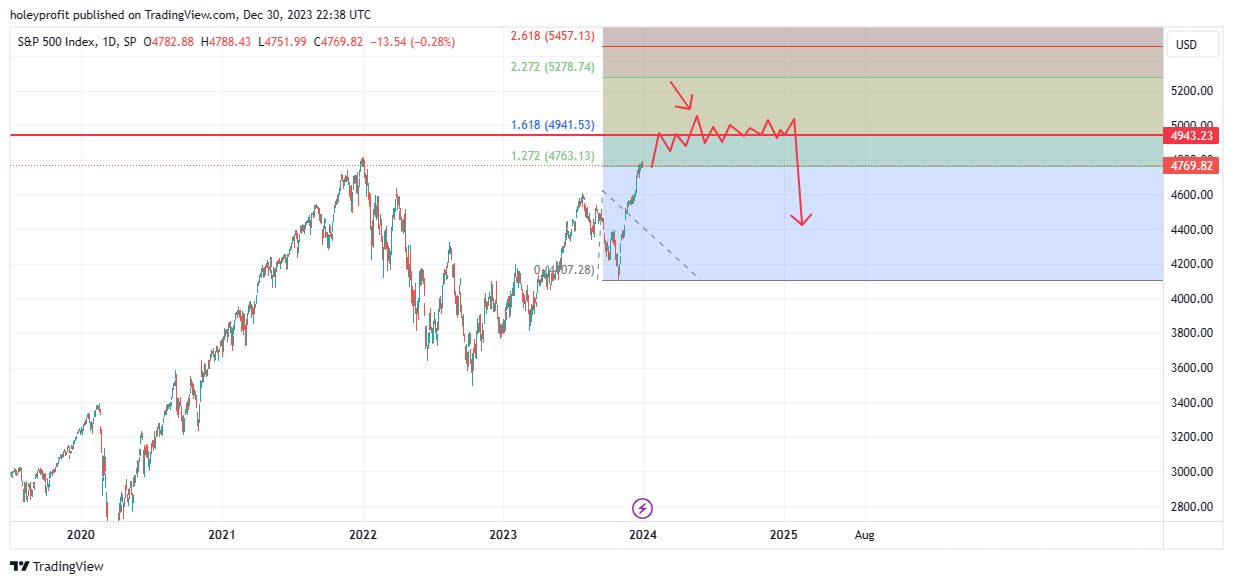
A “W” shape has to make a range. After this, there’s also a strong chance we range / make a double or triple top.
We’d probably see some clear first break but then the market holding up for a considerable amount of time after.
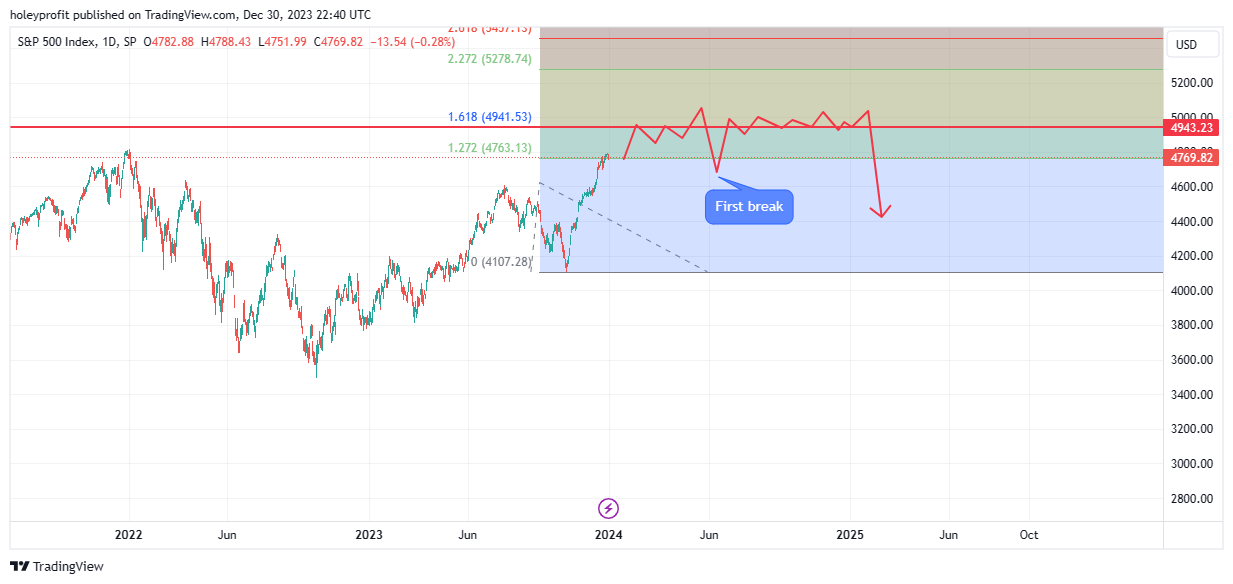
This fits in with classic reversal patterns like a head and shoulders.
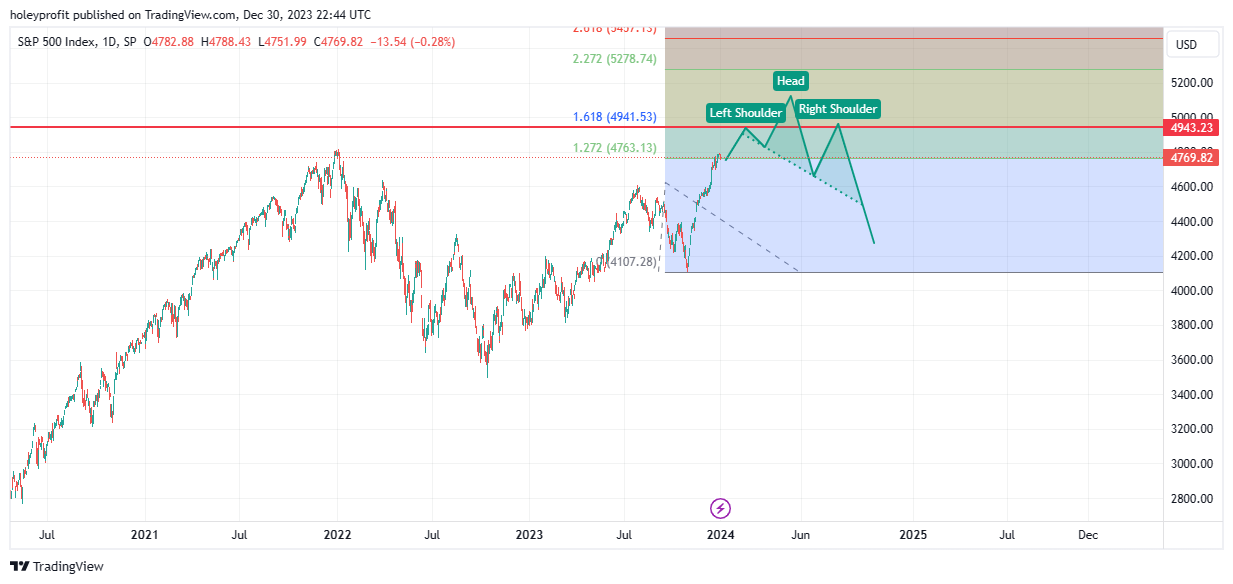
It is a reversal pattern but when a head and shoulders is forming price will trade inside of the same range for quite a long time.
The main difference between the bullish and bearish ranges is we’d be looking for the bulk of trading in the bearish range to be under 5,000 and we’d be expecting our low to be inside of the 2023 rally (Instead of a retest of the high). Any trading over 5,000 we’d expect to see rejected quickly.
A parabolic burst that turns into a range building up a head and shoulders/bearish harmonic would be likely preludes to a failed bullish breakout and reversal.
Approaching Bear Market
In an approaching bear market, to all theoretical intents and purposes, the rally is over. When viewed long after the fact, any future bull moves would be entirely nominal. However, in terms of trades - bears would be in for a significantly rough time before the turn actually setup.
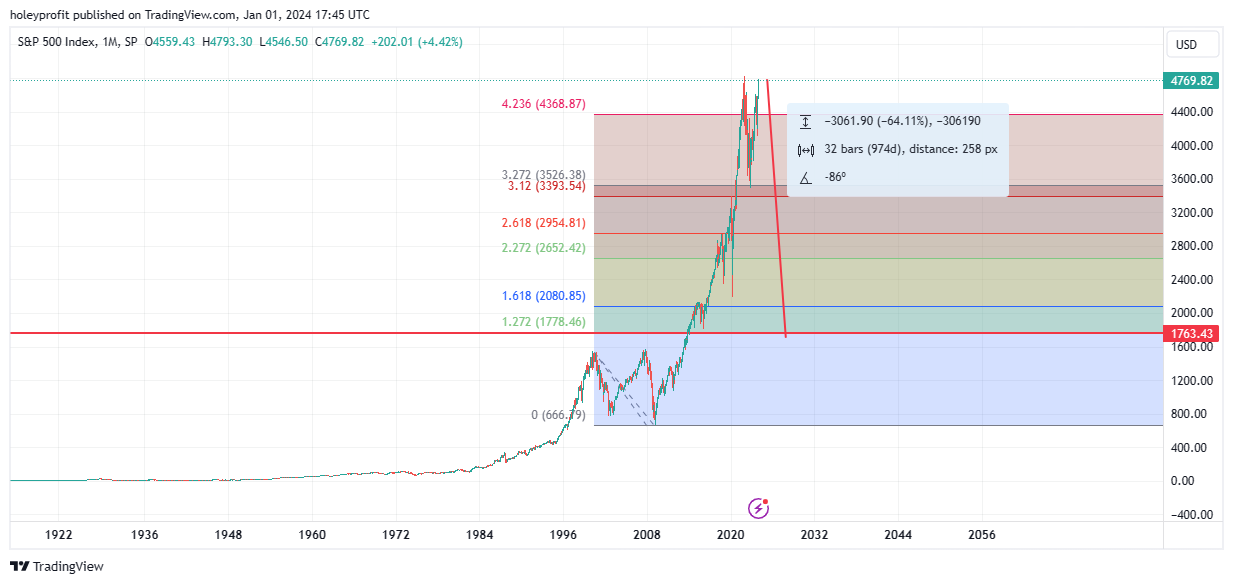
Big Bearish Butterfly
If we are approaching a bear market, we’re in a huge harmonic D leg. And if we’re in a huge harmonic D leg, we should expect to see the end of it being spectacular. A massive fast move. Well supported with some sort of news. A big clean break of the previous high. No big pullback - just a huge spike.
We’re usually going to see at least 1.61 of the last pullback hitting and bears need to be aware of the risk of moves up to (And spiking out) 2.61.
Most typically, we’re going to see a false start off 1.61 and then a big head fake which ends before (Often close to) 2.20.
Then a fake hold of the broken level and a real slam. A false breakout before a successful butterfly reversal.
If this move is setting up it should look like a really obvious bearish signal off the first hit of the 1.61. Should be really obvious and compelling. Usually looks like a total no brainer short. Then it makes a nasty spike out. Takes out everyone short and sets up the legit short.
If there’s the 1.61 reaction and big price action signal we’ll surely spot it. If this happens we should remain cautious of the short and wait to see if there’s some sort of big spike out. Upon the rebreaking of the 1.61 we can become more aggressive with our shorting.
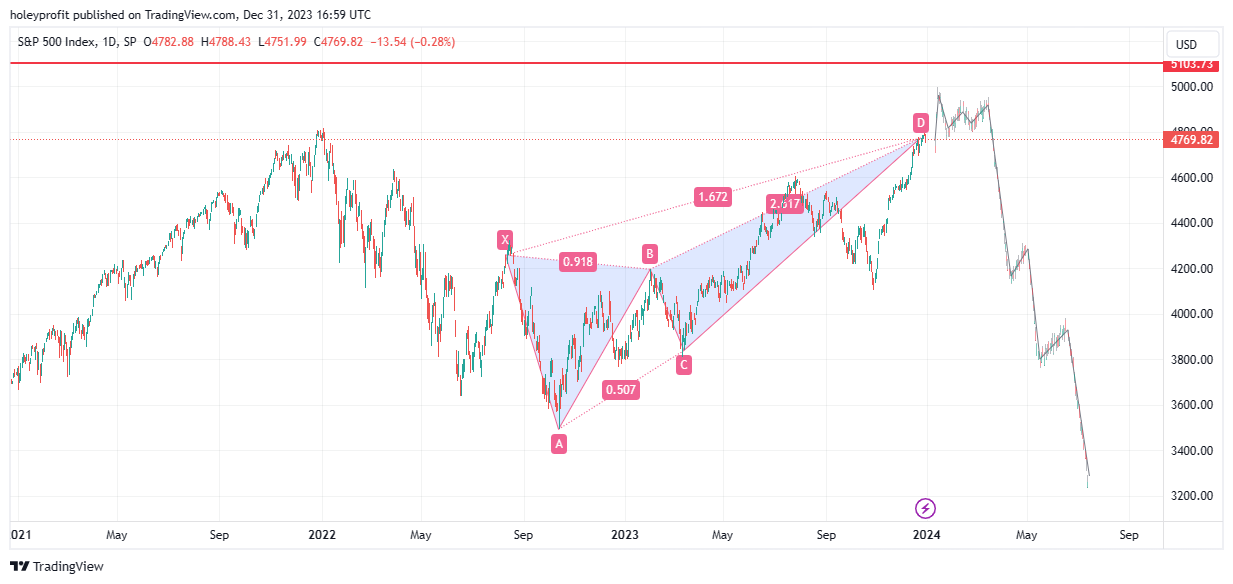
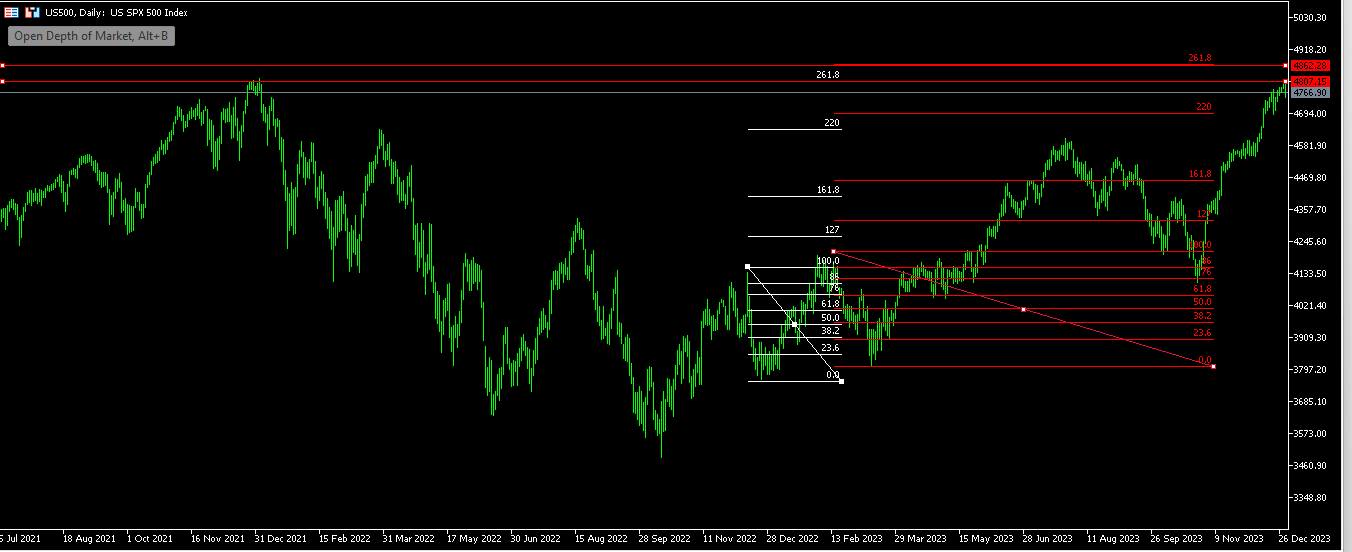
We can plan our first big downside targets for a butterfly using fibs. In this case we’d be wanting to draw a fib on the topping swing. To do this we have to assume our high and if the high is different we have to adjust our fibs and downside targets accordingly. First estimate is something like this;
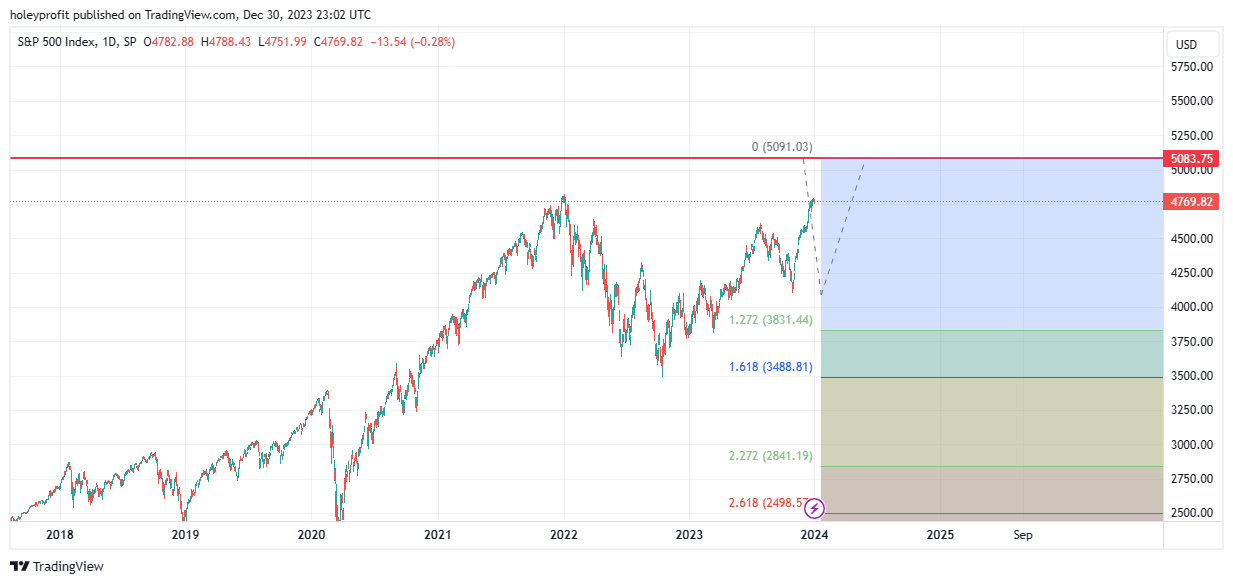
And our rules would be an inversion of the bullish plan covered above. We’d be looking for a first bounce around 1.27 and retests of the break. Then a stronger move upon breaking 1.61 heading to the next fibs.
Interestingly, if this was to run to the 3.20 fib of this fibs set this would come in at a spike out of the 2020 low.
And I do think any bear market thesis from this general price zone has always came with the implied move of spiking out the 2020 low. That makes sense in so many different ways. The most obvious one being if 2021 was a blow-off high - then all of 2020 - 2021 entries should go negative.
If you buy during a blow-off high and do not take profit, your position always goes negative. The previous low is always (At least) spiked out.
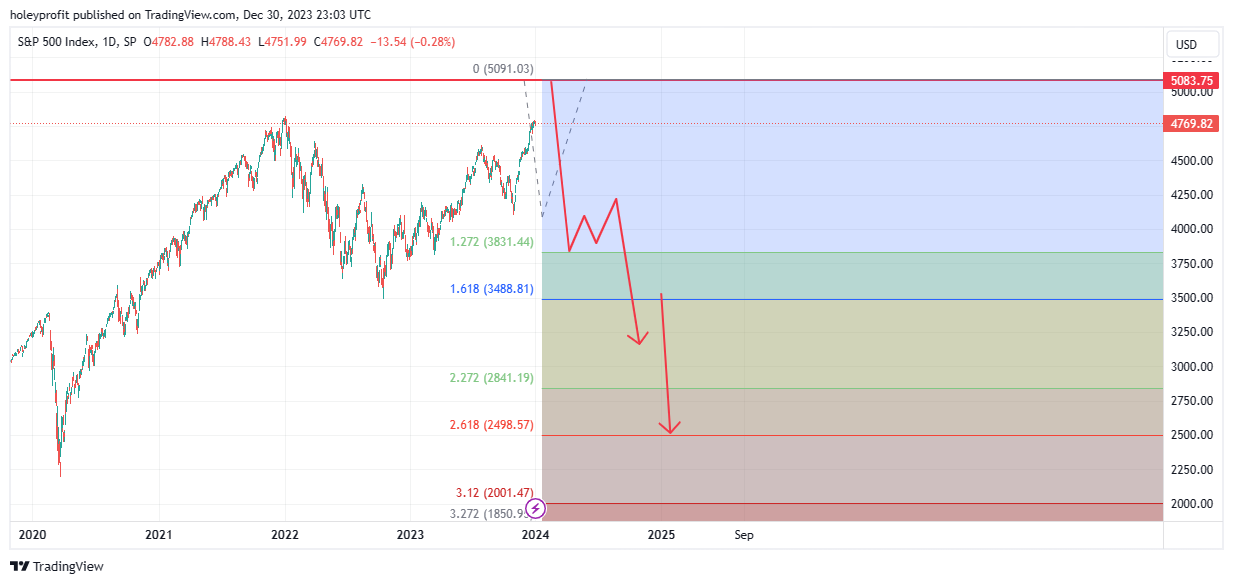
These would be our three big areas in this type of move.
Big Bearish Crab
This agrees in most ways / with most levels with the above harmonic. We could see similar action if we are making a big bearish crab pattern. Where we currently trade would be the completion of a bearish bat pattern. The bat would have us either already turning or due to turn very soon.
But the failure of the 2.61 here would evolve the pattern into a crab. A crab usually goes to around the 3.20 - 3.60 fibs and the move from 2.61 to 3.xx is always blisteringly strong. If we’re set to see a bat fail and a crab form and succeed - two mightily vicious swings are coming. Up and then down.
The crab forming would take us over 5,000 and we’d be doing that in sensation style. Probably one big candle.
It’s a paradoxical fact here that it’s fair to say the stronger up the bull move the more likely it reverses. In our bullish scenarios we’d be looking to see price slowly grinding up. Persistently day after day with some slight wobbles. In our bearish one, we’d be looking to see a jump scare. Something to kick out bears and embolden bulls.
If we’re going to make a the crab and reversal move, I’d not be surprised to see this happening with a single up day of not less than 3% and potentially as much as 5%. The move from a failed bat to a crab top is a hyper aggressive one. I can’t overstate that. It’s viable it could all happen in one major candle.
We do not need any additional targeting notes for a crab. All we need to plan our downside moves is a fib low to high of the topping swing and the crab implies the same levels as covered in the butterfly. The main tell we should expect for a crab is the exceptional spike to 3.20.
Early Bear Market
We are defining an early bear market as the high already being in or us being so close to it as for there not to be much functional difference to trading.
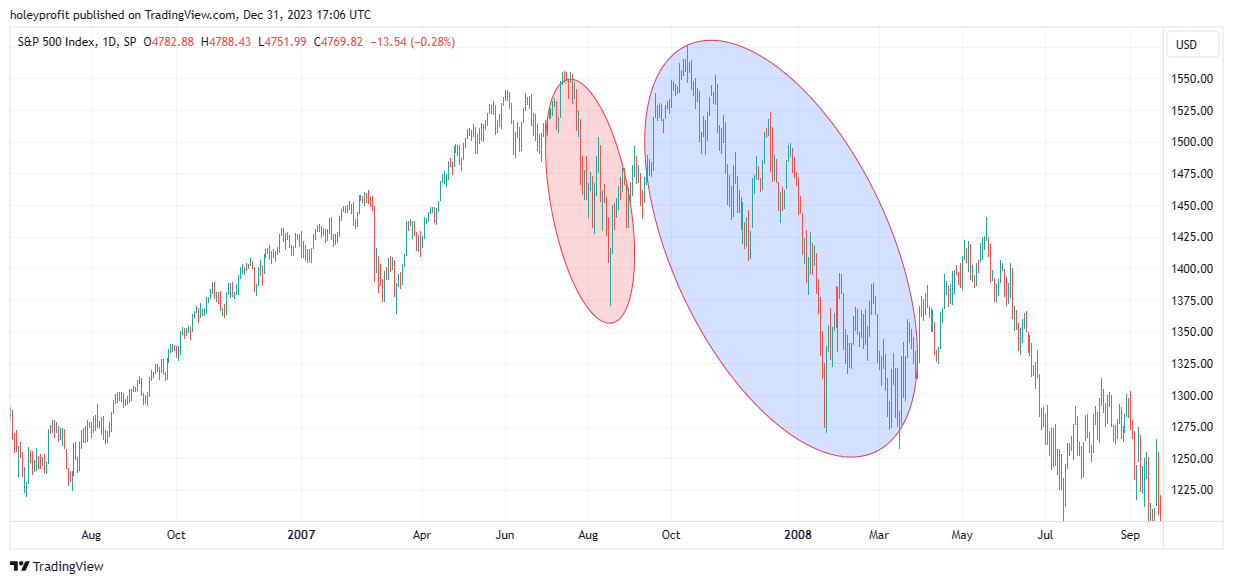
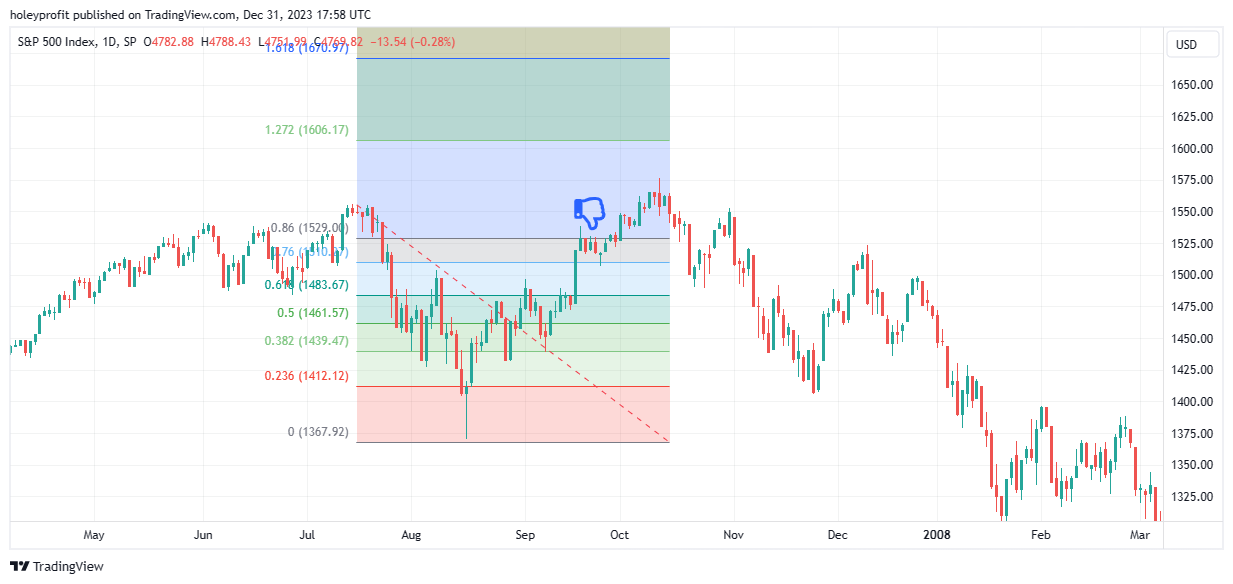
As an example, here’s the 2007 top.
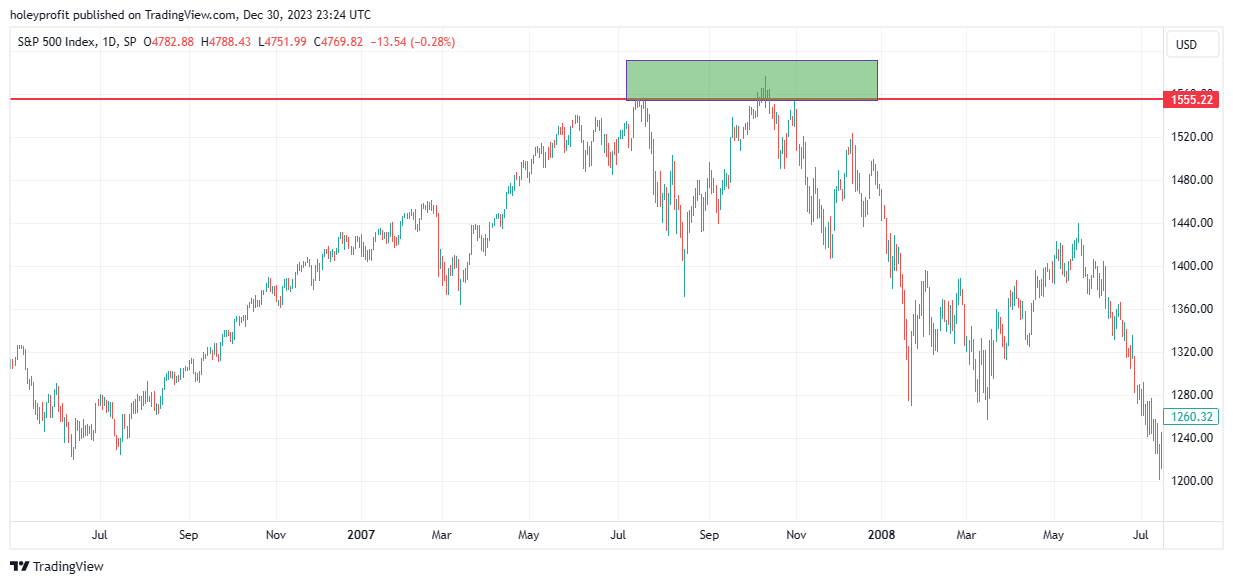
In this type of setup we’d not have seen the exact high yet but most of the trouble for bears would be over.
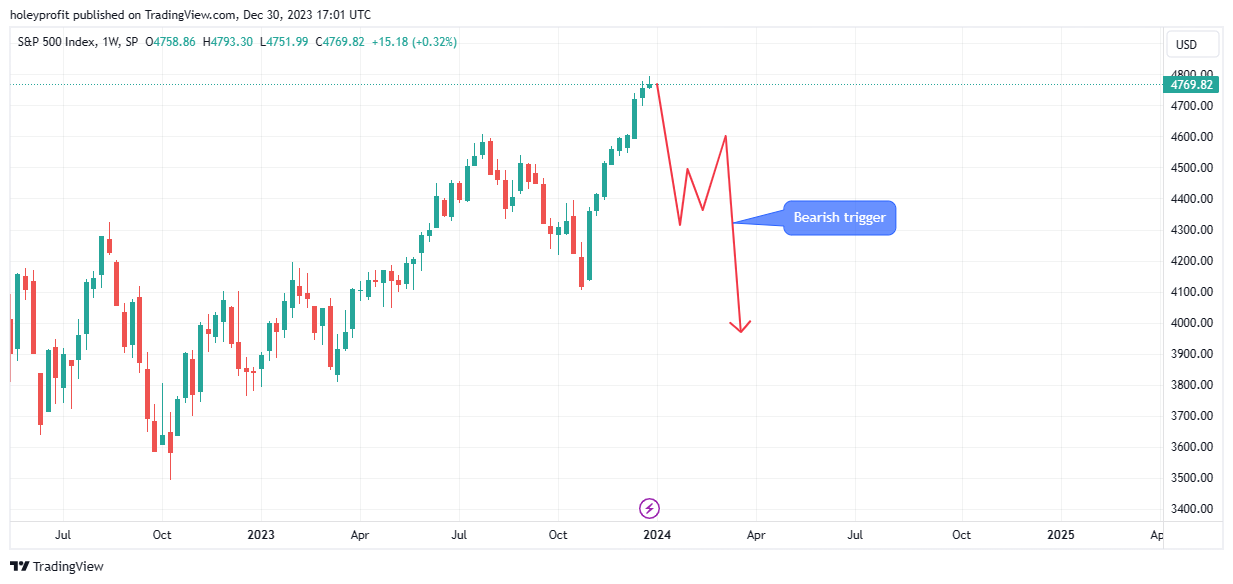
It’s hard to envision this being a top here with the way current action is. It feels like some sort of last momentum spike would be the least to expect now. However, that is also exactly the sort of thing people should be saying at a top. By the time a top is being made, everyone should believe it has to go at least a little further.
The top being here would be supported by the bat pattern. Something we first highlighted to look out for forming back in early 2022.
A 2007-esk high would be expected to look something like this.
A nominal spike out of the last high. Very slight breaking of the 2,61 (Bat completion) and then a rapid turnaround.
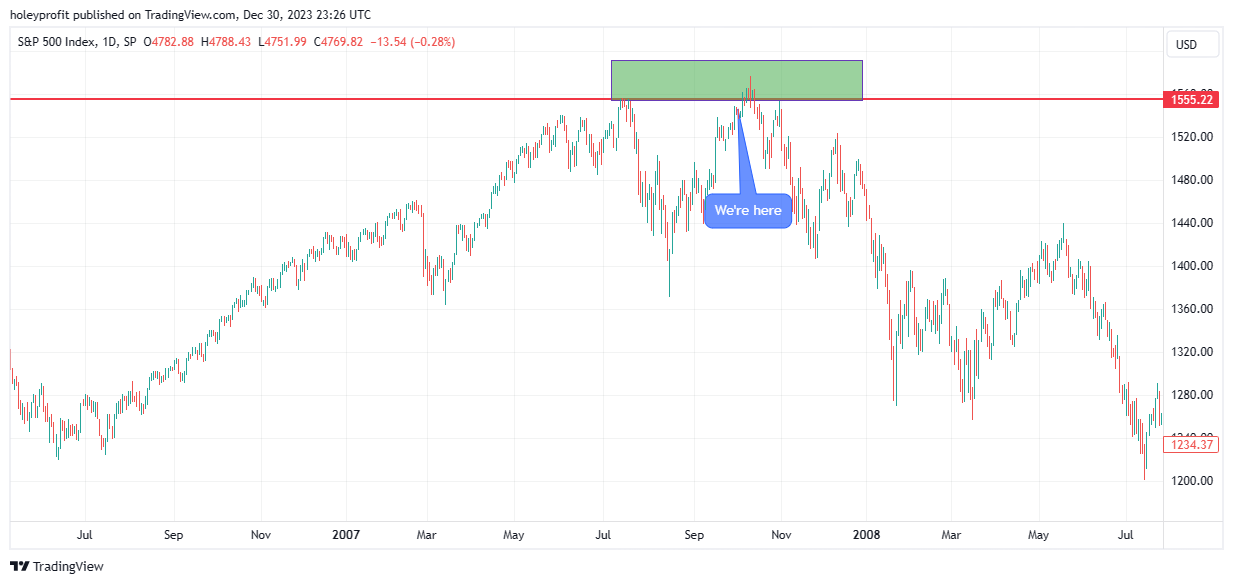
This would be a substantial match up to the 2007 high.
I am admittedly out the loop with public sentiment and what people are and are not saying these days (I’ve not spent a lot of time online in the last weeks) but I’d venture to say it’s very likely there’s exceptionally few people posting the 2008 fractal now. Which, to me, is incredibly ironic.
Because we have now, for the very first time, actually completed a like for like move of the 2007 high. All during the 2022 drop people posted layovers of the 2008 crash with current action. But the devil’s in the detail. Most versions of the 2008 fractal entirely ignored the fact there was a nominal spike out of the high in 2007.
People posted their fractals of the blue move while they entirely ignored the fact the red move existed.
The true like for like of the 2007 high would have always implied a new high.
This is the great sin of people who use models of previous crashes to make their forecasts - They tend to look only at the crashes. Only at the tops. They do not look at the action before the top to see if there were instances of the market doing very similar things before heading higher.
If you took this objective point of view back in 2022, it was obvious we were in a market move similar to 2007 than 2008.
In 2022, if you were able to look past the obvious news everyone was talking about and were willing to take the jibes of being a “Pivot bro” on the chin, it was obvious there was risk of a spike to at least a 76% retracement and to complete a 2007 like move we’d spike out the high.
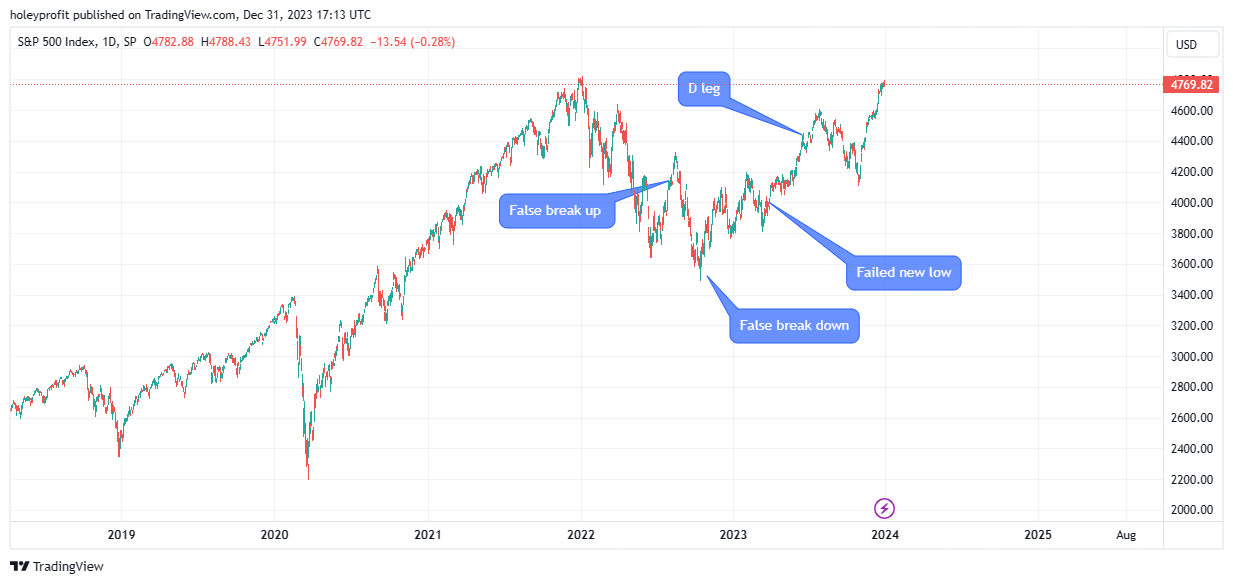
The only deviation from the 2007 move came over the last few months. Because 2007 didn’t sell off and then rally to recover.
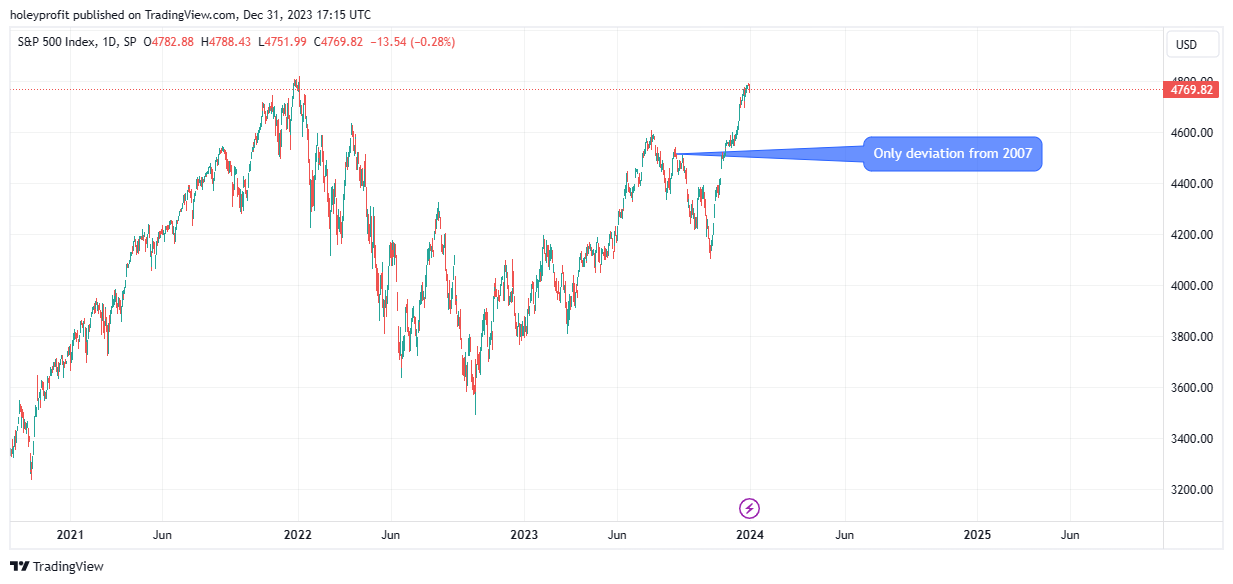
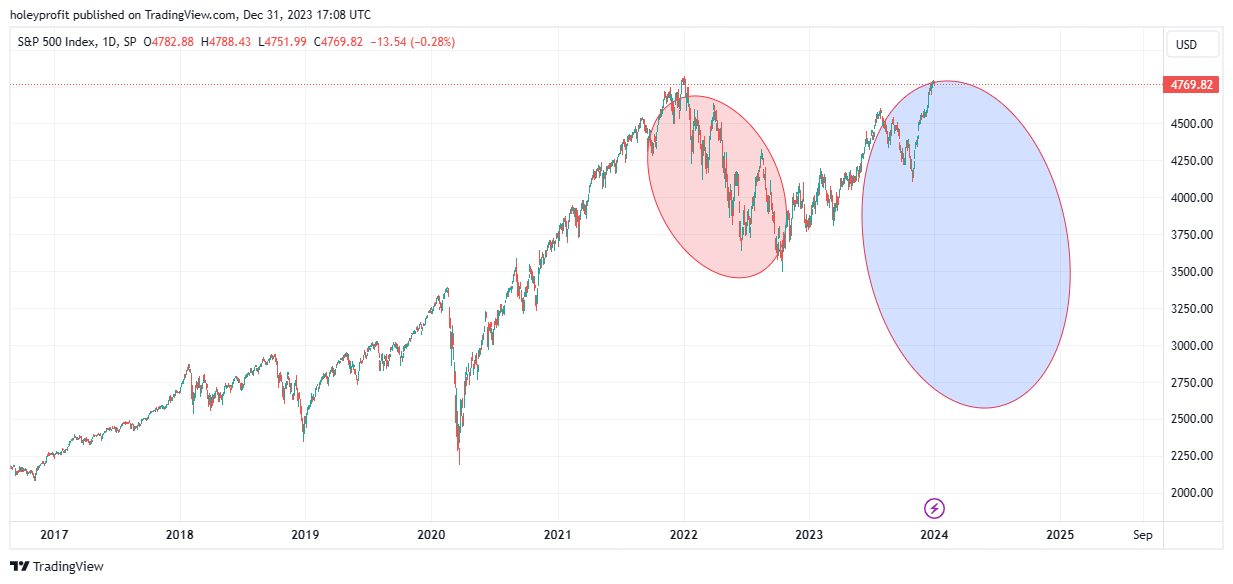
This deviation really threw me off and was a mar on the overall performance of 2022/2023. Breaking down times in which the models I used worked and models I used failed we were mostly correct during the blue sections and wrong during the red sections.
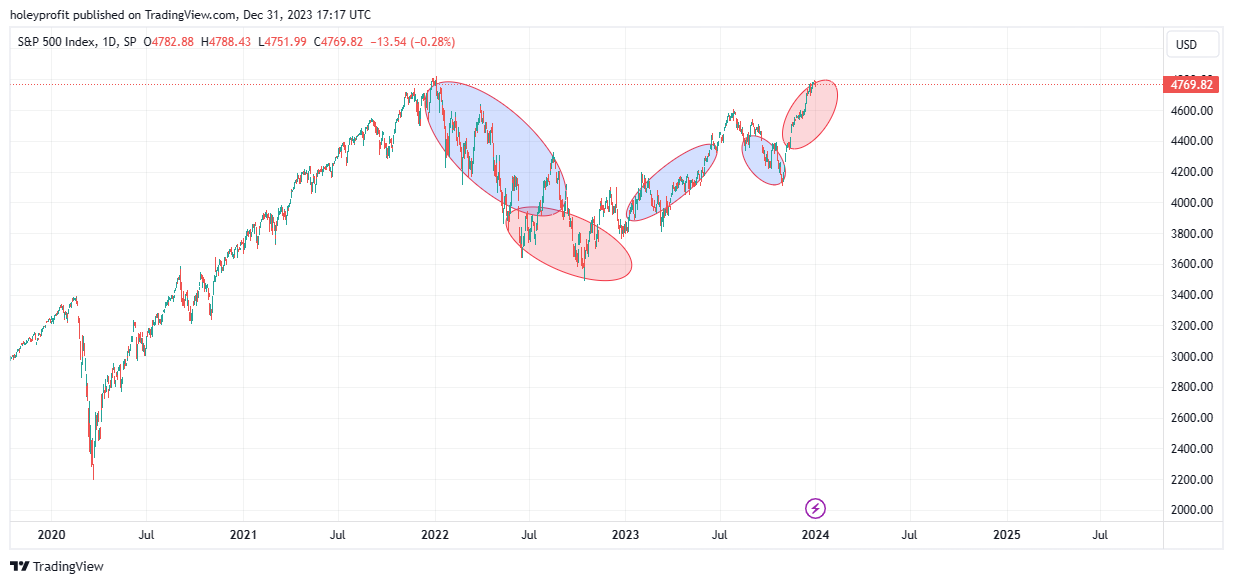
Which up to the last leg was what I’d consider to be about as good as can be expected. Hitting most of the big swings of the drop and nailing the reversal while still close to the low. But outside of this one swing deviation the market has acted substantially similar to how it did in 2007.
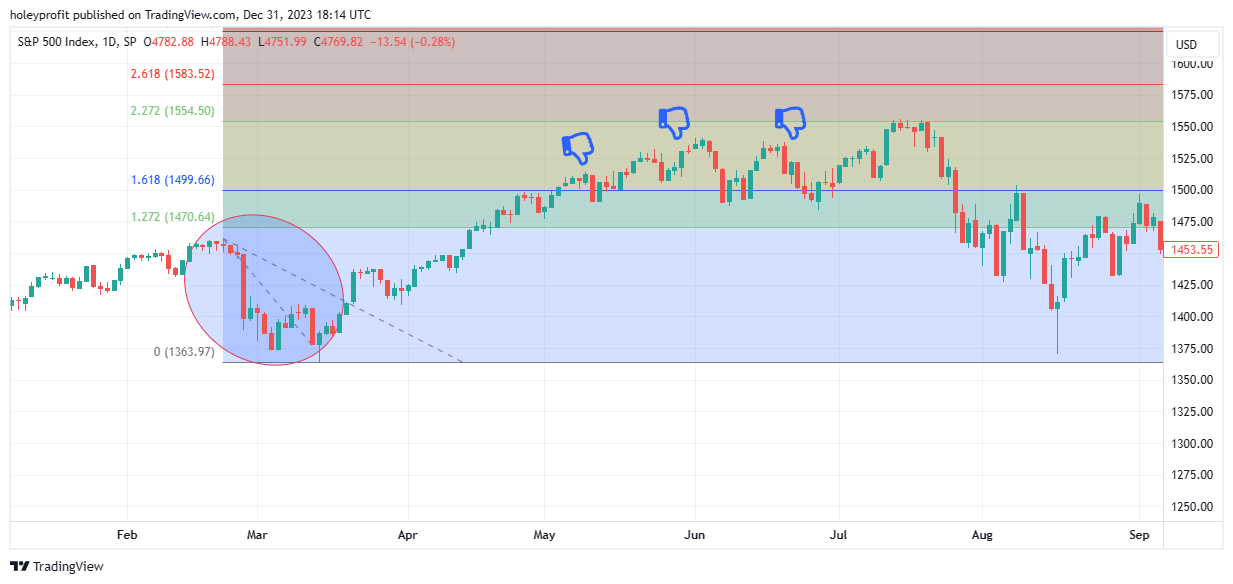
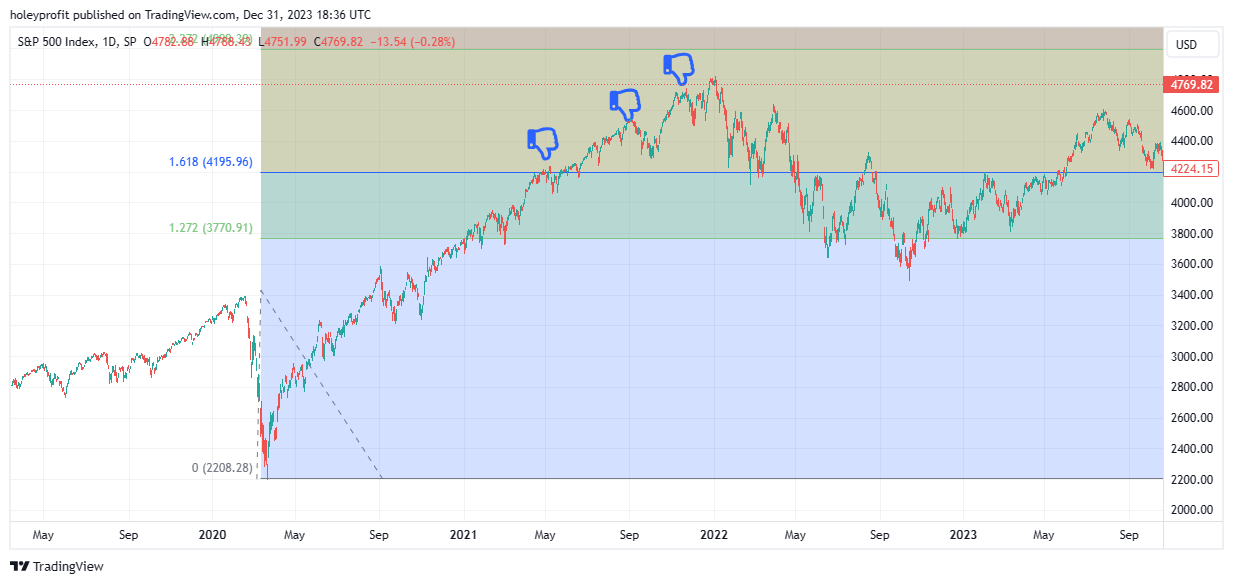
If we were to make a top here and go on to complete a 2008 like move, it’d be relatively simple from here on because 2007-2008 kicked off with a series of simple 76 retracements. If you knew to fade rallies to the 76 fibs to build up your position heading into the 2008 crash - It was simple stuff.
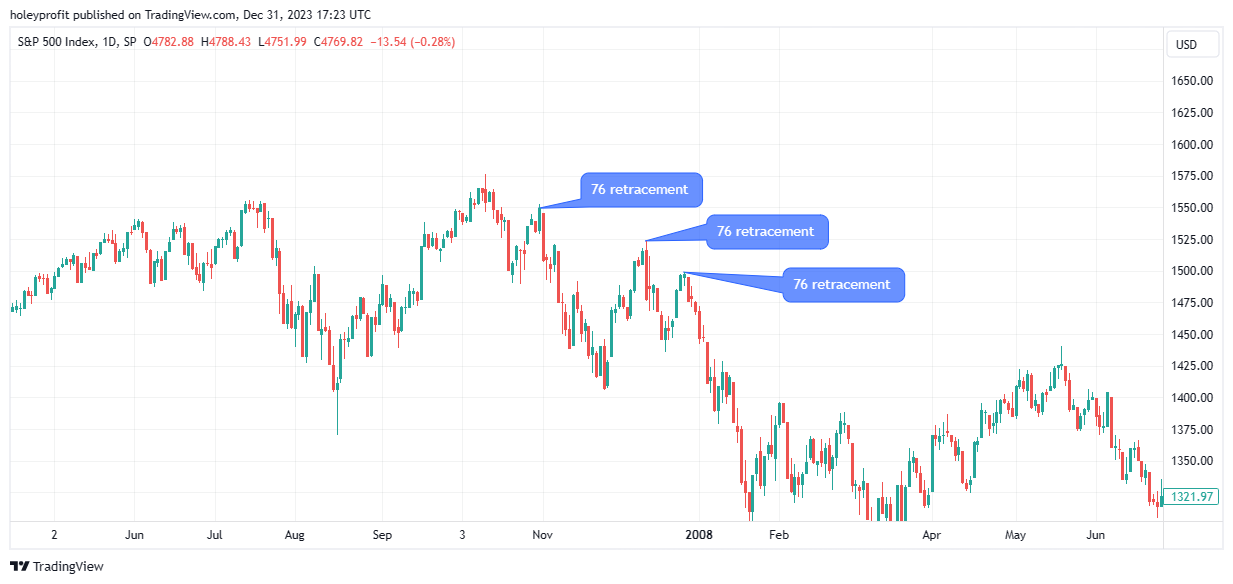
If something like this happens it’ll be easy to nail a lot of the big moves/good early entries by having an effective set of rules to fade rallies. Using our known norms of bull traps being parabolic rallies to around the 76 fib and then turning into crashing reversals, building a position before the 2008 crash was trivial.
There would have been one thing in real time that made it hard to build a big position before this crash if you knew the one strategy of expecting sharp rallies and fading the 76s. It’d have been technically simple to do. Any issues would arise from not wanting to do it. You’d have good reason to not want to do it after being nailed here.
It probably won’t surprise you to learn I’ve spent quite a lot of time looking at the top before the 2008 crash. With honest review of things I’d have seen in real time my conclusion is I’d have found it exceptionally hard to be bearish at the high. Would have nailed the first drop and got nailed trying a retracement short.
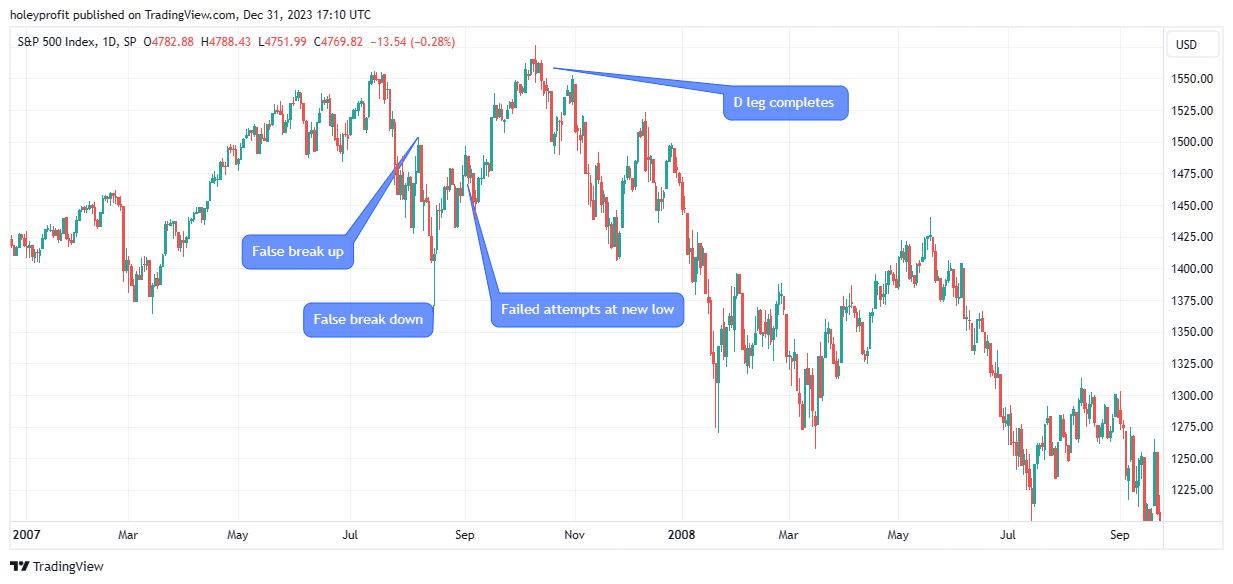
The current high, drop and rally have a lot of similarities to 2007 so let’s look in more detail at the different parts of the move before the crash happened. First I’ll break it down into the important sections which have objective things we’d spot in real time and then I’ll compare that to the action of the last few years.
I’ll do everything from the perspective of decisions I’d expect to make in real time in 2006/2007/2008 and with the real thoughts and decisions I had through 2021/2022/2023.
The odds of me shorting (Or at the very least not being heavily long) at the first high would have been exceptionally high. Almost no chance I’d have been caught out as a long here because even if I didn’t have a bearish thought in my mind, I’d have trailed stops when we were close to 2.20.
Having seen that sharp sell off I’d have for sure drawn that fib and my thoughts would have been a possible big short from 1.61 or 2.20 and if that fails, probably no big short. If I was looking for bear signals I’d have got a lot of false starts in these bear traps.
But I’d actually be able to about breakeven in this if I got some good entries, trailed stops and only lost in the small retracement zones. This would have only been really painful to bet short on if you didn’t lock in profits from good entries or only entered when there has been obvious bearish action (Shorting lows).
Selling into rallies, you’d have a good expectation of breaking even here so long as you were managing your trades well and only engaging in selected areas.
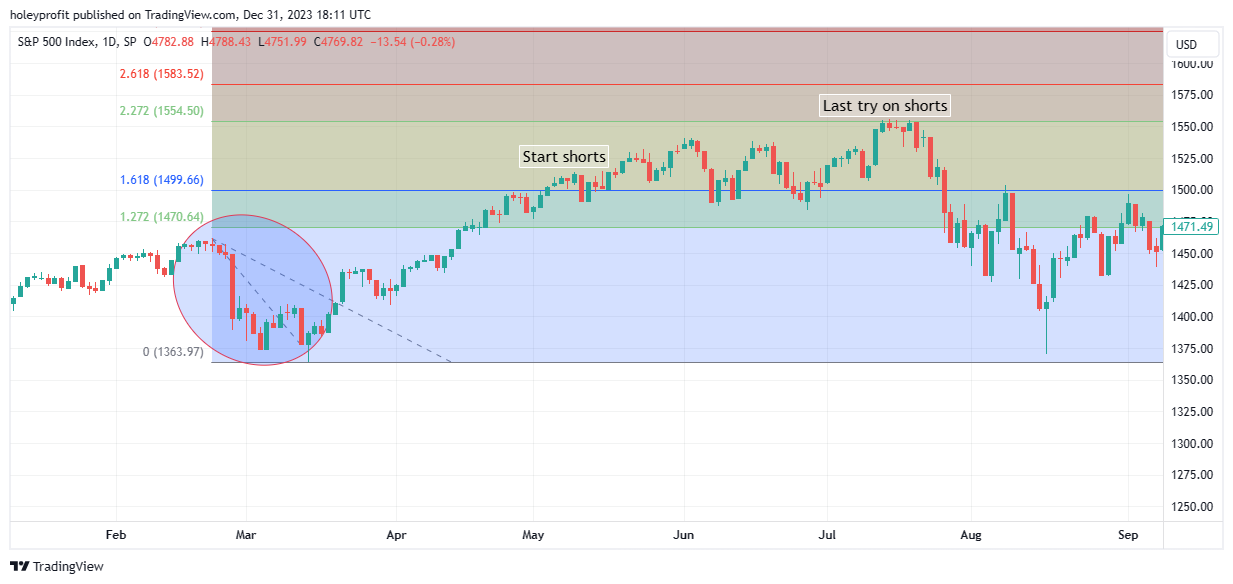
When I was getting spiked out I’d probably have spotted the harmonic and been willing to take one last try on the confluence of the 2.20 resistance and the harmonic.
I’d have drawn a fib on the topping swing and used the levels for that as my support and breakout levels. Typical rules I’d use would have picked out these levels.
And as long as I was on the ball I should have been able to pick up the warning signs the short was over.
I’d been unlikely to flip bull bias at the low but there’d be a reasonable chance by the time the right shoulder had formed I’d have got the memo bulls were stronger.
Then I would have got nailed here.
I’d not be all that bothered about it because I’d have done well in the drop and reversal, it’d just be a case of “Good while it lasted” and end of bearishness. Draw a fib on the pullback and I’ll make decisions at the next levels. I’d expect some near term bear move, but I’d be overall bullish given the failure of bear patterns.
Which would most likely mean even although this was a simple 76 bull trap I’d have probably been looking at the big wicks, strong bull candles and I’d have been thinking this was clearly a bullish environment. I’d have been unlikely to feel bearish at the 76 (But hopefully would have had the common sense to trail long stops).
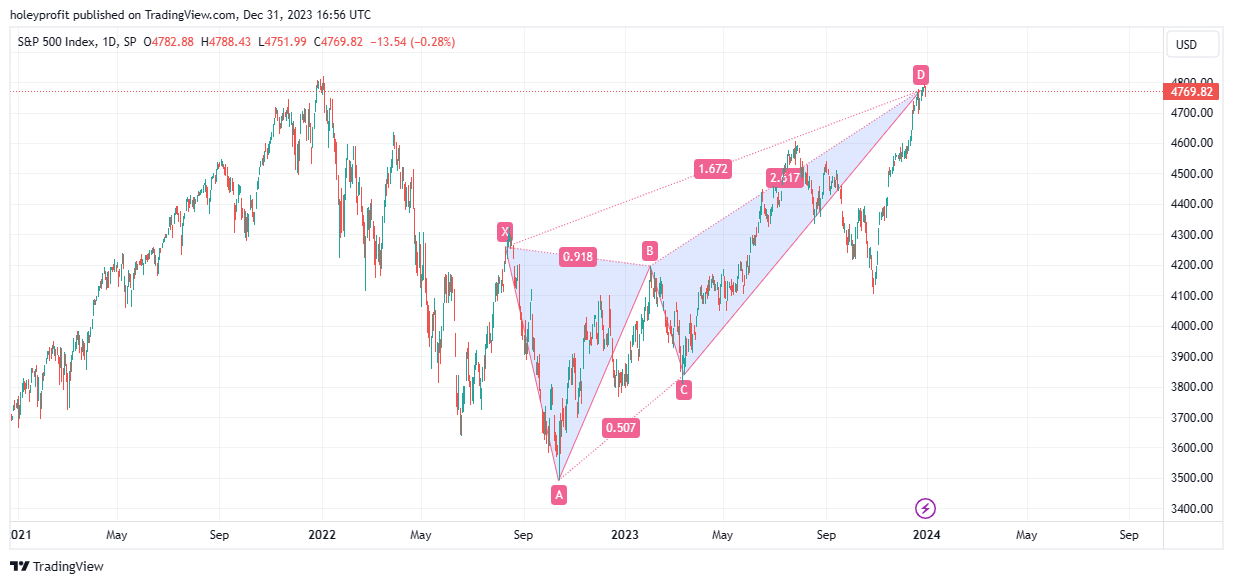
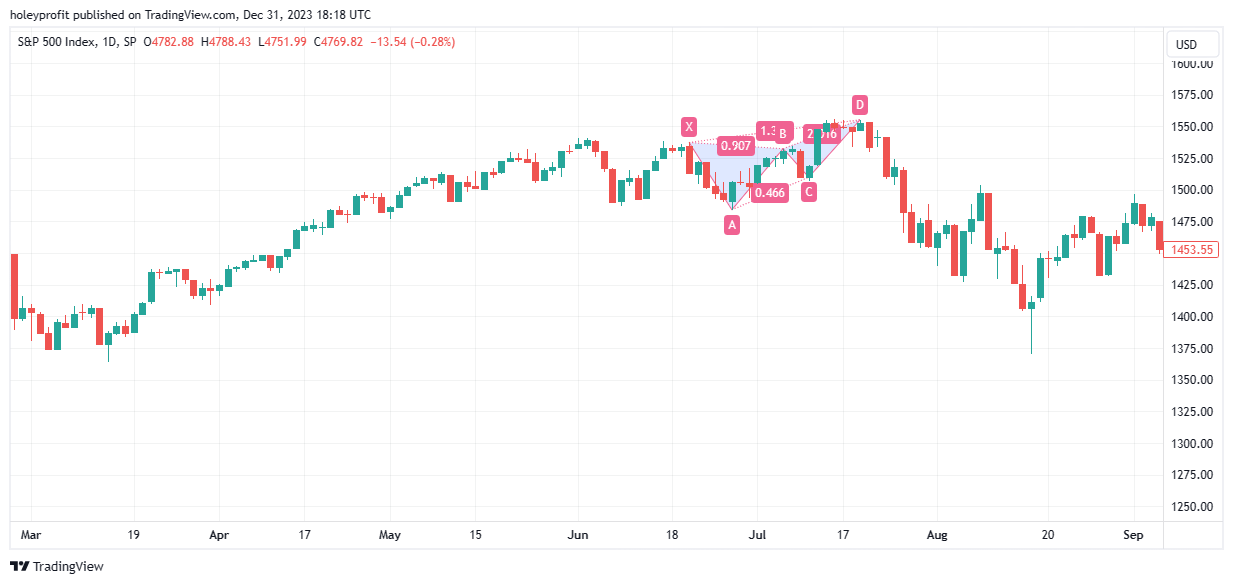
With the benefit of hindsight, I can see this was a bat pattern.
There was a clear sell signal at the exact high. However, based on rules of 76 breaks, new highs, downtrend failure and don’t slam your face into a wall too many times; I have to conclude I’d just not have felt bearish at the high. I’d have been a dip buyer in the reversal. That’s my honest review.
Now, if you’ve followed me from the inception of my work on bear markets in 2021, you’ll already see how spookily similar all that is. Let’s go through it.
I first started talking about bear market risk as we were heading into the 1.61 of the March 2020 drop. Before the level was met I was saying 1.61 - 2.20 is a reversal zone and if price doesn’t reverse in that zone then it’s probable the uptrend is going to continue (Perhaps a bit of a flash crash correction first).
Obviously there are a few major false starts.
But using the methods of shorting into rallies rather than drops and trailing stops trade plans produced during this time were about breakeven. They were consistently wrong, but the net PL results of them would have been close to even so long as entries and exits were good.
Was really bearish at the high because we were so close to the 2.20 resistance level and also there was the local harmonics. Admittedly I’d thought there was substantial risk a further spike was due to complete the harmonic head fake. But I was short into the turn.
The drop would be significantly similar to the 2007 drop up to and including a big bounce from the 3.20. However, the first major deviation came when this failed to be a low and we made follow through spikes to the 4.23.
Would remain predominately bearish through most of 2022 but when we had failure of continuation on the 76 retracement I started to more frequently talk about risk of the bear move failing and correcting at least to a 76 retracement and possibly making a nominal spike out of the high.
It’s not a very pretty one, but after the fact we can see this was reversing somewhat into a right shoulder of inverted head and shoulders.
I was essentially a perma bull to the 76 and once the 76 had broken I was strongly bullish bias into the first dip. I’d been saying at the time I expected a move significantly similar in style to the rally we eventually got, but I’d been expecting it to be a shallower retracement - as 2007 was.
And then we have our second major deviation.
Now … here’s the question. Is the second major deviation because something significantly different is happening or it is like the first deviation? Some awkward swings that make it hard to trade but in the overall scheme of things produce a move that is essentially the same.
The 2007 low and the 2022 low are essentially the same. We did everything by the 2007 book until the 4.23 spike out. That spike out made me significantly more bearish it was the first time we really broke away from the 2007 drop that would spike out pattern. But it was big at the time and nominal in context.
When things do not work as your trade plans predict you should usually change your mind. Stubbornness is terrible thing for a trader. The false start and rally had felt like a huge deviation from the expected bat plan. One so big that it warrants the ditching of the bat plan.
But what if perspective comes later? If the market had made the shallow dip I expected and then we’d seen a strong run like the recent one we’ve had to these price levels, I’d have been apocalyptically bearish. What has happened makes me feel less so, but it actually would be a tiny deviation in context.
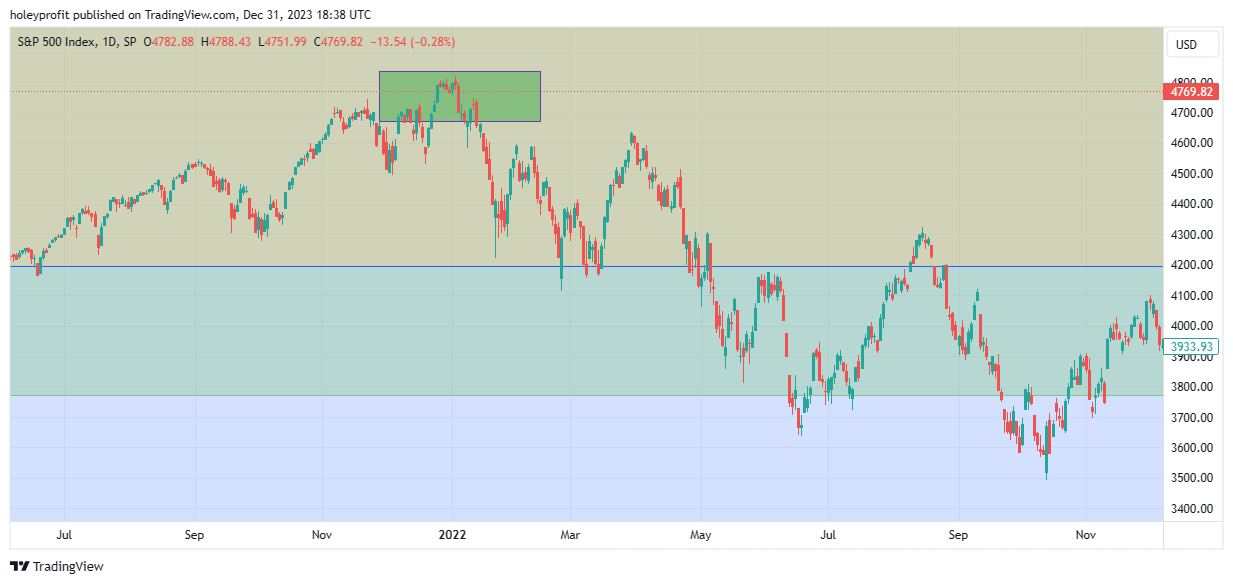
The green zone is different from what the original bat forecast looked for.
This is what I mean by “What if perspective comes later”. Look how entirely nominal the green box would be inside of the context of the development of the big move.
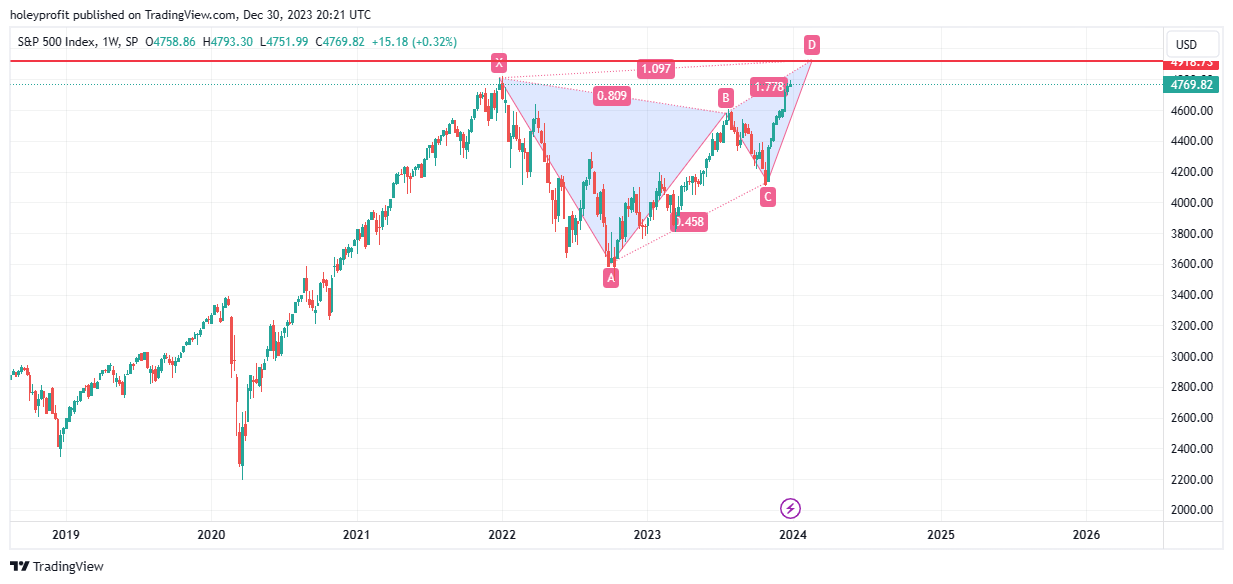
Mid 2023 while we were around 4,000 I felt like I knew it deep in my soul it’d be the bat top. That bears had been whipped up into a frenzy. Some of them were crazy derogatory to anyone buying (Even those covering shorts to do so) and it just made so much damn sense we’d nominally run the high.
The fact that the ABC of the bat was now in and we were clearly failing to break lower made me think it was extremely likely the bat would hit. Now it has, I am surprised to find myself really sceptical of it. Maybe just because I shorted too early. I might have eaten too many sweeties and spoiled my dinner, Mum always warned me about that.
There are two ways we can draw the bat here. Both give essentially the same level but there is a slight difference and when we account for spike outs this makes the indecision zone a bit bigger. But both give us a potential reversal area somewhere from 4800 - 4950.
A good reference point for a bat spike out in the modern day is the BTC high.
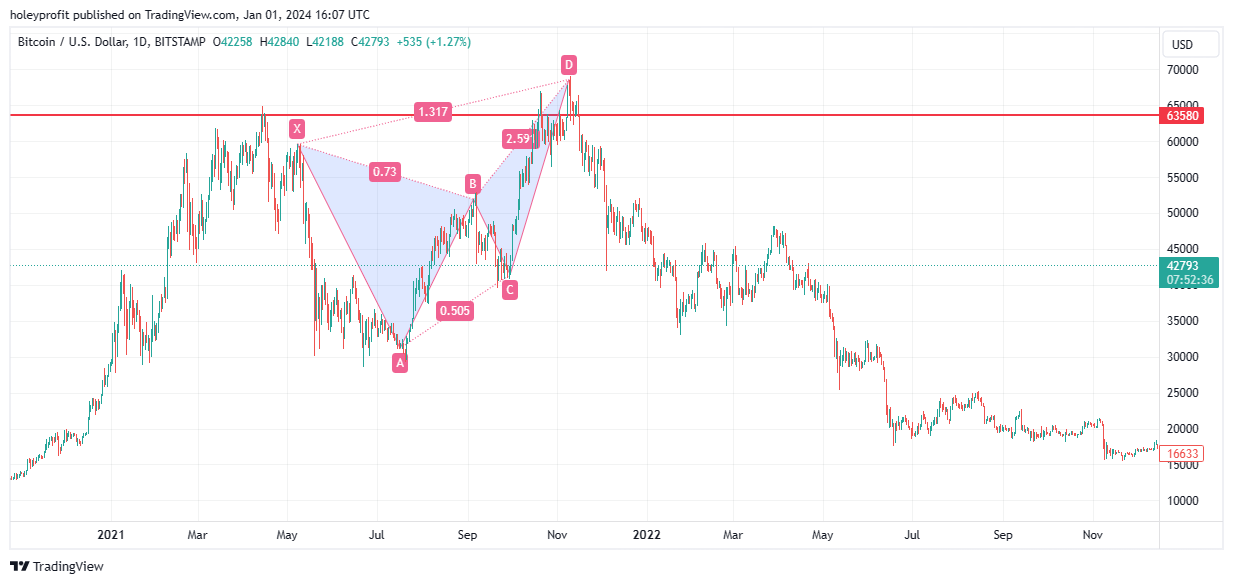
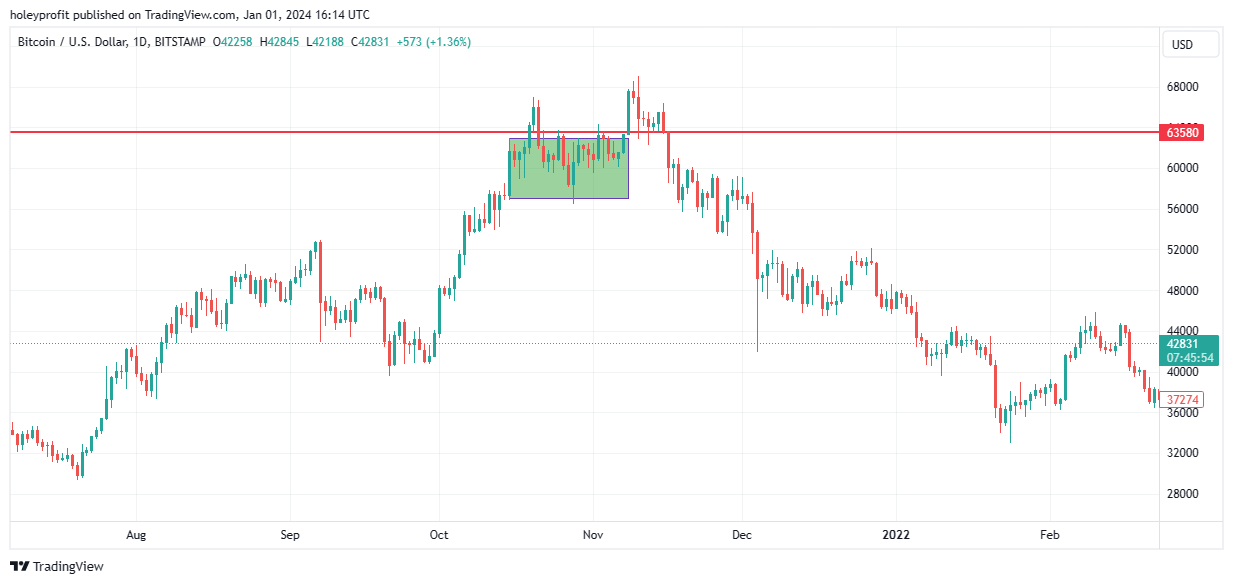
Very similar in the general pattern. Like for like we’d be somewhere in this section.
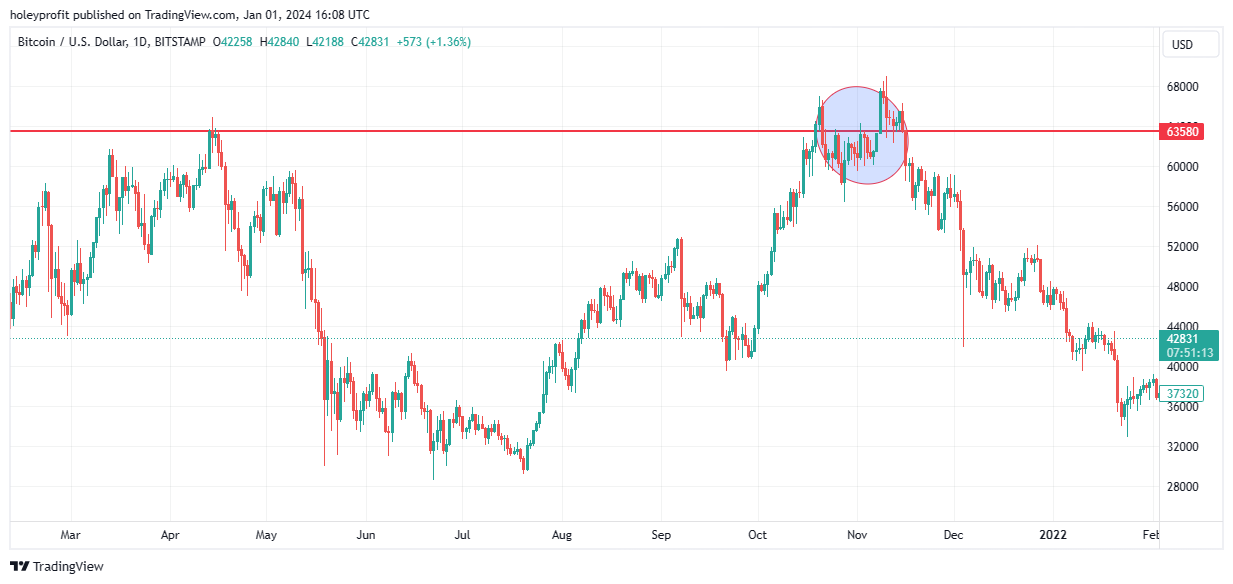
Which makes the two potential reversal levels a little more bothersome since we have to accept we might see the market fake and spike. Having reactions off both levels and liable to form false signals before the real move would set up. Giving us something that looks a bit like this.
In hindsight, it’s easy to see this fit into a harmonic like top.
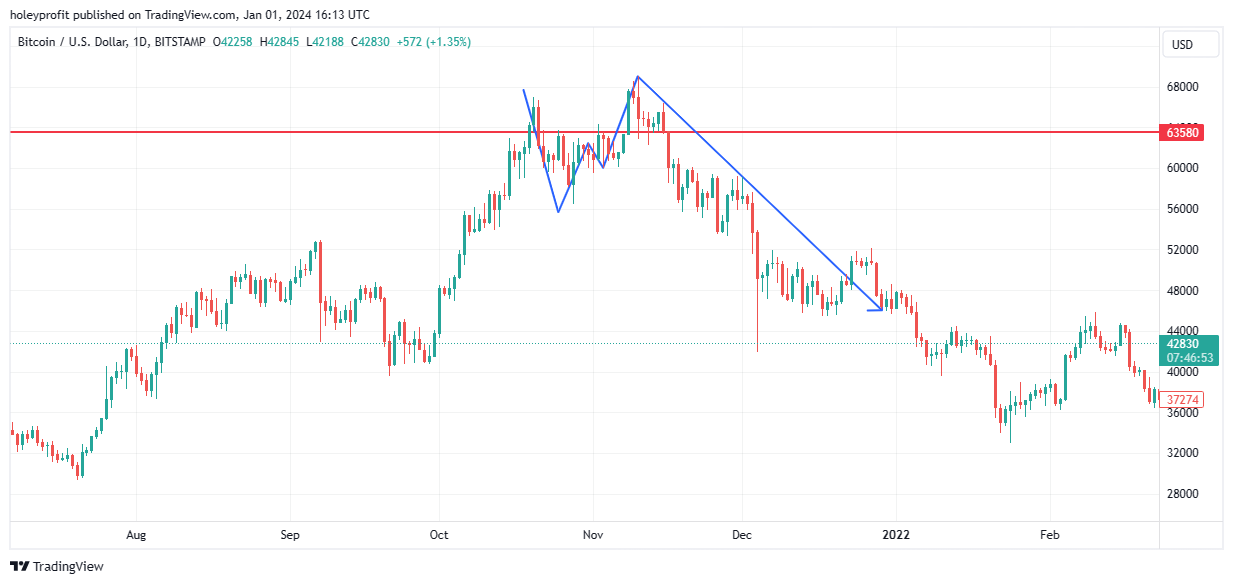
But in real time this was tricky. It was hard to view the spike above this range as anything other than a breakout.
This was dauting in real time as a bear. I’d done a lot of work on BTC at this point and everything I’d done suggested to me BTC should not go over 70,000. But I’d also not expected a new high and at that point in time it felt like literally everyone was looking at 100,000 BTC. Then some good news came.
Was hard to feel bearish. As it is hard to feel bearish on SPX now. But the reversal signals were pretty obvious here if you could just block out the noise. And I suspect it’d be equally obvious here on SPX if we were to make a similar pattern. Just need to know to look for it.
End of Mega Bull Market (Macro Market Reversal)
I believe it’s foolish for anyone with anything other than a flawless track record over a very long time to speak in absolutes about the market. I’ve not got a flawless record and I do not want to be a fool (Well, not more than necessary at least) and as such I avoid speaking in absolutes.
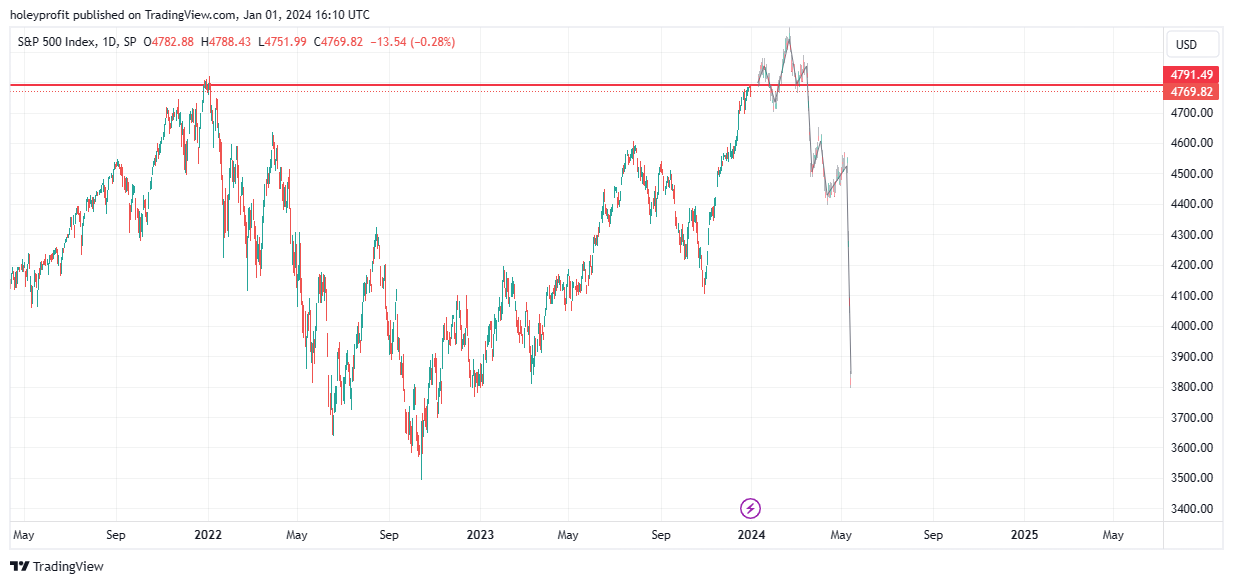
But I do feel we can say this absolutely is a bubble.
The angle of the trend keeps increasing and I can not find any instances of this being indefinitely sustainable.
As covered before, this levelling out after such a strong move just doesn’t happen.
Pandora’s box is open. There’s no shoving the stuff back in.
And we can be damn sure the angle isn’t going the other way.
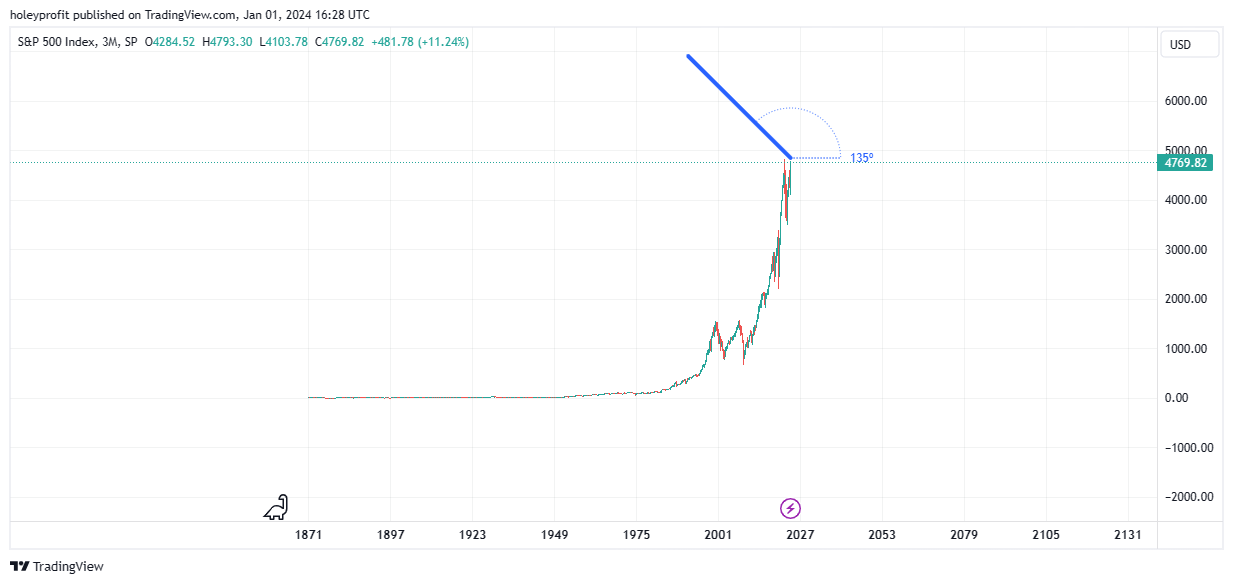
I’m happy to deviate from my absolutes rule and say that isn’t going to happen. I’ll sell naked options on the market going backwards all day long.
I know I am repeating myself a bit here but it’s worth repeating - It’s now seems very well supported to say that we have a good idea of what sort of angle SPX is likely to trade at - and that angle is an extreme one. For the norm of sharping angles to continue we have to see vertical or capitulation moves.
I feel like we’d have to be either in the final 1/8th of the rally or we’d only be about 60% of the way through it. These things imply very different prices but I think both imply strong one sided moves (With caveats of the range traps before them - but if we’re talking 3 years or so out, likely strong trend).
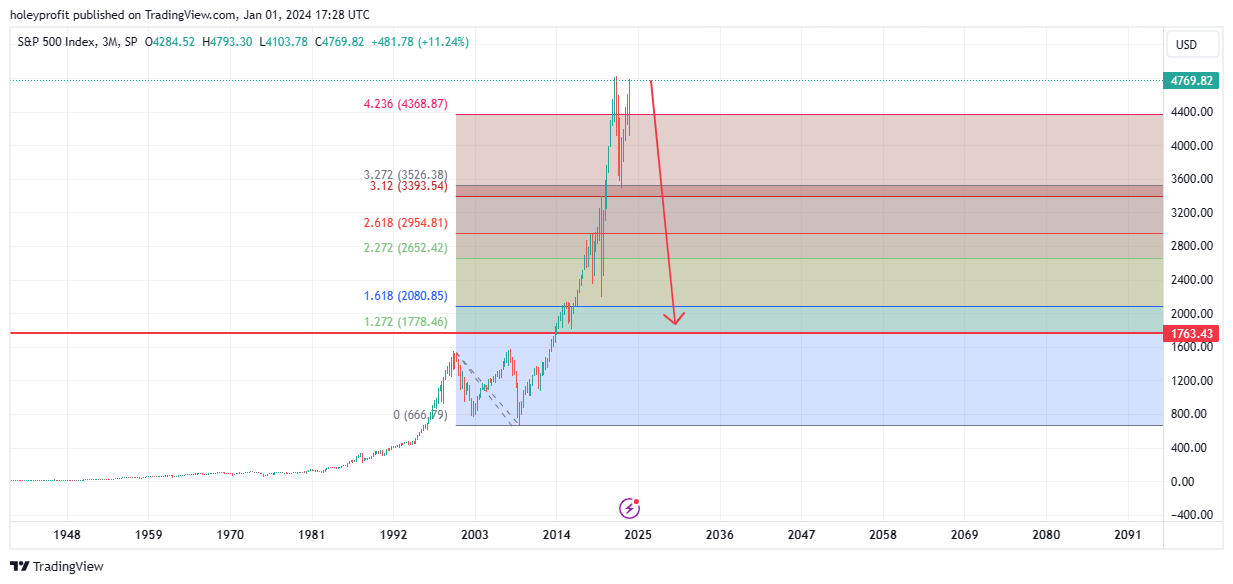
Action into the close of the year felt like a strong deterrent to being bearish, but again we have the question of “What if perspective comes later?”. I really do not find it hard to support the macro reversal thesis here. I’ve just become more and more cautious about how to go about betting on it and the implied outcomes of being wrong.
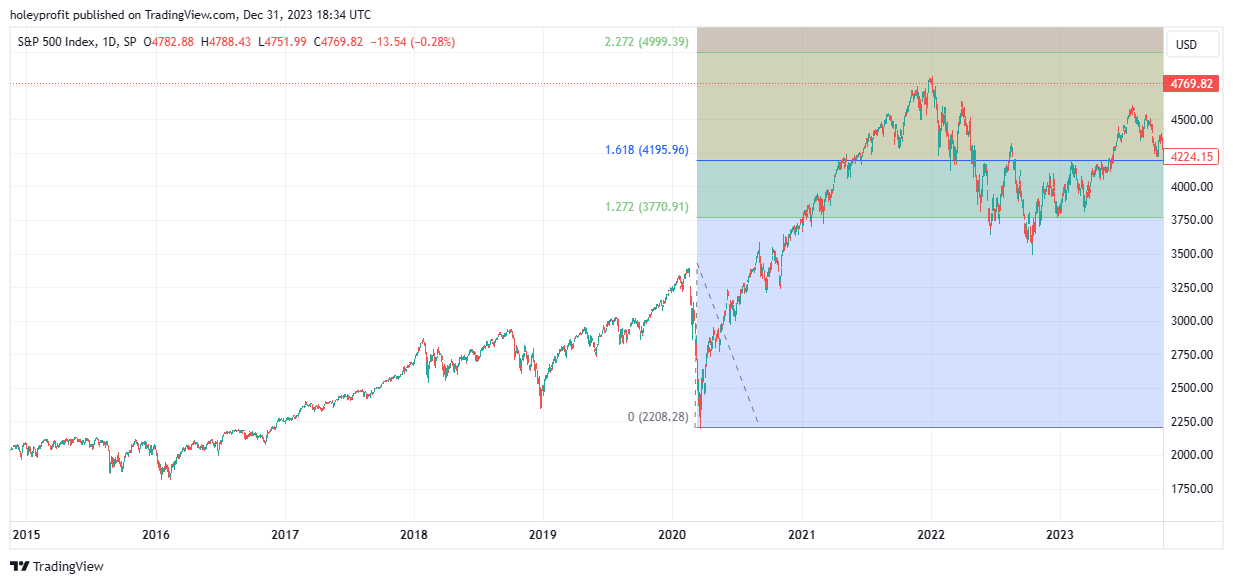
It has long been my premise, and remains so, that if we reject the attempt to break the 4.23 of the 2000 - 2008 crashes range that our technically most probable outcome is a revisit of the 1.27. This is a strong recurring norm in trends and bubbles. That 1.27 fib is a lot lower than we trade at today.
And here’s what I mean by what if perspective comes later. At this point in time anyone who’s been persistently bearish 2023 looks foolish. I was only bearish for two months in 2023 where the market went up substantially and it has made me feel foolish and naive.
But things can change. Bears looked like Mensa level analysts mid 2022 and the more aggressive they were the smarter they looked. Then the pendulum swung and the most aggressive and assertive/confident bears would be the the ones that looked worst only 6 months later. Hypothetically speaking, if we were going to make a return to the 1.27 - Anyone who was bearish over 4400 will be shown to be precocious.
If we were to make the return to 1.27 the amount people would be wrong being bearish around/over the 4.23 measured against how much they’d be right would make everything that seems so very important now seem absolutely laughably small after the fact.
In the hypothetical scenario of the 1.27 being retested you just know when we were there people would be saying what sort of idiot would have possibly thought this would be a long over 4600. The overwhelming reasons to feel bullish now will not even qualify as a distant memory.
The magnitude of a drop to the 1.27 is a scary proposition. It’d seem like something that would concurrently have world changing effects. This type of market move would not just be a “Trading thing”, it’d be a thing in the real world. A drop from the current price to the 1.27 is around 65%.
I know it’s gotten to the point where anyone who mentions a drop of over 50% looks like they’re barking at the moon but this really is a realistic risk as per the norms of charting up bubbles and the pops of them. Mean reversion moves often look like this and all the seemingly big bull wins have actually not changed the big picture.
The sentiment has been changed a lot but inside the scope of perspective of a 1.27 drop anything that has happened recently is basically a non-event. Here’s a thought experiment to demonstrate this. Blue line makes a high around 5300. Red line makes a high 4300. Huge difference … but what difference does is make in context?
In theoretical terms there’s no difference. Of course, those of us who are traders do not have the luxury of making a forecast, sticking by it indefinitely while it is wrong and being able to say we called it if it ever happens at some point. We have to work out how we can actually make money betting on it.
In betting terms, there’s a massive difference between a 4300 and 5300 top.
As traders, we need to just plan for various things and then take it one swing at a time. Traders do not have to be getting everything right, we just need to do well when we’re right and protect ourselves at other times. Getting one good swing covers a lot of losses so long as you’re keeping losses small.
The tougher consideration here is for investors. My premise has long been I think investors should exit risk markets. They might not feel great about it for a little while but measured over 5 or so years they’ll have the opportunity to buy again lower (If they still want to).
It’s been an obvious asymmetrical risk situation to me with the risk being so much higher than the reward. This premise has been based on us making a high somewhere around the 4.23 and returning to at least 2.61 - 1.61. And if that is going to happen, it’s really not worth investors taking the risk at these levels.
There’s a great fallacy perma-bulls push where they’ll say things like, “Well if you’d done that 3 months ago you’d have missed over 10% gains”. Nope …
Let me correct that for you. There’s a bit missing on the end. “… You’d have missed over 10% gains if you take profit now.”
Let me reframe it. Let’s say I got out at 4,000 and the high is made at 5,000. That’s 25% before the high I exit. Someone else holds during this period and sees their account grow 25%. I’m “Missing out”. However, if the market later returns to 2,000 and person B is still holding - I clearly win. My gain is vastly superior and I missed nothing.
This is what I don’t like about the promotional perma bulls. They always seem to run the same double standard of it not being a loss until you close but we absolutely can count any profits as being made even if we do not close. That’s not honest. Floating losses and profits are the same.
So those who propose you’ve not lost anything until you sell should also accept you’ve not gained anything until you sell. You can’t just say losses do not matter while you lock in assumed profits like it’s a sure thing. That’s close to same business model Enron used.
So based on this logic my premise has always been it doesn’t matter if you get out 10 - 20% before the high is made. This only make a difference if you instead top ticked it and exited at the extreme high. If you’re upside potential is 20% or so and downside is over 60%, it just makes no sense to play musical chairs. Just leave the party.
However, in the mid bubble scenario there’d be a lot more meat on the bone. If we’re talking about potential rallies of over 70% there’s extreme opportunity costs to not being long for that. Further to this, there’s a lot more chance people feel pressured into going long near the top just because of how much they’ve missed.
As a trader I don’t see how it matters one way or the other. We’ll break up or we’ll break down and once the definitive break is in it should be easy to make money. In terms of passive investment, it’s a bit trickier. If the 4.23 fails as a resistance then significant upside gains could be missed.
If the 4.23 succeeds as a resistance, then it’s probably highly unwise to be a passive long in the SPX for a very considerable amount of time. It feels like a binary outcome and binary outcomes are hard to deal with from a passive perspective. If you’re not actively adjusting, it’s not fun being wrong on binary outcomes.
For what it’s worth, at this point in time my suggestions to my friends who have passive investments has not changed. I’m still telling them I think they’re best to be out. If they are in, they should have stop losses. That in my perspective the potential reward ill-compensates the risk.
The negative consequences of the big drop are too big to ignore. A good analogy is Russian Roulette. It’s a good of good odds. 5/6 times you’ll be fine. But if you offered me $100,000 each time to play it three times, I’d decline. The odds work, on paper - but the risk of variance is too high.
This is the same for a major market reversal. Even if you price the odds of it somewhere down at 5% it has to be taken seriously if you duly consider everything that’d come with that. The decline of over 70%. Multiple years to recover. Loss/reduction of income. Need for liquidity.
People cavalierly say they’ll just DCA through a bear market but they do not accept the reality of the concurrent events likely in a bear market. They’ll be squeezed. Their attitude for risk will adjust. You can’t eat your stocks and if you do not have food on the table, that’s something you’re going to be aware of. Know what I mean?
When we look at things on a 5 - 10 year basis I think the risk of us being somewhere near the end of an extended rally and due a really deep correction are just too high to justify non-stoploss style risks in the current market. The capital and opportunity costs of being incorrectly long into a deep correction are too high.
Another great fallacy put forward by promotional bulls is if the markets drop that much it’s an apocalyptic event and in such dire real world conditions as these would create, their investments would not matter. You’ll have seen the catchphrase for this, “Money would be the least of my worries.”
Shut up!
If we went into times of extreme events money would be the most of your worries in most outcomes. With exceptions of true extinction level events or you and you’re whole family sadly dying in some sort of war or other event, in dissolute times the value of money greatly increases.
Major indices has happened over 80% on various occasions. The most famous ones are 1929 for the DJI, 2000 for the Nasdaq and 1990 for Nikkei. Neither Japan nor America were “Wiped out” by these market events. The host country survived. It caused global problems but wasn’t an apocalypse.
In reality, all that happened for many people was it became extremely uncomfortable to be poor. On the other end of the scale, millionaires made moves that would make them become billionaires later. It is entirely non-sensical to say money would be the least of your worries.
If there was to be a major market reversal, money would be worth much more than it is today. It’d buy you more comfort and peace of mind. It’ll buy you more assets that have high percentage gains potential. Unless it’s an extinction level event or you’re unlucky enough to be someone who dies, you’d want money after such an event.
There is that pesky little FOMO thing. Doubling your money inn a short period of time is significant. If the market was going to explode upwards before completing the bubble you could significantly forward your investment goals being long (Assuming a good exit higher).
But why would we need heavy risk exposure on this? If you’re willing to accept the premise that the angle of a trend becomes more extreme as it goes on then we have some pretty solid things we know. Like, we know markets have been going up at 60 - 70 degree angles over the last years.
If the premise stands, we know markets should go up at an even more extreme angle. And if you accept the premise that moves need to keep getting stronger then you’d also have to accept that if it can not go up, it’s going to come crashing down. Leads us to a hypothesis of markets go near vertical or bulls get hammered.
So why own stocks? Surely in this environment you’d be better to have aggressive call options. In one of the examples we covered higher we can risk about $8 to win over $500. Let’s do an example of what our risk/reward is like on that verses owning stock for a possible 70% gain;
If you buy $1,000 worth of stock, upside gain potential is $700 and downside is $700 (Or so, depending on what extreme you go to on risk).
If you buy 12 options (Spaced out over time) you spend $106 and if the options hit you’ll make at least $500 out of the $700 you might have gotten and you can make several $1,000 if multiple options bought weeks apart all end up hitting. You have a maximum downside risk of $106 (Maybe even just $8 if the market crashes quickly).
You can put down 10% of the risk it’d take in stock and return somewhere in the range of 70% - 300% + of the gain you’d make in stock if your 70% target hit.
I think the biggest error that can be made from an investor’s perspective at this point is they can make “Investments”. We’re in a highly speculation driven market. Things do not make sense to buy as per investment metrics. Only because they have an impressive record of going up.
If we’re going to speculate, we might as well do it right. Looking to optimise our return for the lowest amount of capital and executing our bet by being clear on exactly what we’re speculating on. We’re not just speculating the market will “Go up”. We’re speculating on increased upside volatility.
To do that, especially if we accept this comes with the risk of increased downside volatility, we should just own cheap calls that will do well in the event a big rally does happen whilst having a nominal affect on our overall portfolio if it does not happen and something dramatic to the other side happens.
This isn’t me necessarily saying I think readers should be buying OTM calls just for the sake of it. Rather I am saying if you’d take exposure here anyway then it makes much more sense to do this with options where you can pay less for the position and benefit exponentially if it happens.
I really can’t make blanket suggestions as to what people do. Legally, morally and just inside of common sense. What I’ll say is when friends I know in real life ask me about things they might do for a lot of circumstances my opinion is they should sell all their risk assets and then put 5 - 10% of the cash into OTM calls.
They should buy the calls with a good amount of time on them and they should build up a position of lots of tiny bets over time. Accept a known risk of 3-9 months range in a bull market and use a building strategy that will make best use of those conditions.
I feel this has a good outlook for them in most outcomes. If the market ranges at the high for a few months and then heads into a big rally, they’re going to end up with a better net return than they get on stock. Were the market to only spike nominally and reverse quickly, they’d lose perhaps 2% of their portfolio.
The biggest risk condition for them is the market trades flat for a long time. Allowing them to build the position and then drops. Which is the conditions of maximum loss. Alternatively the risk is the market flattens for a prolonged period of time which would result in a 10% loss on action that would have been even on stock.
The former of these risks does not matter. We’re talking about people who have full exposure otherwise. They lose 10% rather than 60% plus. It’s a win. The latter is the more problematic one. That’s what stops it being a free lunch. Because we just do not know the market will not fail to crash but just chop for a very long time.
If the premise of us being in expanding volatility and it being a requirement that wilder and wilder things happen until there’s a crescendo event fails, then this strategy will fail. There will be losses made and there’d not have been losses made with a simple buy and hold stock strategy.
If the premise holds true, then this massively overperforms holding stock in most outcomes. The one in which it is least impressive in terms of dollars gained is if the move up happens really quickly and you only have a very small position on. In that one scenario you might miss some money.
In any outcome where you can accumulate for a while before it happens you’ll make a larger profit than you would have otherwise. Larger in dollar value and using less risk for it. Of course, in the scenario where the market crashes you’d lose somewhere between five to ten times less than stock exposure.
Preferences and Biases on Trade Plans
While many people think of me as a bear (And they should. I do bearish things) my preference of the possible outcomes covered is with the Japan-esk move.
There are some people who think markets will drop over 70% and trigger depressions and they’re so focused on why it should happen now. I say, “What’s the hurry?”. Some people believe a mega crash is inevitable. At the risk of being an absolutes speaker, I am one of these people.
But the higher it comes from the better, if we’re talking about things from the perspective of making money. Which is the goal of this newsletter. To look at real trading opportunities and not just express my world view of how things should be (Which by the way, would put the top somewhere back at 2018 - this is insane!).
Obviously if you’re losing in shorts this is a good reason to want the market to drop but outside of that, there’s not any. Not outcome of ideology or ego. We have volatility on both sides now, anyway. See, in 2016 it was worth traders hoping the market dropped- because it was so damn slow and boring to the upside.
Not now. If our implied upside move is a rapid doubling that’s something we can get excited about. It’s, at least, equally exciting as a trading op as the market dropping 50%. My preference would be to hit two mega swings rather than just hitting one. I’d be able to bet bigger on the drop from better prices.
Some people have a sort of resentment for people who make what they deem as silly speculations and do well with them. It seems to get some people as mad as them actually losing in shorts does. They don’t like to see people doing well with bets they consider dumb.
I experienced this myself in 2019 when I made my first big bear venture into SPX but by this point I’ve noticed this is purely an ego and ideological perspective which serves me no good at all. If hyper aggressive bulls make good money, I am happy for them. Though I do fear they won’t keep it.
Preferences do not matter. I’m just saying for the sake of saying at this point my preference would absolutely be the rally. It’d be easier and I’d make more money.
In terms of biases, I don’t put too much weight on my opinions at the best of times and I’ve been wrong for a couple months so even less so now. I think based on the preponderance of things I come down bias towards us being late bull market/early bear market. Which is to say the high break I think will be false.
How aggressive the stop running of this would be is something I feel there’s some room for variance in but when I take the binary view of us being either mid or late bubble, I think I still come down on late bubble. Where the exact high on this is would not affect where the implied target would be. 4.23 spike out to 1.27 reversion.
I’ve seen a lot of examples of us having price action moves similar to our current ones in SPX and then the market has absolutely boomed through the high in the following months. It does make me far more prone to making sure I bull breakout and reversal levels planned but I think this might be a situation where context is king.
This looks really bullish.
But this 4.23 is a much more significant thing which has taken a lot longer to setup.

Until we can see real signs of this area being broken, I remain skewed towards a bias of a topping pattern spiking out the 4.23.
If the grinding uptrend continues I’ll pick up long positions with tight stops. If higher lows are holding, you might as well buy close to the last lows and put stops under them. It is possible the move builds up and goes into a state of overperformance and if that’s the case we’d want positions in before it started.
Hope isn’t a strategy and I refrain from using the word often, but I do hope that if we’re going to see the extended upside move there’s a prolonged range before it. Because if we traded flat in the 5,000 area for 6 months I’d find it far easier to be bullish. I find it hard to be bullish when we’re just up day after day.
I’m thinking the most probable outcomes are a spike/turn sometime relatively soon or a big bull move but it being largely deferred and us having mostly ranging conditions for a while. Bears are better served by some spike and rejection event. A slow grinding up into a choppy range I think better serves the bull case.
One thing’s for sure, the premium on being persistently wrong on either side of the implied moves would be very high. When it comes to bearish plans, it really would be painful to be stubborn if we made a multiple month range with many bear traps and then went into a strong rally. Would give so much time to make mistakes.
As bulls, the conditions for a rug pull are rife. Multiple decade support. Exceptional percentage gains over the last years. Epic recent rally making is almost impossible to be a bear at current levels. While a speculative case for a much higher market can be made - I can not justify full portfolio exposure to it.
The expansion of volatility is something that keeps proving itself over and over again. Every time we think we’ve seen extreme market moves even more extreme ones come. We have fattening tails. Since 2018 there’ve been lots of fat tails. In current times the most reliable assumption of markets has been volatility will keep expanding.
I think sometime in the next 2-3 years we’re going to see crescendos in this volatility expansion. Really big things. Things that earn their places in the history books as extreme market events as the question of late or mid bubble is answered.
If a big bear event is coming, I think it’s sooner rather than later now. Can be some stop hunts etc (And these can feel like a huge deal at the time) but I think we’d be close to the end a spike out trap and bear momentum would be fairly consistent for a while in a turn.
If a big bull event is coming, I’d really not be shocked to see a largely flat year preceding it. Market grinds higher early in the year and then goes into a largely trendless stage. Only way to make money is trading the range and then accumulation in the latter part of it.
All of the scenarios covered here give us good opportunities. If any of these turns out to be in play we can apply the applicable strategies and have the potential to make good money. We have a good chance of strong trends or a predictable range in the coming 3 - 6 months.
We can plan things we’d expect to see in different outcomes and know what strategies we want to be using if we see conditions consistent with our plans.