

2.20 Momentum Breakout Strategy w/ Deep Retrace
Trend Following and Counter-Trend (during retracements)

This is part of a series of strategy posts.
Once all strategy posts are up, they will be linked together. Initially there will be placeholders for links - Marked “(Link)”. This is because all posts need to be published to be able to interlink them. Please check back later for complete interlinking.
The original series of posts will contain 15 strategies. All of them time tested and ones I’ve personally used to make a living in markets for over 10 years. These will all be free. Multiple additional posts will be added for paid members. Discussing advanced strategy, nuances and covering the common questions we’d expect about the strats.
Strategy Name:
2.20 Momentum Breakout Strategy w/ Deep Retrace
Strategy Type:
Trend Following and Counter-Trend (during retracements)
Strategy Premise Overview:
-This strategy aims to identify important breakout moves that have a strong chance of ultimately meaning the trend will develop further but rather than jumping on momentum moves planning optimal levels for retracements to limit into higher RR trades.
-The strategy aims to define a breakout level and also a deep retracement level for a continuation entry.
Conditions for Use:
-Best applied in strongly trending markets where clear directional movements are evident. This is a trend trading strategy. If there is no clear trend, this strategy is likely to generate losses.
-The strategy needs pullbacks in a trend. It cannot be used if the trend is running and running without any notable pullbacks. This is aimed at taking advantage of a zigzagging market trend.
Planning Entries:
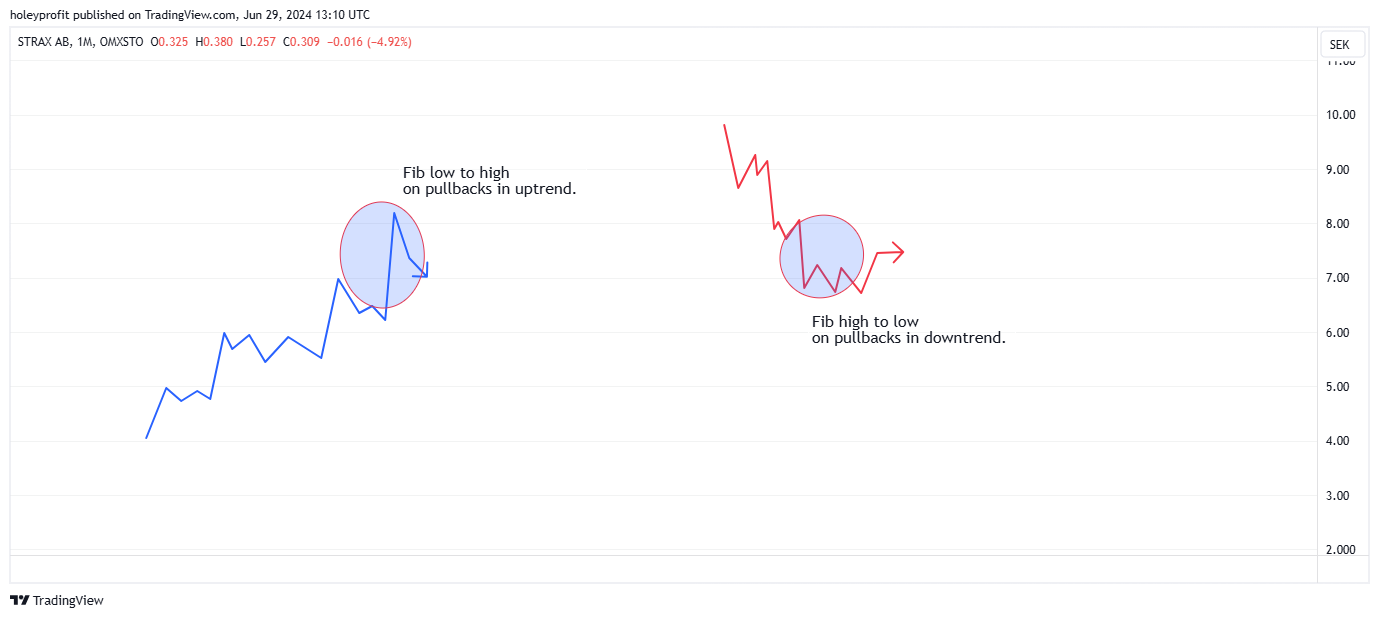
- Once we have identified a target trend, we want to wait for pullbacks in the trend. Depth and style of these do not matter much (as long as they’re not entirely nominal pullbacks hardly registering on the chart), whatever the pullback is we are looking to use it to draw an extension fib from the start to the end of the pullback.

- The tendency the strategy bets on is if the 2.20 fib is hit then a retracement should only be able to make a small spike out of 1.27. Around 1.27 is a good continuation entry.

-Set alerts near the 2.20 fib. The conditions for placing a pending order is when the price gets near the 2.20 fib.
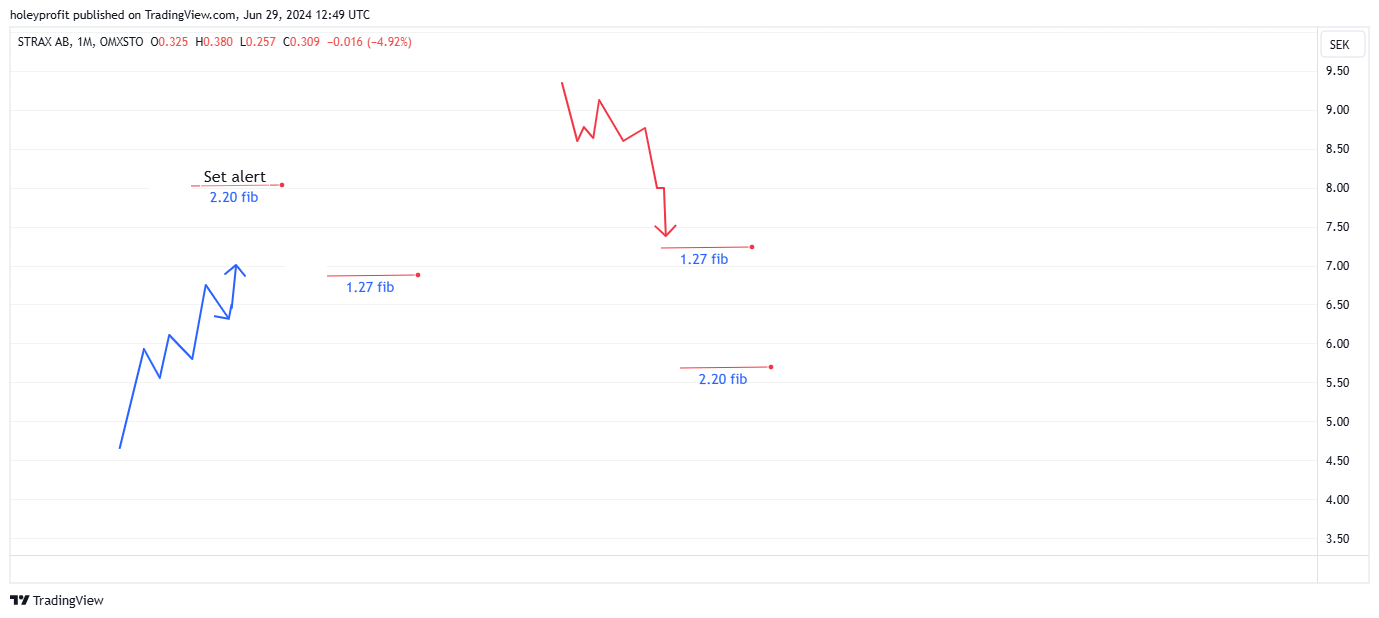
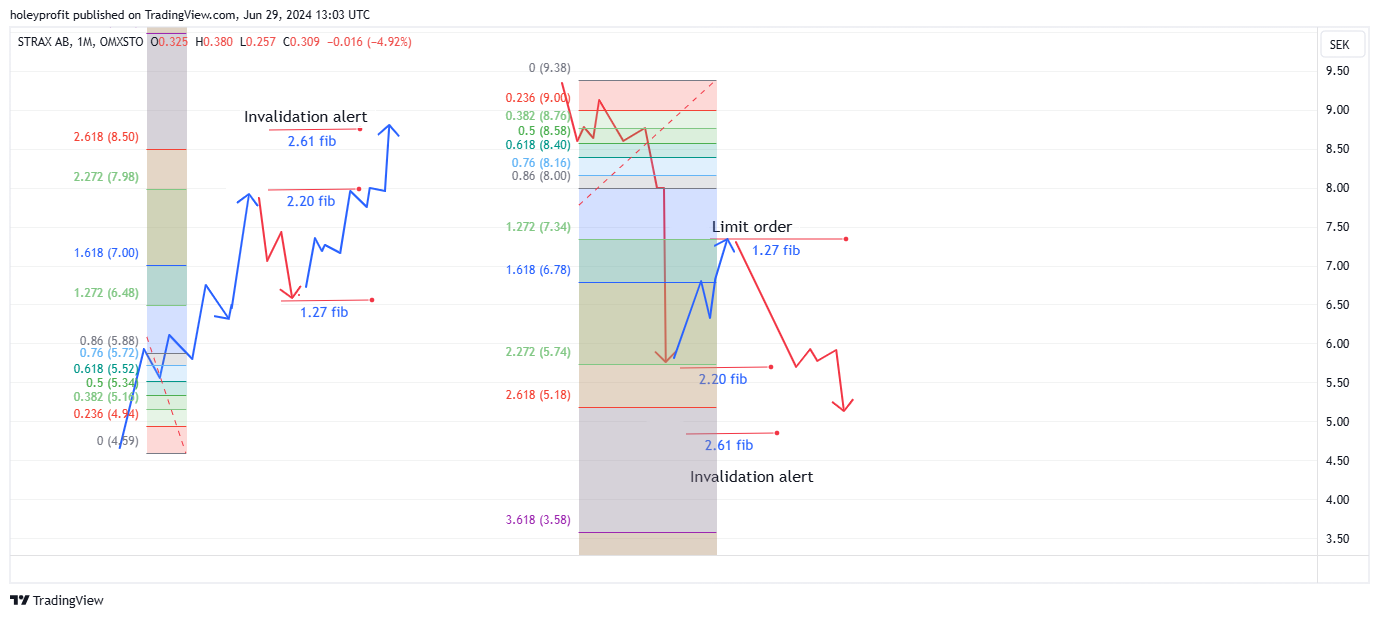
-Once the price approaches the 2.20 fib, set a pending limit order at the 1.27 fib.

-Once a limit order is set, another price alert just past the 2.61 fib. If this hits, the limit order should be considered missed and deleted.

Planning Stops:
-In this setup, we expect the 1.27 to spike out a bit, but not by much. Stops can be based on this and a combination of SR/candle patterns but for a static rule stops behind the 100% retracement for tight and behind the 86% retracement for wide.


Planning Targets:
-The earliest target for this is close to the 2.20. Usually the trade will have more to go but this is a sensible place to start trailing stops.
- The minimum target is 2.61.
-2.61 breaks can trigger moves to 3.20 and as far as 4.23. This can potentially double the profit of the trade. A good method of managing trades is trailing stops tight rather than just exiting on the resistance.

-If using passive execution and no trailing stops, 2.61 is a good target. The risk of reversals from there can be high.
Typical Win Path:
-The fill of the pending order in this setup will usually be scary price action. Looking at recent candles, it will not look likely the move is about to turn imminently.

-Wick candles usually appear after the 1.27 fib, frequently followed by engulfing candles.
-The move should pick up a lot more momentum upon the rebreaking of the 1.61 fib.

Typical Lose Path:
- The main risk of this setup is being caught on the wrong side of a 1.61 reversal where we have had a big overshoot (Link)
Why Strategy is Expected to be Successful:
-1.61 extensions of pullbacks in trends are often important levels. False breakout moves most often end around them and most often when they are broken it’s a sign the trend is strong.
-The strategy leans on the time-tested ideals of breakout, retest, and continuation. Although we are not specifically referencing market structure in this strategy, you’ll usually see it matches up well with basic trend retest theory.
-Looking to enter at 1.27 retracements means we are only ever looking for high-value entries. At points where there has been a substantial pullback in the trend.
-The pullback level here is so deep that we’re essentially betting close to where we think the trend overall fails. This means we have a small risk zone. On the other side of this, if the trade is successful, we have a large profit area, with a minimum of 1:2.5 RR and frequently far higher realized RR can be taken with trailing stops.
Known Risks and Weaknesses:
-Random to terrible in a ranging market. Becomes frustrating quickly. This will perform best when we have trending conditions that are making nice zigzagging patterns.
-By necessity, this strategy will frequently enter into moves which may be 1.61 reversals (Links). Many spectacular reversals come from 1.61’s and sometimes price is going to blow clean through the limits and stops. 1.61 reversals can come anywhere up to 2.20. Meaning near misses of 2.20 can still fall under this.
Trade Plan Execution:
Bullish Execution Plan:
Step 1: Market Analysis
Identify a strongly trending market with clear directional movements and significant pullbacks. Avoid markets without notable pullbacks as they may lead to losses.
Confirm the presence of a trend characterized by zigzag patterns indicating potential pullback opportunities.
Step 2: Identify Entry Points
Wait for a pullback in the trend, regardless of its depth or style, as long as it's not nominal.
Draw Fibonacci extension levels from the start to the end of the pullback.
Set alerts near the 2.20 Fibonacci extension level.

Step 3: Breakout Entry
Once the price approaches the 2.20 Fibonacci extension level, consider it a breakout area.
Place a pending limit order at the 1.27 Fibonacci extension level.

Step 4: Managing Pending Orders
Set another price alert just past the 2.61 Fibonacci extension level. If this level is hit, delete the pending limit order as the setup may be invalidated.

Step 5: Stop Loss Placement
Set stop losses behind the 100% retracement for tight stops or behind the 86% retracement for wider stops.
Base stop loss placement on a combination of support/resistance levels and candlestick patterns.
Step 6: Manage Trade
Move stop to even once the 1.61 is broken.
Begin to trail stops more aggressively to lock in profits close to 2.61.
Step 7: Set Targets
Target the 2.61 Fibonacci extension level as the initial profit-taking area.
Consider trailing stops tightly rather than exiting at resistance levels to capture potential moves to 3.20 or 4.23.
Bearish Execution Plan:
Step 1: Market Analysis
Identify a strongly trending market with clear directional movements and significant pullbacks. Avoid markets without notable pullbacks as they may lead to losses.
Confirm the presence of a downtrend characterized by zigzag patterns indicating potential pullback opportunities.
Step 2: Identify Entry Points
Wait for a pullback in the trend, regardless of its depth or style, as long as it's not nominal.
Draw Fibonacci extension levels from the start to the end of the pullback.
Set alerts near the 2.20 Fibonacci extension level.
Step 3: Breakout Entry
Once the price approaches the 2.20 Fibonacci extension level, consider it a breakout area.
Place a pending limit order at the 1.27 Fibonacci extension level.
Step 4: Managing Pending Orders
Set another price alert just past the 2.61 Fibonacci extension level. If this level is hit, delete the pending limit order as the setup may be invalidated.
Step 5: Stop Loss Placement
Set stop losses behind the 100% retracement for tight stops or behind the 86% retracement for wider stops.
Base stop loss placement on a combination of support/resistance levels and candlestick patterns.
Step 6: Manage Trade
Move stop to even once the 1.61 is broken.
Begin to trail stops more aggressively to lock in profits close to 2.61.
Step 7: Set Targets
Target the 2.61 Fibonacci extension level as the initial profit-taking area.
Consider trailing stops tightly rather than exiting at support levels to capture potential moves to 3.20 or 4.23.
HoleyProfit’s Strategies is a reader-supported publication. To receive new posts and support my work, consider becoming a free or paid subscriber.