
4105 - 4140 are the big levels of interest now.
4105 - 4140 are the big levels of interest now.
Bulls above 4140 have potential to be strong.

Title: Technical Analysis: Key Levels and Patterns for SPX Bulls and Bears
Subtitle: Exploring potential break levels, reversal patterns, and implications for bullish and bearish traders
Bullish Break Levels in SPX
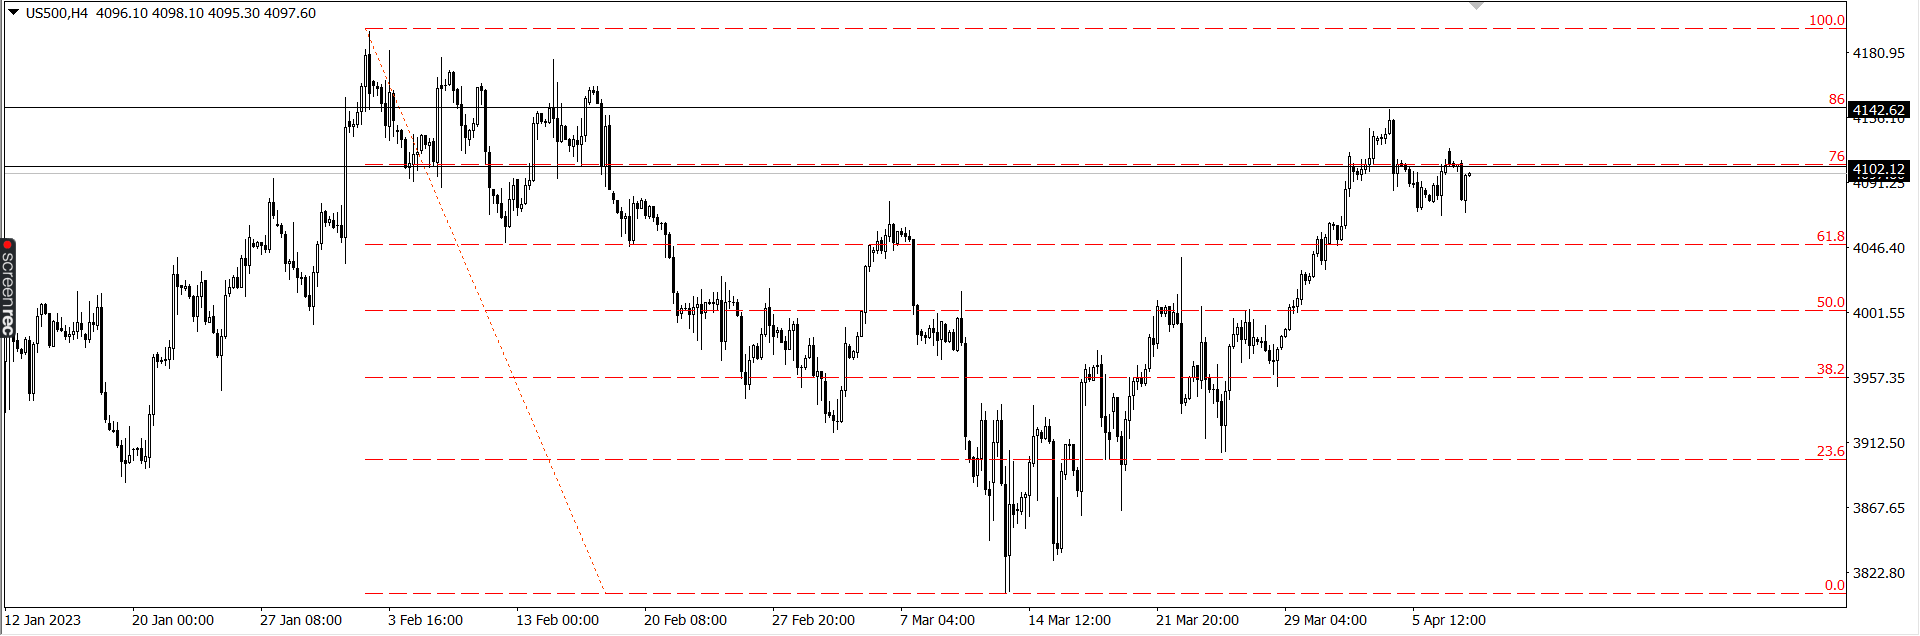
The 4105 - 4045 range in the S&P 500 (SPX) could present significant breaks for bullish traders. These levels correspond to the 76% and 86% Fibonacci retracements of the previous sell-off. With the market already hitting the 86% Fibonacci level, the odds lean more towards a break than a reversal. If a bullish break materializes, the next major target could be the 4300 level
.
Bearish Butterfly Levels and Norms
A break above 4140 in the SPX might indicate the initial sign of a bearish butterfly pattern failure. Failures of these types of patterns often imply a strong trend continuation. However, it's important to remember that this is a potential reversal pattern, and bulls should respect that by keeping their stops tight. The maximum bear stop loss on this pattern would typically be just above 4200.
Potential smaller Butterfly Levels
If the market rallies from the current low, a smaller butterfly pattern could emerge with levels at 4040 and 4165. Around 4140 would be the implied bear entry, with stops situated near 4170. It's worth noting that when these patterns appear at 76% or 86% breaks, the harmonic often fails. A failure of the harmonic at this level could imply a strong uptrend if the market moves above 4170
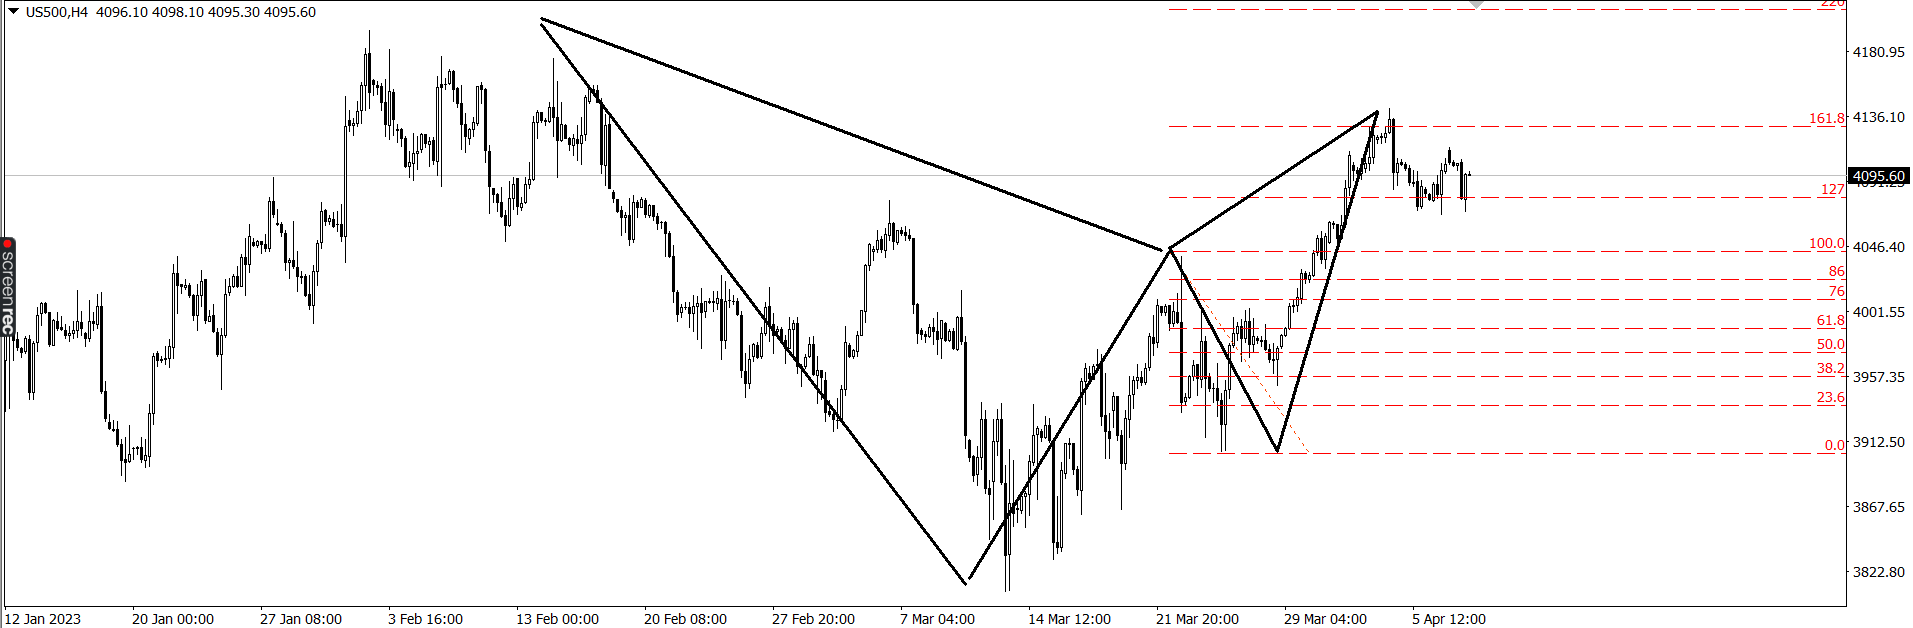
.
Bear Break Levels
With the 86 having hit and a possible second break of the 76 forming here, the bias is towards a bull breakout. Price has to break back under the 61 fib to start to give the edge back to the bears. Pullbacks from the 86 fib into the 76 fib zone are very common in uptrends. Breaking under the 61 fib and hitting the 50 fib would turn bias towards shorting rips. Usually looking for a retest of the previously broken fib.

==========
I think the bull case here looks really good, but if trading bullish it’s best to keep tight stops because any bear breaks could be abrupt.
Over 4140 - 4170 would strongly imply bull continuation.
Under 4050 - 4000 could mean bears are back in control (Or at least bulls are weaker than expected).