A full plan for month of June 2022
Primary and contingency trade plans for a very interesting market

There’s an incredible amount of interesting theoretical/educational things to be said about the big charts in markets now. This is something we’ll have to look into later, because while it is interesting it’s not directly actionable now - and planning for what may be right ahead is more important.
The stretched elastic band
Those who’ve followed my work any length of time will know I will tend towards being quite bullish into strong down markets and bearish into up markets, but when something does not work out a few times in a row and a fail point is defined I’ll often very quickly switch to following the momentum.
I’ll use the elastic band analogy to give some insight into why my trade plans look like this and why I become particularly paranoid about shorts doing well and frequently have bullish trade plans out while being quite clearly a “Perma-bear” (Until the drop is done or my overall thesis fails). I’m a macro bear, but I post bull plans a lot.
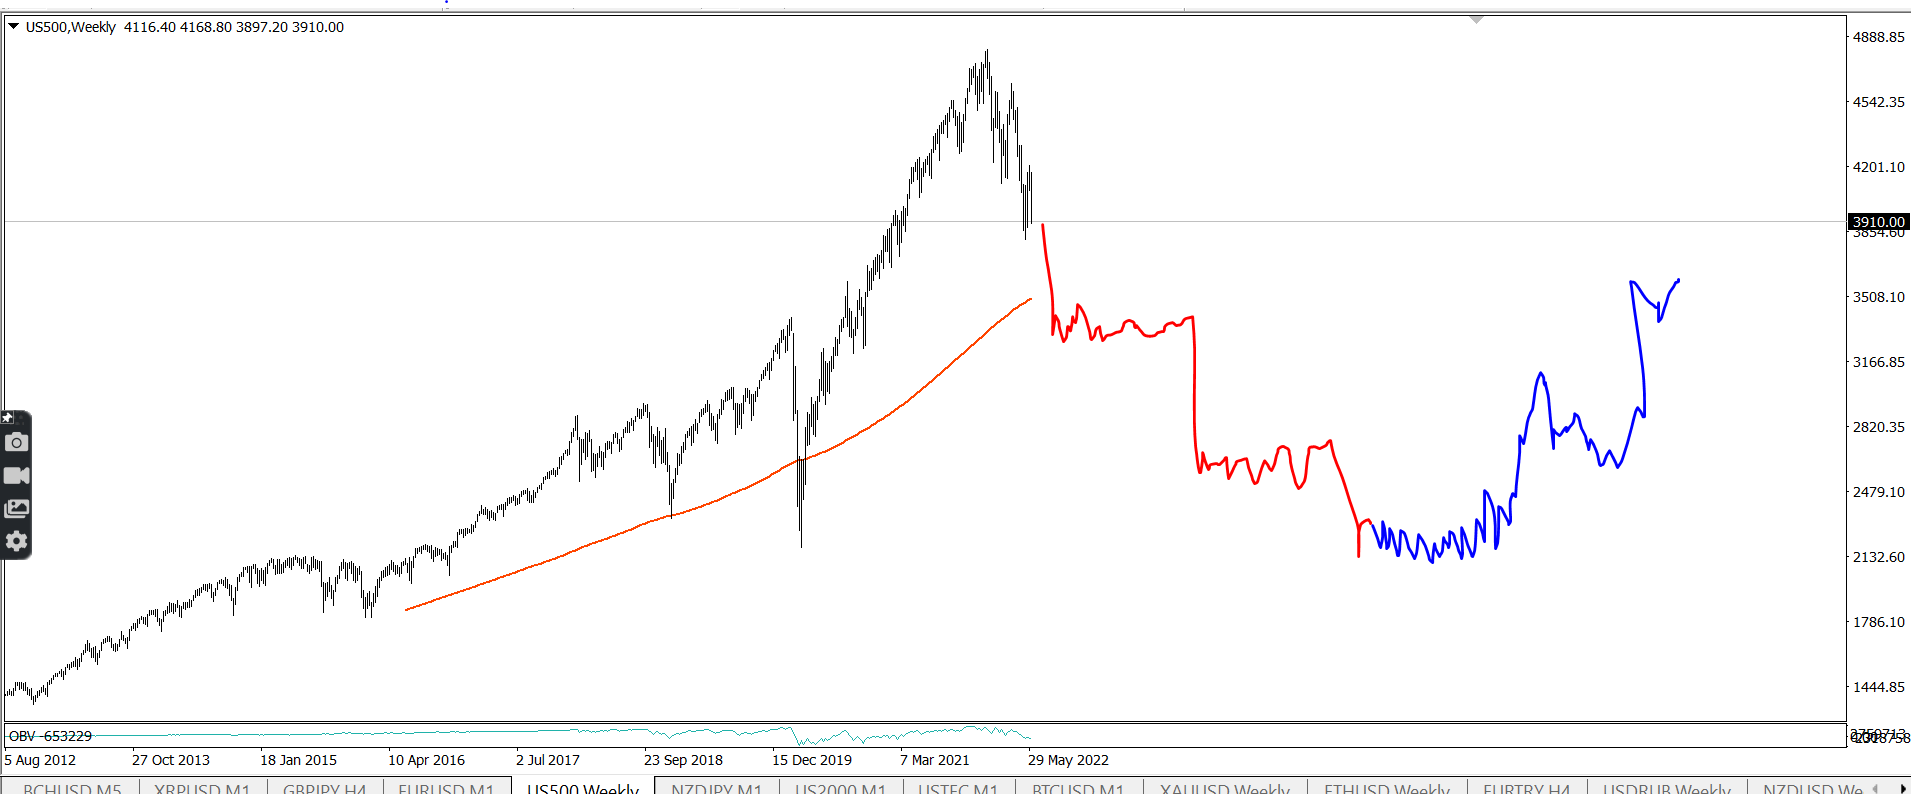
Firstly, I am not saying it ‘Looks good’ but if you draw a line to connect the left of the chart with the right of the chart - Line go up. Quite clearly! By simple definition, SPX is in a monthly chart uptrend. And until recently this was also true of weekly and daily charts (These are being more challenged now).

In an uptrend, all moves down are subject to the “Elastic band” theory. If we’re in a downtrend, all moves up are. The analogy is as follows;
When you stretch a band to it’s full extreme - as far as it will go without snapping, you store up a lot of energy in this band. Physics and stuff, IDK. But if the band is let go, it’s going to make a sharp and vicious move against the direction it has been pulled. A market making a low from a “stretched band” is going to really boom when it starts.
However, if the band is not released and more pressure it put on it the band will snap. When it snaps it’s usually going to yo-yo up and down a bit but ultimately it flops. And this is what a bear break is like. The market is pushed to it’s testing point and then the testing point fails. Often there’s a little kick of bull, but the bear move comes.
If you’ve ever played with elastic bands you’ll know both of these things can sting your fingers. And I want to avoid that. This is why I am always paranoid, redundantly prepared and willing to flip-flop on plans around big inflection points. I assume if I get it wrong on either side, I’ll get my fingers pinged.
And I’m explaining all this because I think this is the Mother of elastic band things. A big industrial elastic band. I think a lot of “Energy” is in the market - and something big has to happen. I feel we’re going to have a fat tail event soon. “Fat tail” events just mean moves that are outside of the expected norms. A surprising move.
We seen a huge build up of fat tail events in 2021 on the memes. Things like ORPH shooting up 700% in a day and then topping on the fib extensions and crashing all the way back down the same day. Lots of unusual moves happened and then they built up to moves in big stocks like AMZN.
And I think now the fat tails may be coming to the indices. We’ve already seen highly increased volatility in indices, but I think we might be about to see something bigger than that. I think on the weekly chart if we get a bull move it will take out most of the drop in only a few candles and if we get a bear move it will spectacular.

We’re sitting right between the 161 of March 2020 and the 161 of the topping swing.
This is fib porn. I truly find it hard to believe I am looking at this.
I knew fibs worked like this in the previous crashes because I looked. And I know they work day to day like this in mini bubbles/busts intra-day because I spent years and year practicing using them. So I knew in theory this should work - but it’s still pretty incredible to see this on the largest of stages.
And it implies a big elastic band decision!
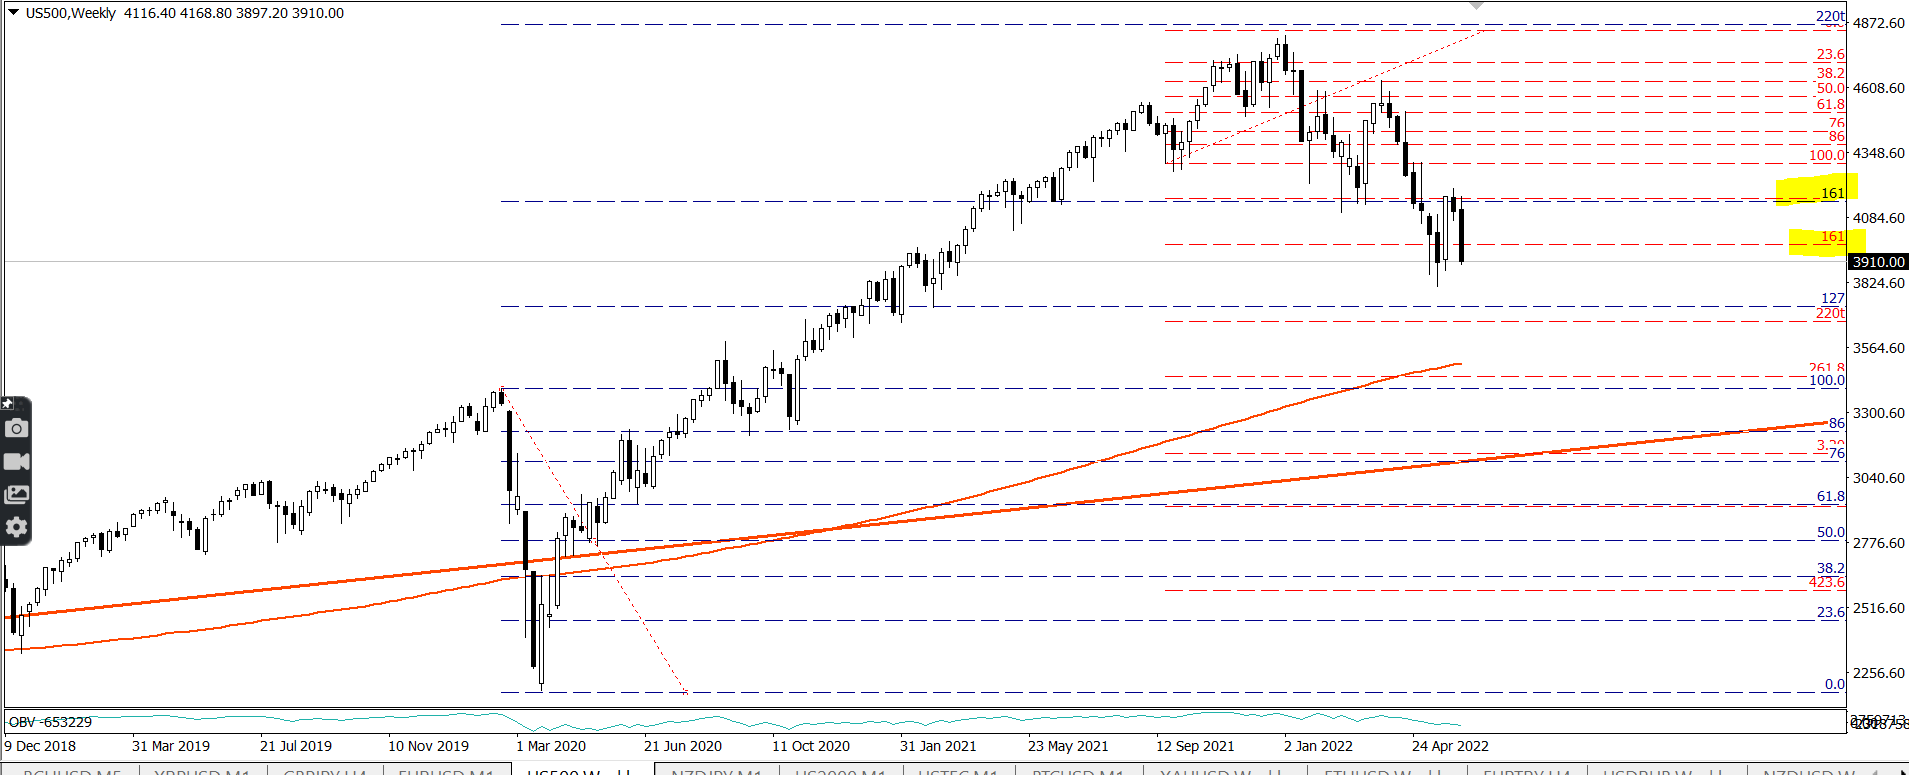
I’m starting to very seriously consider if a bear break is made we’re not going to make a low above 2900 in the next swing. The 3300 bounce trade may be off the table. Feeling more and more if we enter into a sell-off it’s going to just be a dive. Only shallow rallies (Big at the time) and we’re in real bear market.
If the move up comes, bears could be a in a hell of a lot of trouble. This is something we need to clearly define beforehand where we’d be getting failure signals on bear trades. I don’t think it will happen, but it’s the things you do not think will happen that are most important to prep for. I know what to do if what I expect happens.
Limited number of outcomes
While markets can do anything, there usually a limited number of outcomes that will happen. Let’s take a look at smaller charts and look at the different types of moves we might get in a bear break or bull reversal. A bear break can come in various different ways and we need to look at of all those.
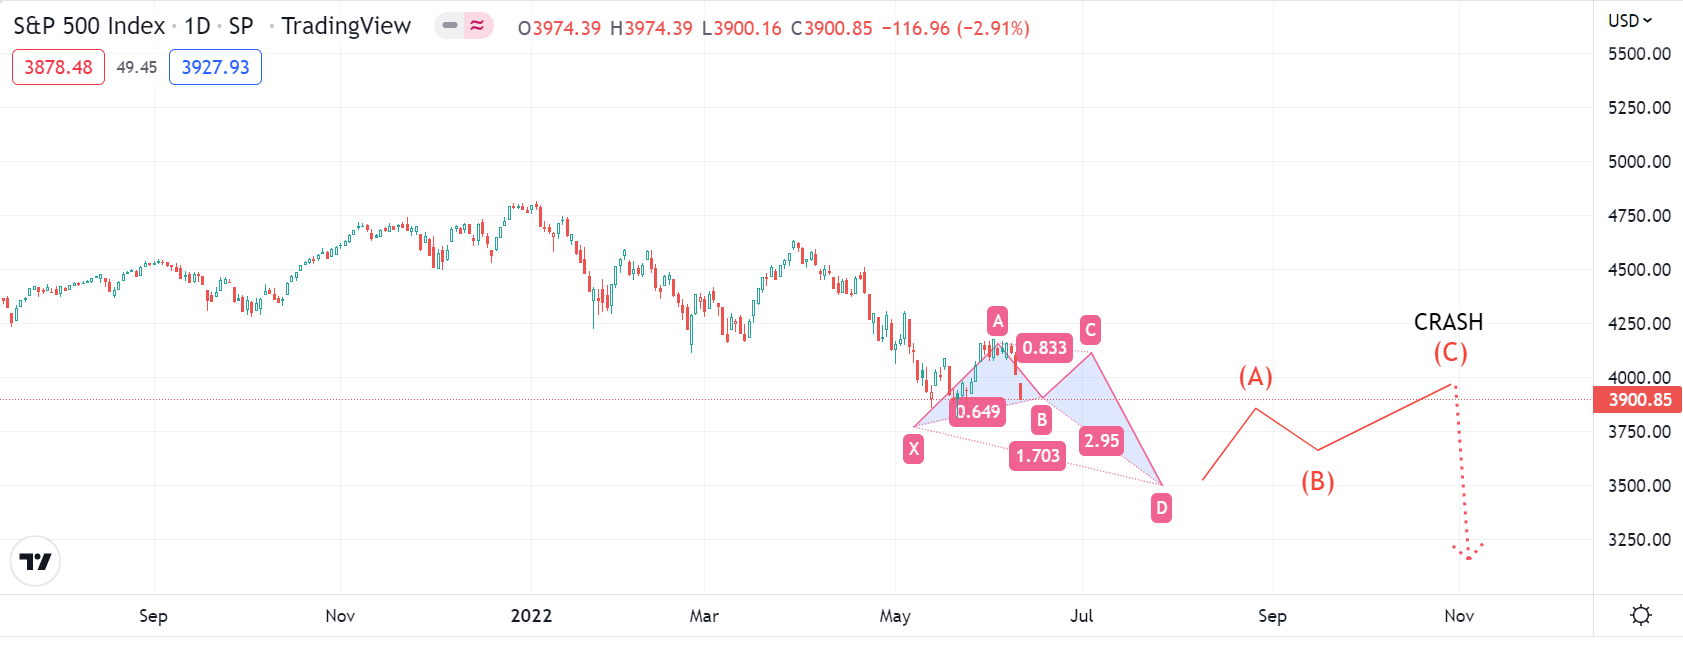
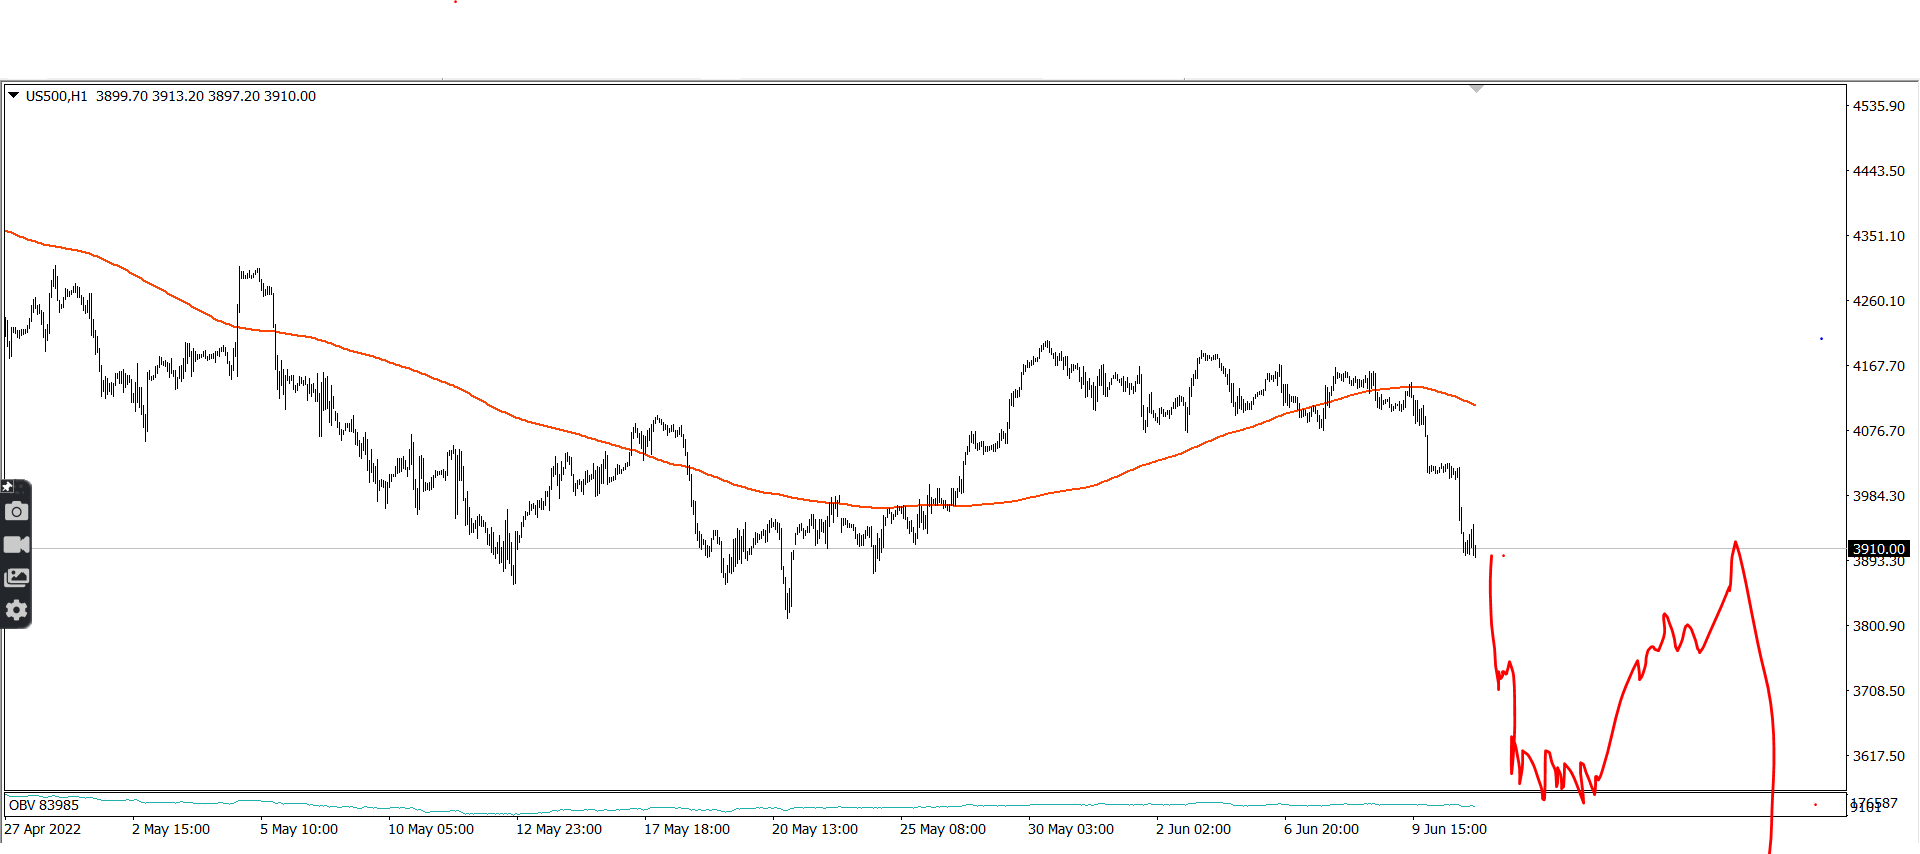
Here’s the one I favour. Would be a lot of great opportunities in this if it came together.

This would be the forming of a failed butterfly pattern, a little bull trap and these can turn into capitulation signals. And hopefully I’ve shown you that to expect capitulation making previous price action look tiny is not at all unreasonable on 161 breaks. Nor is it unreasonable to think following fibs are good targets.
Conditions:
SPX opens up or trades only nominally lower. Must not go substantially lower.
Trades up to 4160. This is 86% retracement of the drop (We assume a low).
From here rally fails and into downtrend.
Downtrend breaks 161. Butterfly failed.

Upon the failure of the butterfly we’ll often see a retest of the last low. Very often there’ll be a dummy sell and then a spike over the last high. And it’s into this retest I think a major crash would start. If we have this setup, I think into this action will be our ideal positioning.
The breaking of the bullish butterflies was such a clear signal of the 2007 market turning into the 2008 crash.

Someone well experienced using harmonics in markets that go both ways would have picked up buy signals here and been hitting the clear strategy stop loss rules just before the crash. Anyone really into harmonics, would also feel that implied major bull trend failure.
And something like this happening today would be the easiest signal we’d be able to get to pick up a very likely starting point of the crash and also have a very good idea at which point downtrend would become capitulation. This might not happen, but the 86% retracement and rejection are things we will not miss if we watchlist them.
Contingencies
One of the most brutal things that could happen would be a tiny spike-out of the last high and a rejection of it. These are tough to trade in real time. Probably lose short-term trades here. We’ll deal with this as it comes but just putting it up there are a warning or what a horrible tricky move could look like.

Lots of false breaks. Confusing action. Hard to trade. We’d be able to spot it starting to fail so long as we do not get too frustrated during it. Planning ahead helps.
The shallow bull trap. This is an entry you’re not really going to have much chance of missing if you follow basic bear market rally stuff. The main problem here is these are going to definitely pick up false signals if any type of more bullish move forms. Regardless of where the market is going, basic bear signals around 4075 typical.
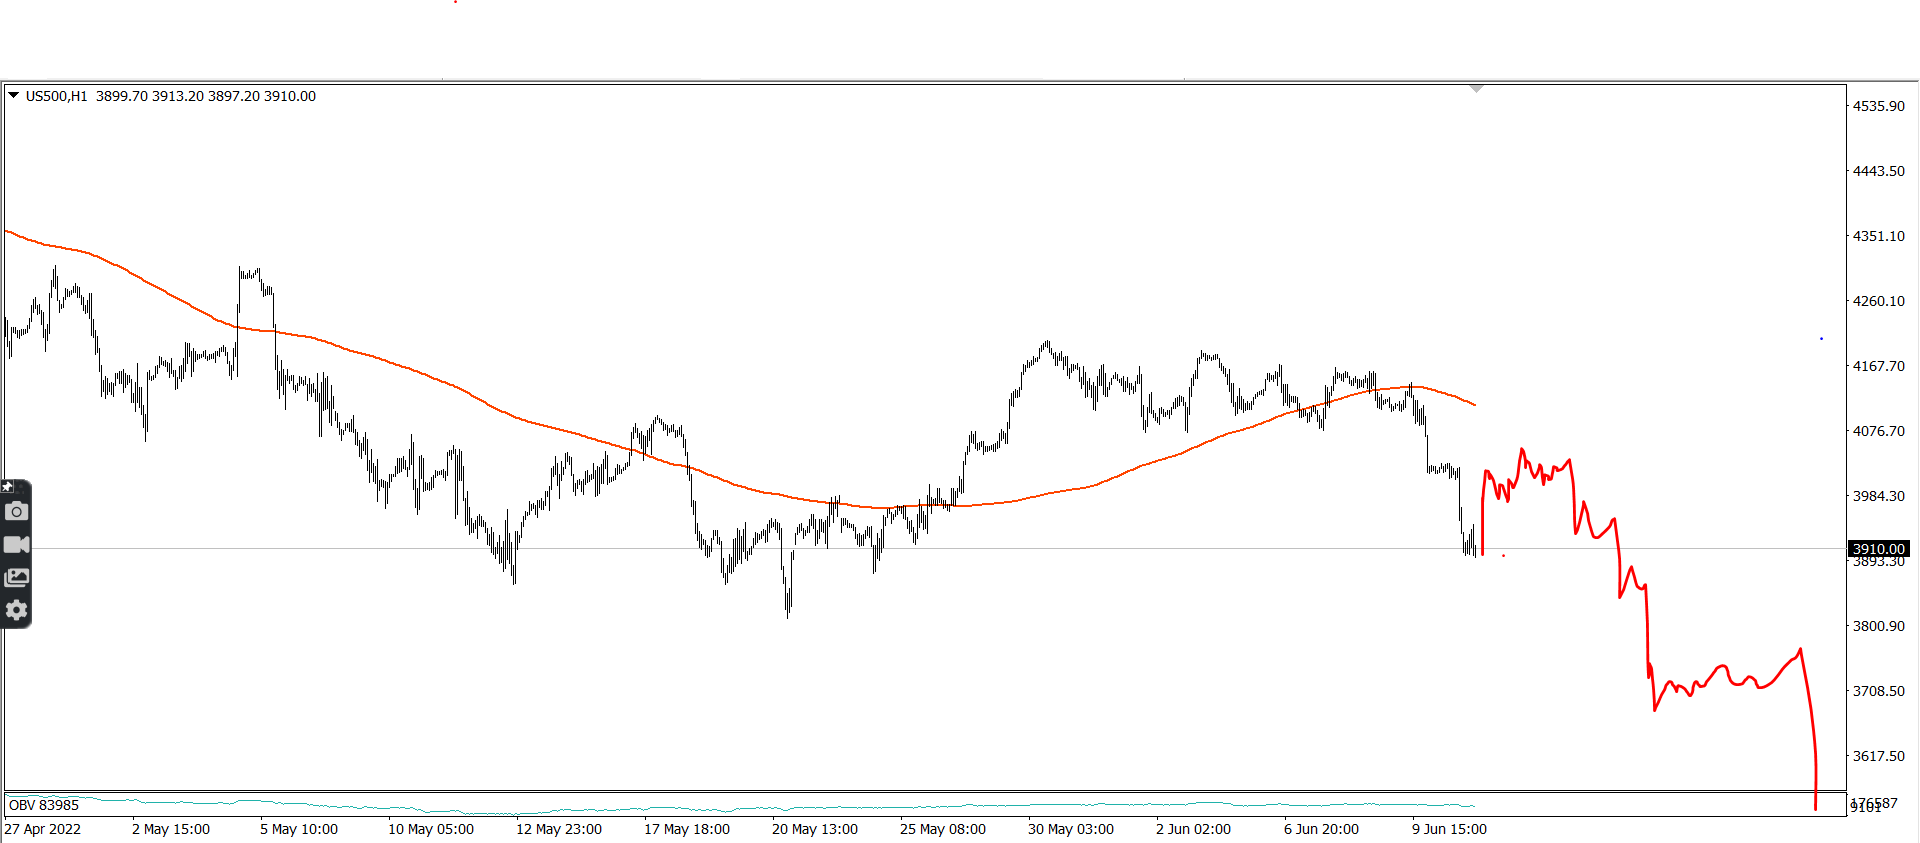
A clean break. I often do not do well in these initially because they’re rarer and I tend to position more for other more common possibilities but if we see this there’s usually a big flush. Sometimes a second one after a range and then we rally back to retest the break. This is the optimal short level.
I’d be looking to buy into this if it happened as it was getting really bad looking. Short-term bearish momentum signals would probably form on small timeframes before this type of break. It may be possible to pick up momentum based trades with tight stops for this.
The harmonic. This would be a couple of really wild swings and there’d probably be news. The failure of the harmonic as a bear signal would also be our cue to start to look for bullish signals.

While market trades above 3880, the primary plan is the one I favour. I’m going to look to pick up tight stop long positions low. Hold them with a target of close to a double top and I’ll probably lose some shorts on the common retrace levels - just because I think they’re worth the cost of losing if they work.
If this swing is made, I plan to start shorting 86 fib and add to my position as we break the 76 and 61 fibs on the way down. I’ll target somewhere between the 161 and 220 of the possible butterfly on the bulk of my shorts - and if these things happen, I’ll look for a crash potentially setting up off the next rally.
The market might go down on bigger charts like this.

It’s a hell of a thought. We might have no big bounces. We’ll deal with this by simply remaining short bias while lower highs are forming. Look out for failure of this on supports and add to shorts if supports fail. It’s really a hell of a thought, but it seems this could happen on large charts.

The next big break might be the very objective end of the bull run.
We might be right here.

That would make this a very real break.