
A look at what right ahead and far ahead.
A look at what right ahead and far ahead.
Actionable short term trade plans and a long-term warning.

This post is free to all and is pretty high effort. In the first section we’ll talk about real trade planning and strategy and cover full trade plans for multiple different moves that can form over the coming months. Signals from this are suitable for swing trading and help with road-maps for short term trading.
The second part looks at the macro. You can skip to that if that’s all you’re interested in. The macro is scary now. It would seem the probabilities of a very serious crash are extremely high. I’m not talking a dip or big correction, if the implied move comes it’d be a generational defining event.
You can join us a paid member for more regular updates and trade plans of this depth/detail.
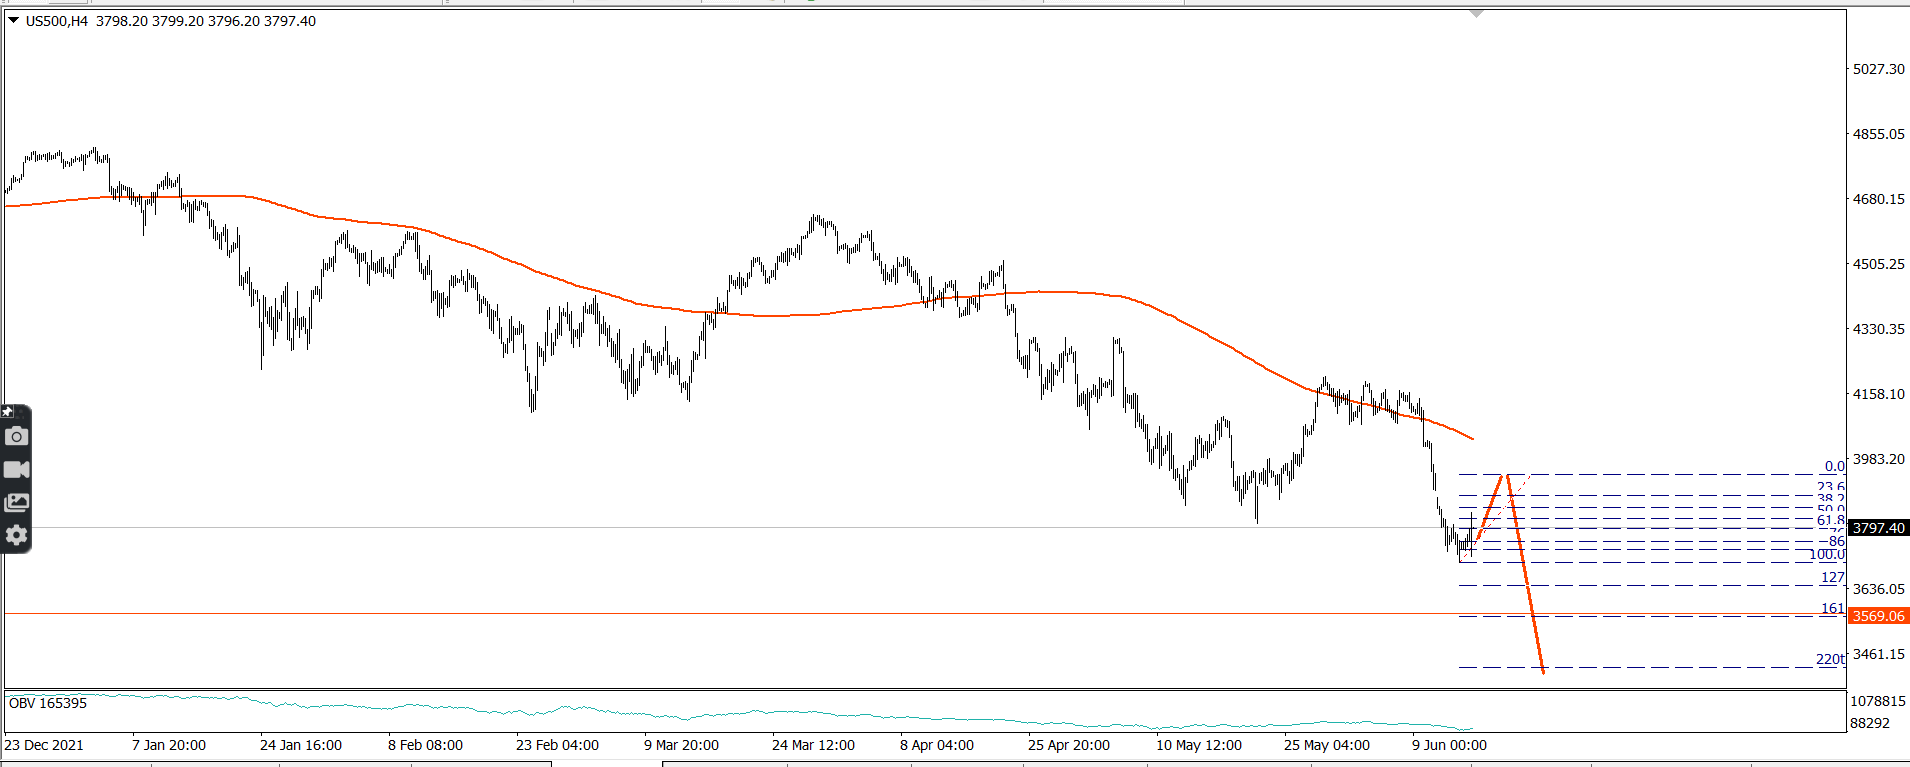
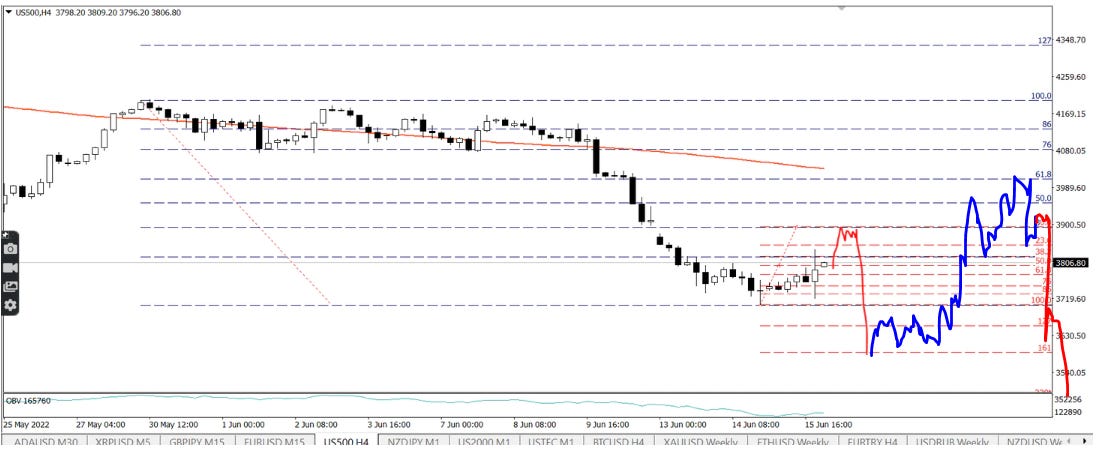
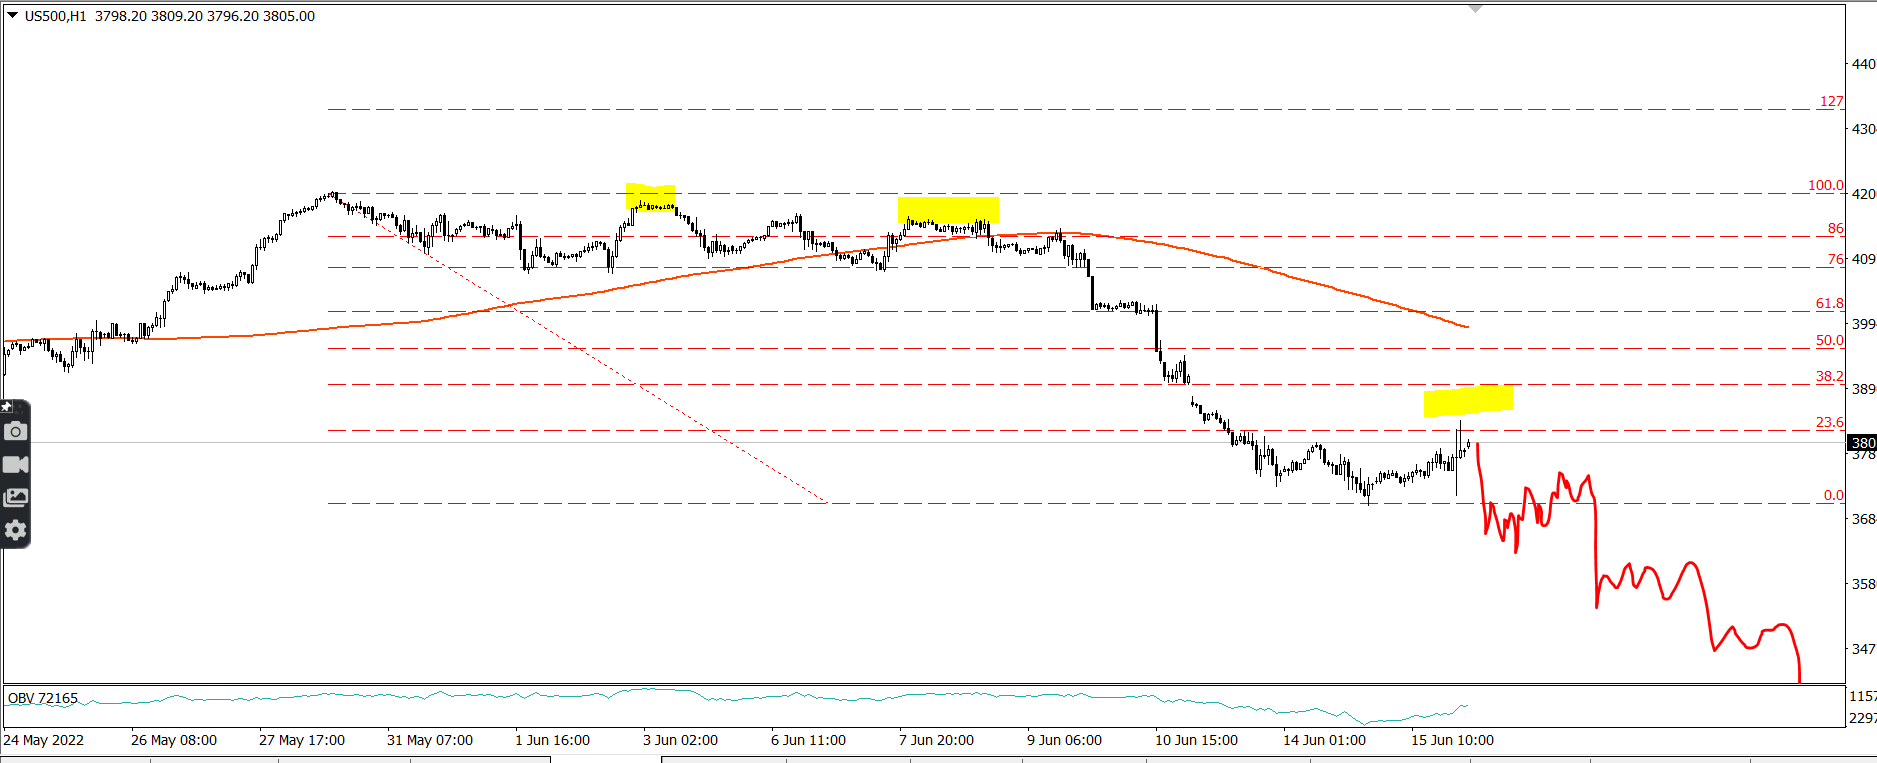
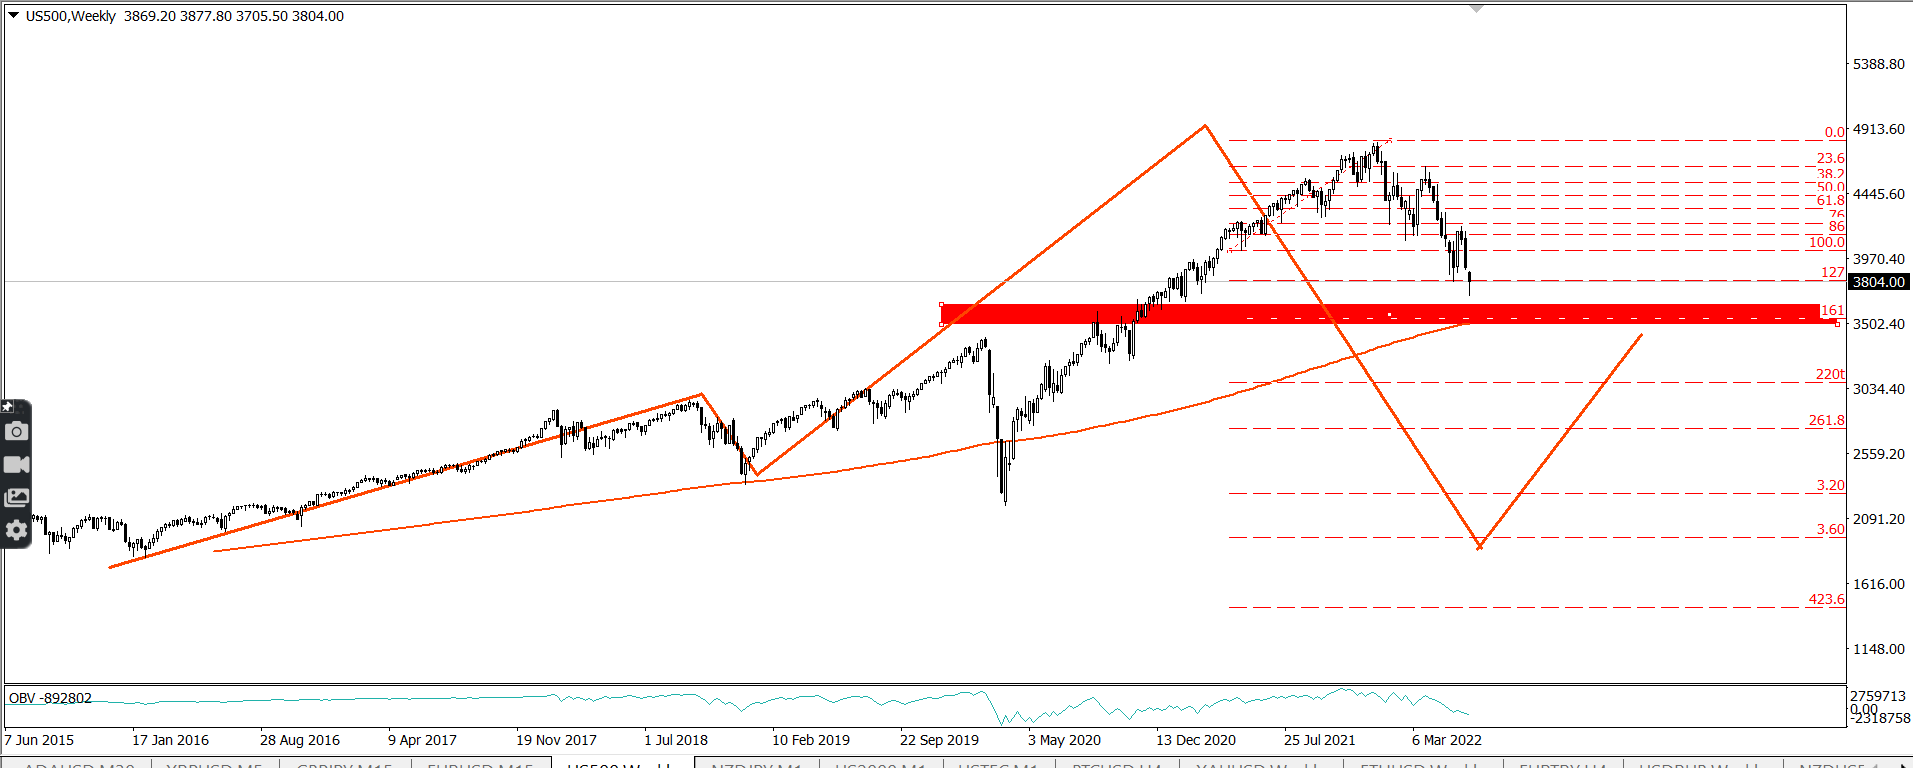
Our primary plan puts us in Elliot wave 4. Wave 4 is a choppy, tricky range during which most types of breakout strategies fail. A great quote I heard from an Elliot trade was, “You know we’re in wave 4 because all the breakout traders are grumpy”. And breakout trading has not went well recently.
Wave 4 sucks, but if you’re able to work out you’re in/just completing wave 4 brilliant things follow. Coming off wave 4 there’s typically a few huge trades and also you have a pretty good road-map for price moves you’d be expecting to see for quite some time ahead.
If we’re in wave, we’d be due to see a big spike out low after a false bull break, typically this will be a 161 extension of wave 4.
The tendency of wave 4 is to retrace to the 38 fib. I’m not sure if it’s a hard rule of Elliot or not, but any significant breaking of the 38 fib I tend to take as failed break continuation and will reverse upon a retest of this level (Tolerance for spike-outs needed).

If you can work out we’re in wave 4 around this point of it’s development and it plays out as per the fib norms, this is super awesome. We really have a set of amazing trading opportunities. This is in all instances of it happening. I’m not talking about a unique event (Although this would be big with it being indices).
If we think we’re in wave 4 we can define the following trade plan:
When we get to 38 fib, I’ll limit into small trades.
Upon seeing a rejection of this fib, I’ll add bigger trades.
Wide stops will be above 50 fib.
Adds will be just above rejection high.
Target will be 161 swing of the move to 38 fib.
Can have this plan every time you think we may be in a wave 4. Being right and it complying with the norms even just a few times is incredibly profitable.
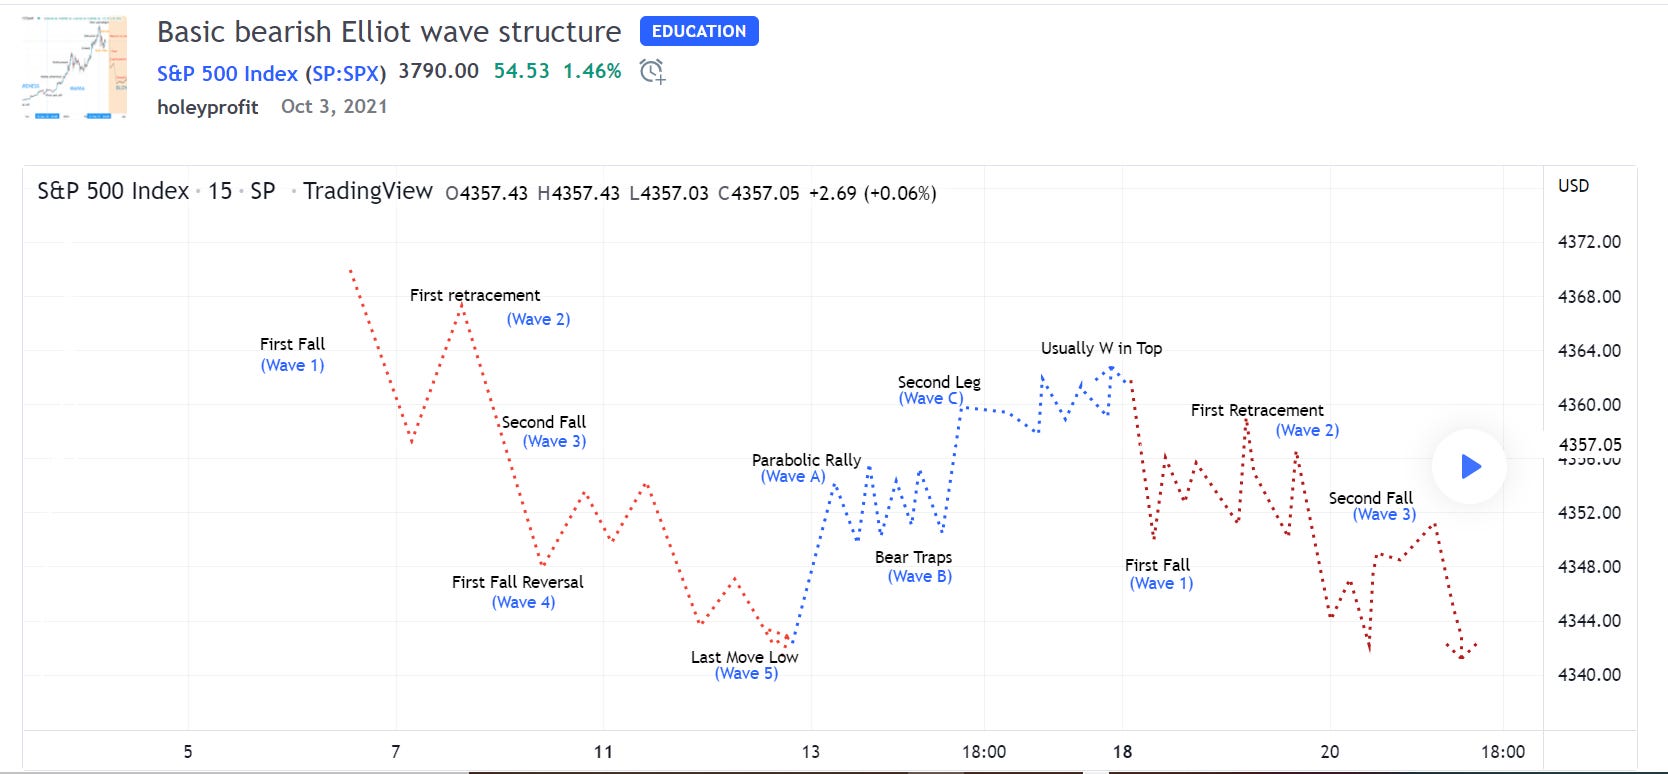
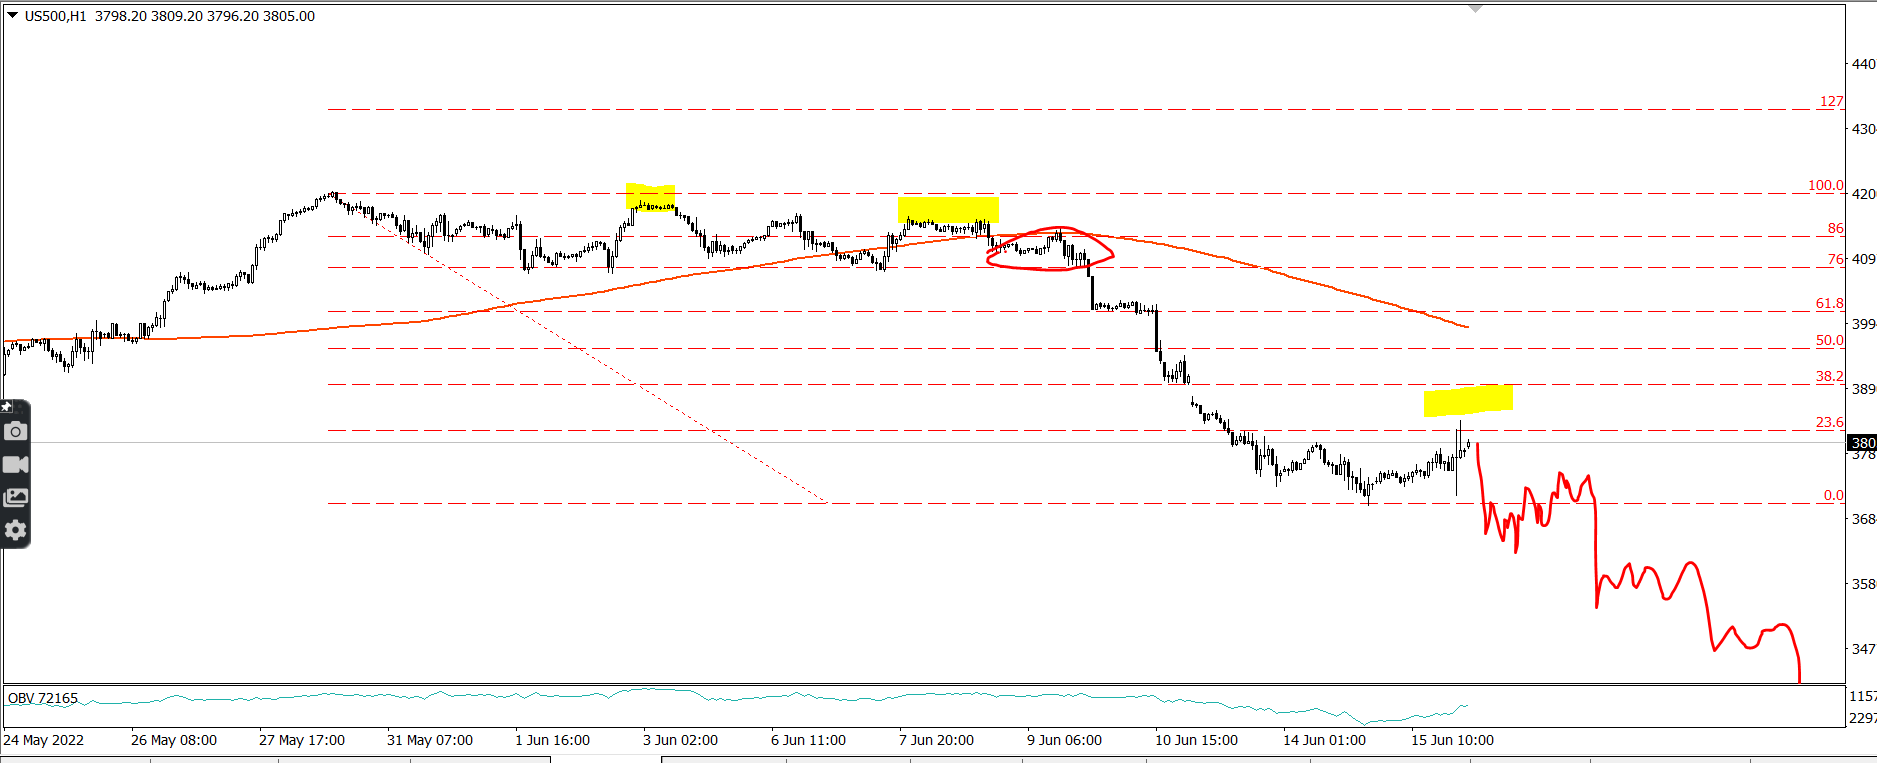
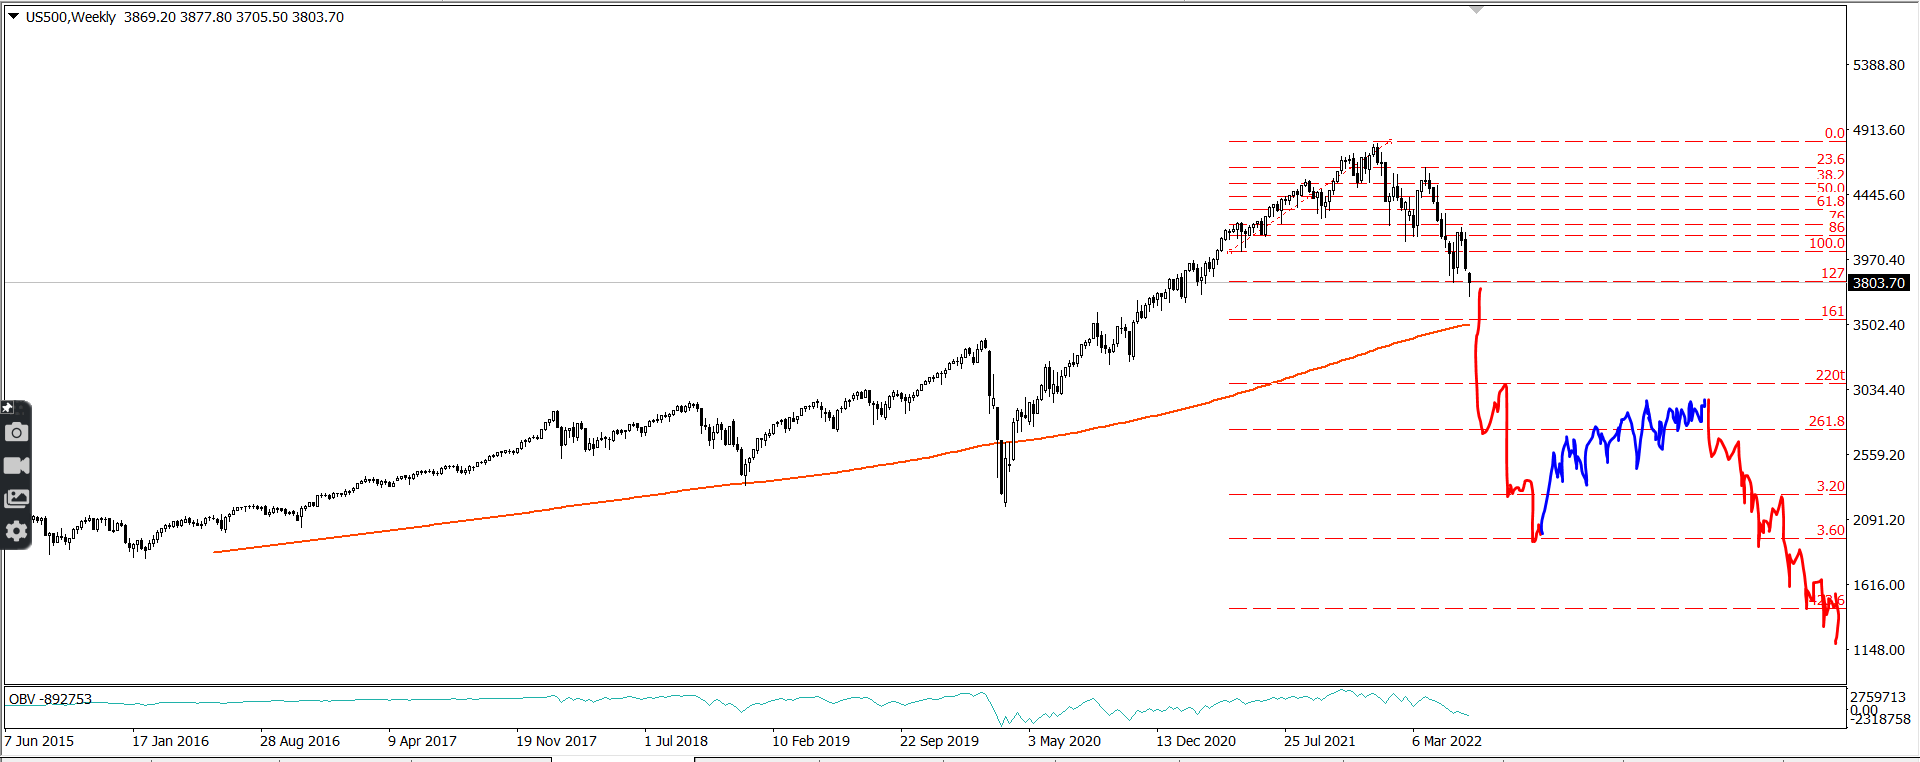
If we head into a wave 5 the best way to think of wave 5 is it is there to FOMO or stop out everyone. Wave 5 will be as compelling a move as we’ve seen in the whole trend. It’s usually off a news event. And it’s always blisteringly strong. There are no/few pull-backs during wave 5. It shoots to the 161 and stops before the 220 fib of wave 4.
There’s one okay trade and one great one. We can get long into the 38 fib (And since it’s an expected false breakout we can know if that does happen it’ll usually be strong, fast and scary. That’s the M.O of false breakouts. Pain free trade on the right side). Then one great trade into wave 5 with few pullbacks.
Next trade would be a long trade. We’d know if we seen the rejection off specifically 38 fib and then a strong, news supported a lot of the time, capitulation swing we’d want to look for supports 161 and just before 220. This would not look like a buy at the time, but we’re prepped for counter-intuitive PA into supports.
Breaking 220 usually means we’re not in wave 5 and this would be the bull exit (Usually strong bear continuation if this happens). If we buy the 161 area and the market goes parabolic, we then also know we want to be looking for places to add to our long positions into the bear traps.
I’ve taken a bit of time to explain this type of move because although it may or may not happen here, this does happen. If you look at the highs and lows of trends you’ll see this is pretty common. I’d assume it’s the underlying thing for the 161 top signal in crashes. We complete wave 5 in a mania boom, reject 161 and then enter into the two leg drop.
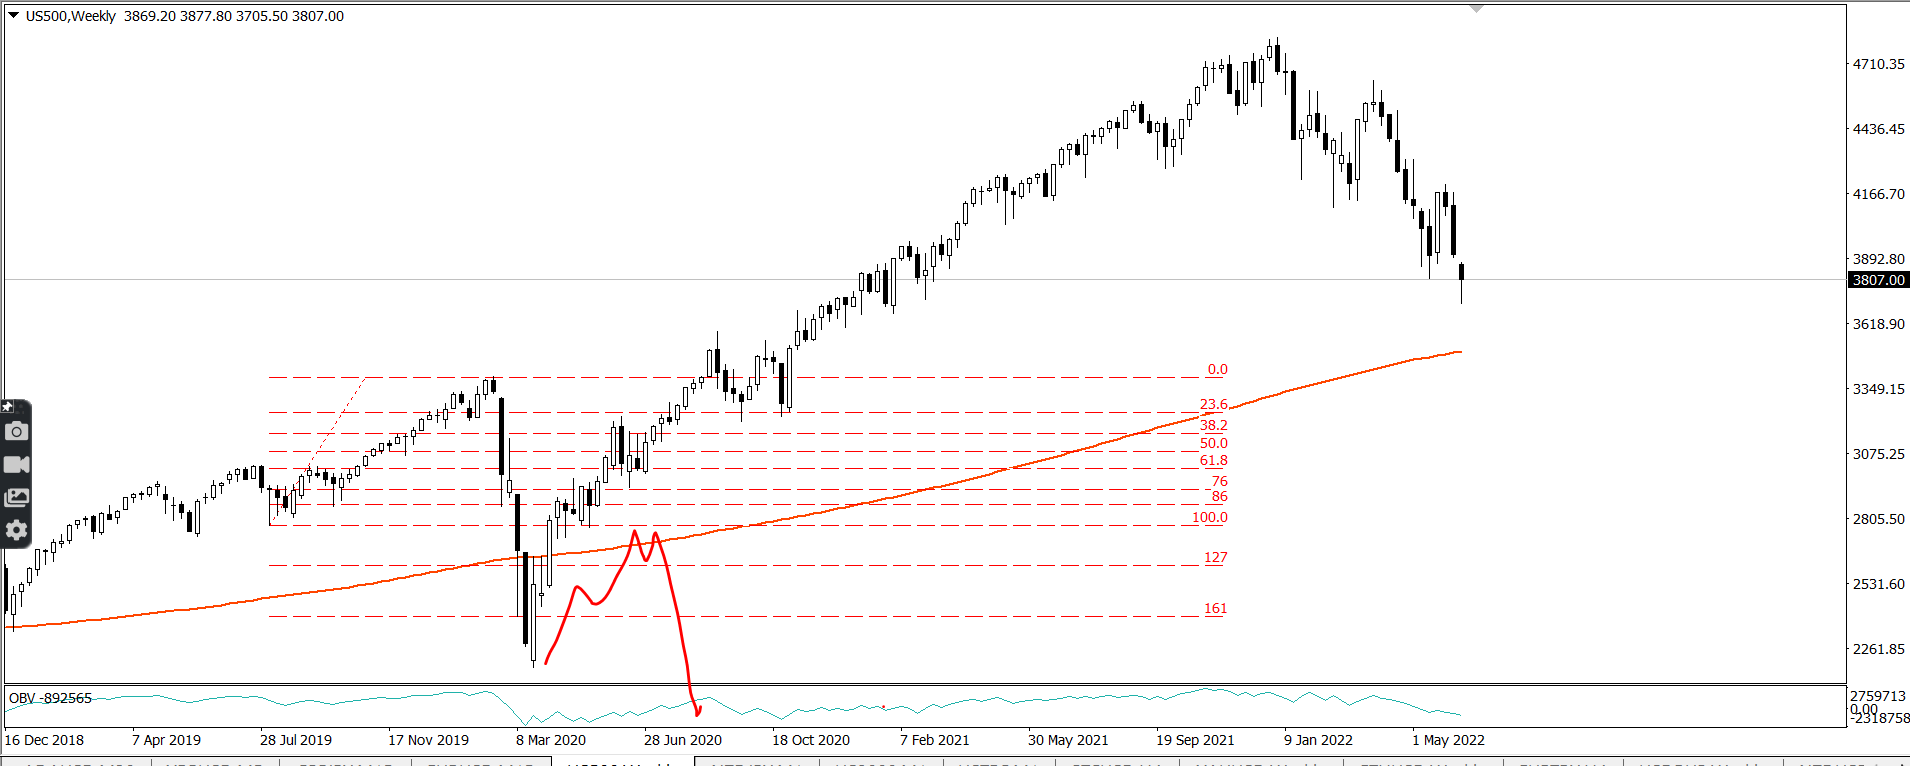
To add large context to this, I believe we may have seen waves 4 and 5 of the bull trend in SPX through 2018 - 2022.
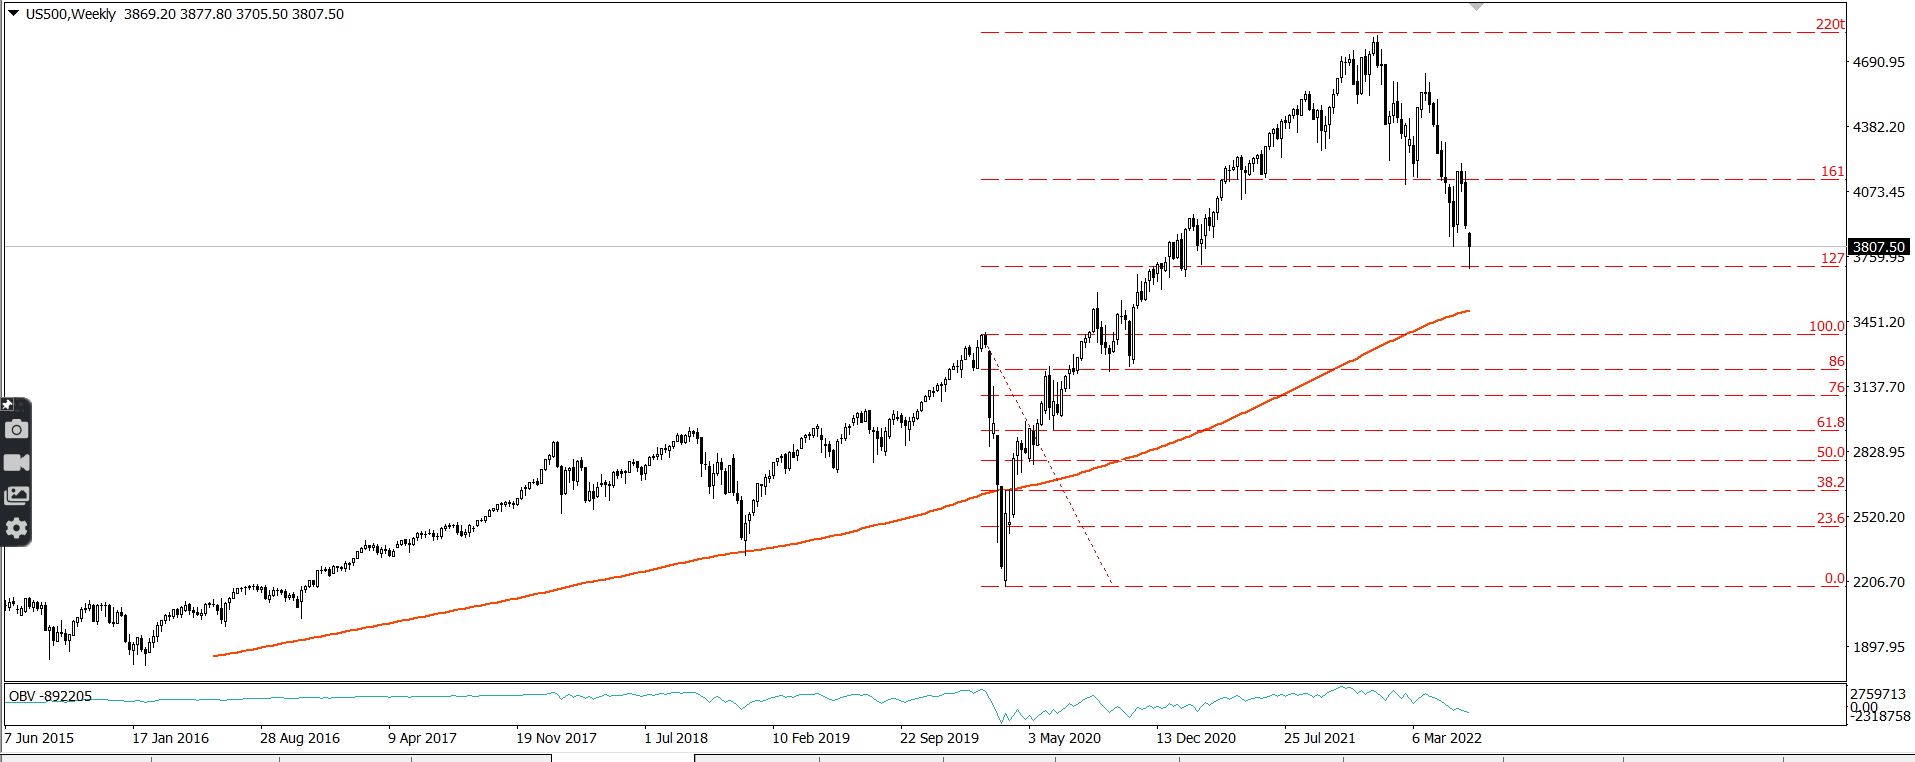
Run through the criteria: Was it a nice to be trading breakouts during 2018 - 2021? No! They got you nailed pretty consistently. Did we go into a strong trend with no pull-backs. You bet we did! Did this end before the 220? Conspicuously so. Is that a problem for bulls? May be!
If you invert the bear Elliot model you’ll see how our DJI trade plan posted in Dec 2021 was this.
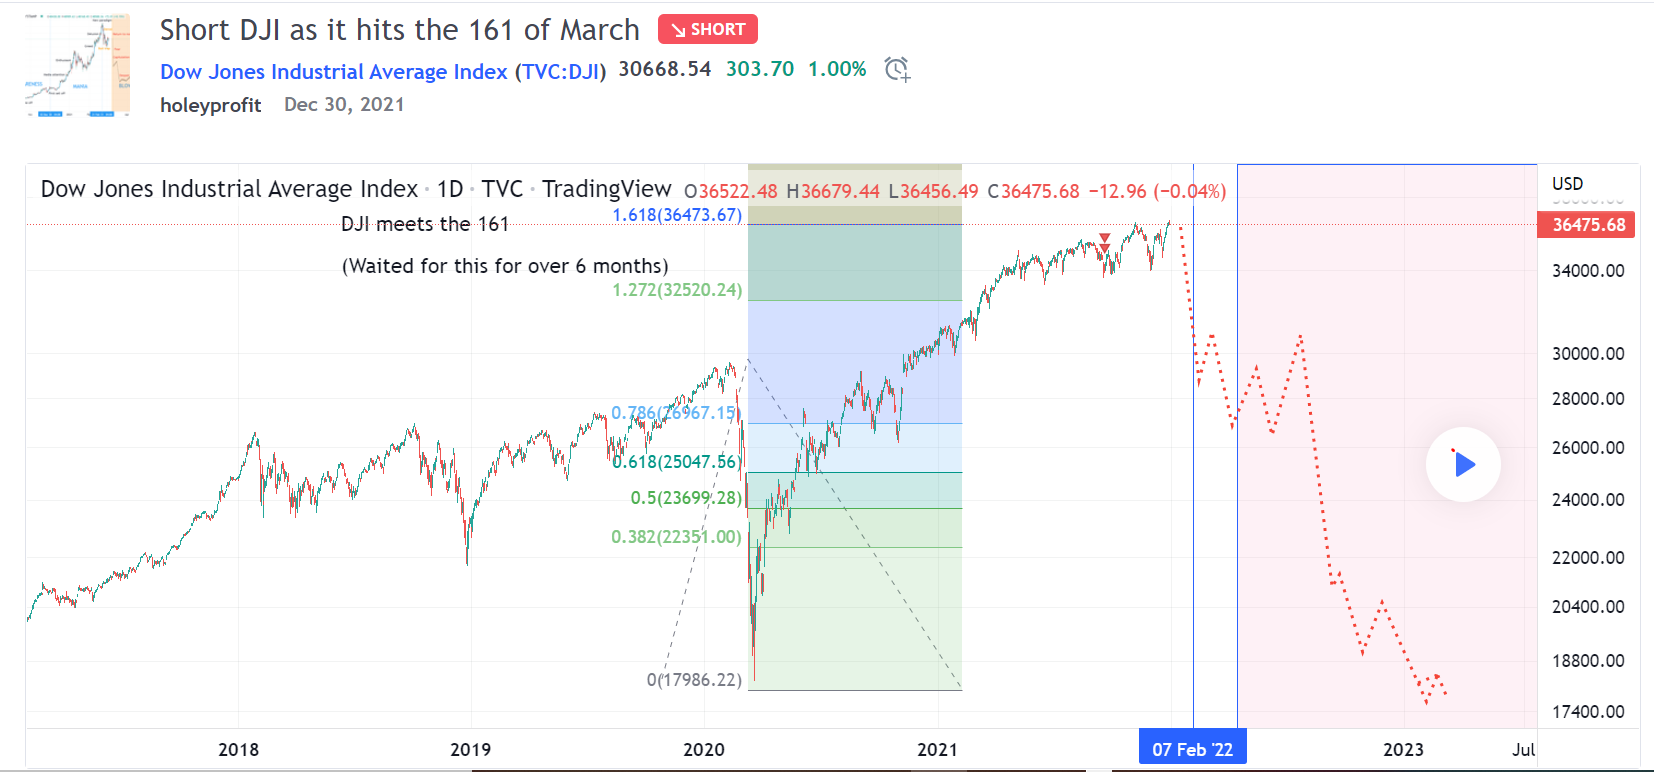
Everything about it. The high and the following swings forecast. We’re taking targets from fib extensions of wave 5 and using common norms of corrections. One squiggle on a chart looks much like another to an untrained eye, but we do aim to be pretty specific when squiggling. We take time to squiggle.
Back to now.
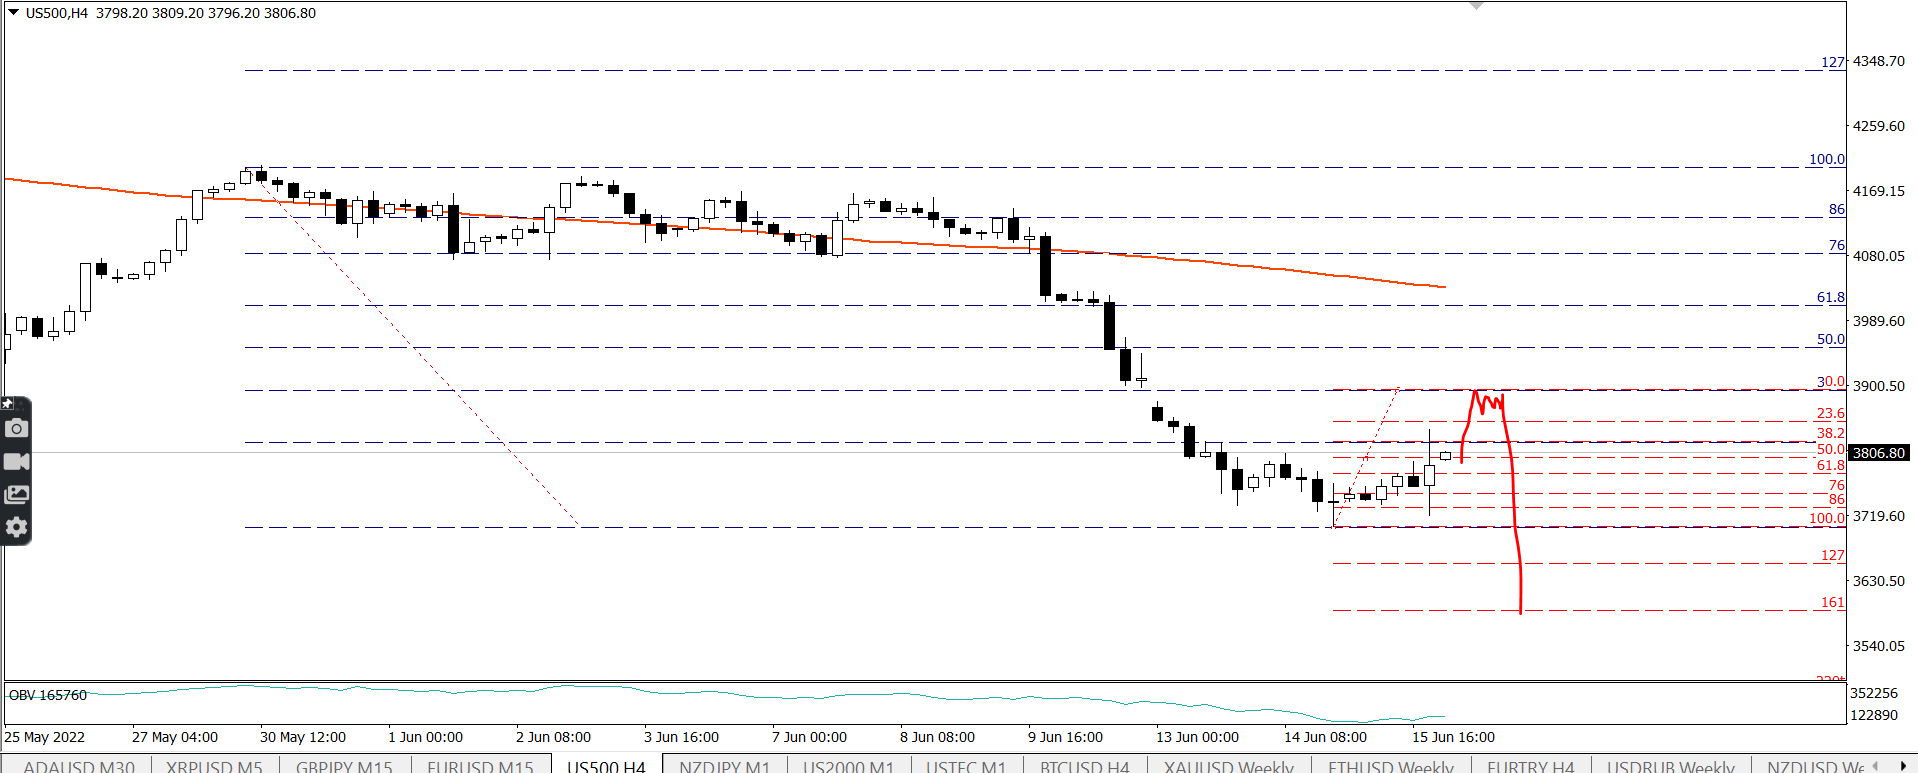
If we are in wave 4, our trade plan is easy - but only because we have it. Wave 4 into wave 5 is going to catch a lot of people out. You should see hyper bullishness into the high and even more hyper bearishness into the low. False breakouts should be in a style and fashion that drum up public attention/chatter.
This plan fails if we get above the 38 fib (And to some extent if we get under the low without hitting 38 fib, although not everything is always perfect). Upon a breaking of this (Spike tolerance needed) we’re looking to buy retests of the 38 fib and 23 fib. Then looking for price to trend up towards 76 fib.
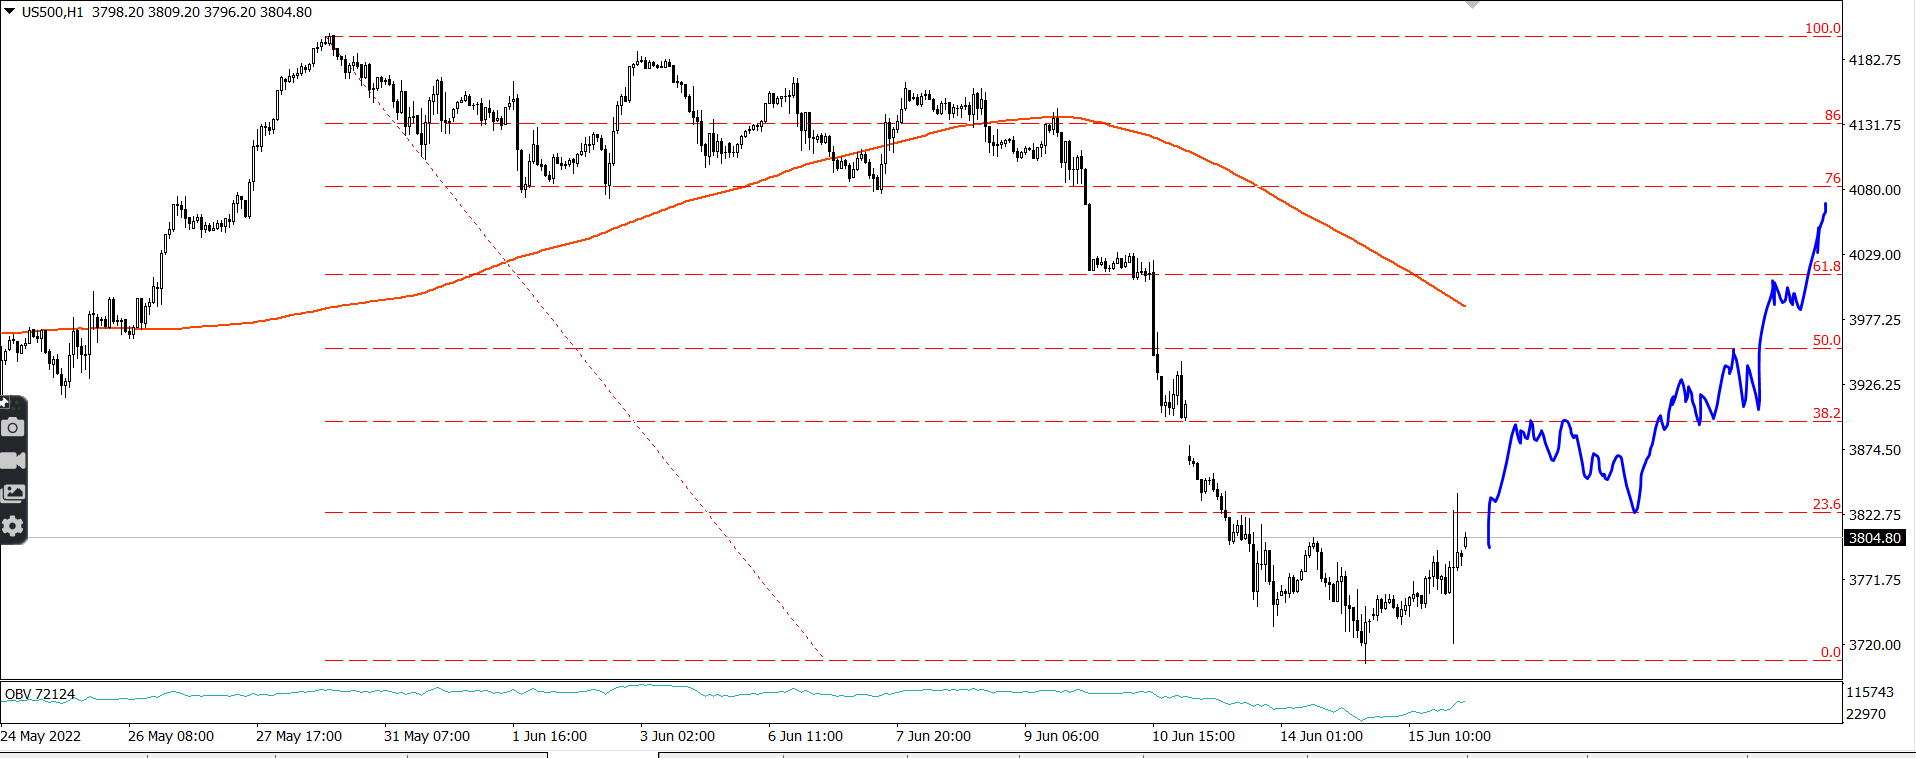
Breaking of the 38 fib and clear holding of it as a retest will put bear plans firmly on the back-burner. The tendency is much more strongly towards a bull move if this happens. The bull move is usually strong with brutal bear traps. Bears get nailed, but if you are buying dips with tight stops you get multiple high RR trades.
A bear break without a further retracement would freak me out a bit. We have enough markers in that I’d expect to see bull to at least 38. But I do get freaked out. I’ve learned often if I get a surprise in this part of the move the downtrend is strong and consistent (Read: Didn’t stop out and learned painful lessons when surprised).
If this happens, the strong and consistent move is easy to follow. It does not make big bull moves and tight stops can be used. If pretty tight stops are hitting, usually wide stops are hitting. But if you’re getting away with tight stops you can run trades for very sizable profits.
This one’s going to be a “Take that as it comes” but we’ll be using very simple trend continuation strategies. The widest stop on this would be above the high. We’d be making bets that were conditional in us having completed the highlighted areas - no new high should be made, or we’re wrong.
Sell stop orders can be placed for this. They’d catch momentum breakouts. Stops would be above the high. Here we’re essentially trying to catch one of the style of breakouts shown in red. These are quite rare - but as I said, if we break lows without further retracement I’d be surprised. Common things do not surprise me.
The macro
When I made my first crash forecasts in 2019 and then incorrectly into the retracement levels of 2020 I used a lot of sensationalism. I thought this would be the most effective way to get attention and warn people. When I read over my work later I seen it was not the right decision.
I’ve made a very big effort this time around to avoid this. Forecast large moves with the required caveats of what I’d expect to see if I was wrong and at times use softening language. I’ve learned never to speak in absolutes, because I’ve been absolutely wrong before.
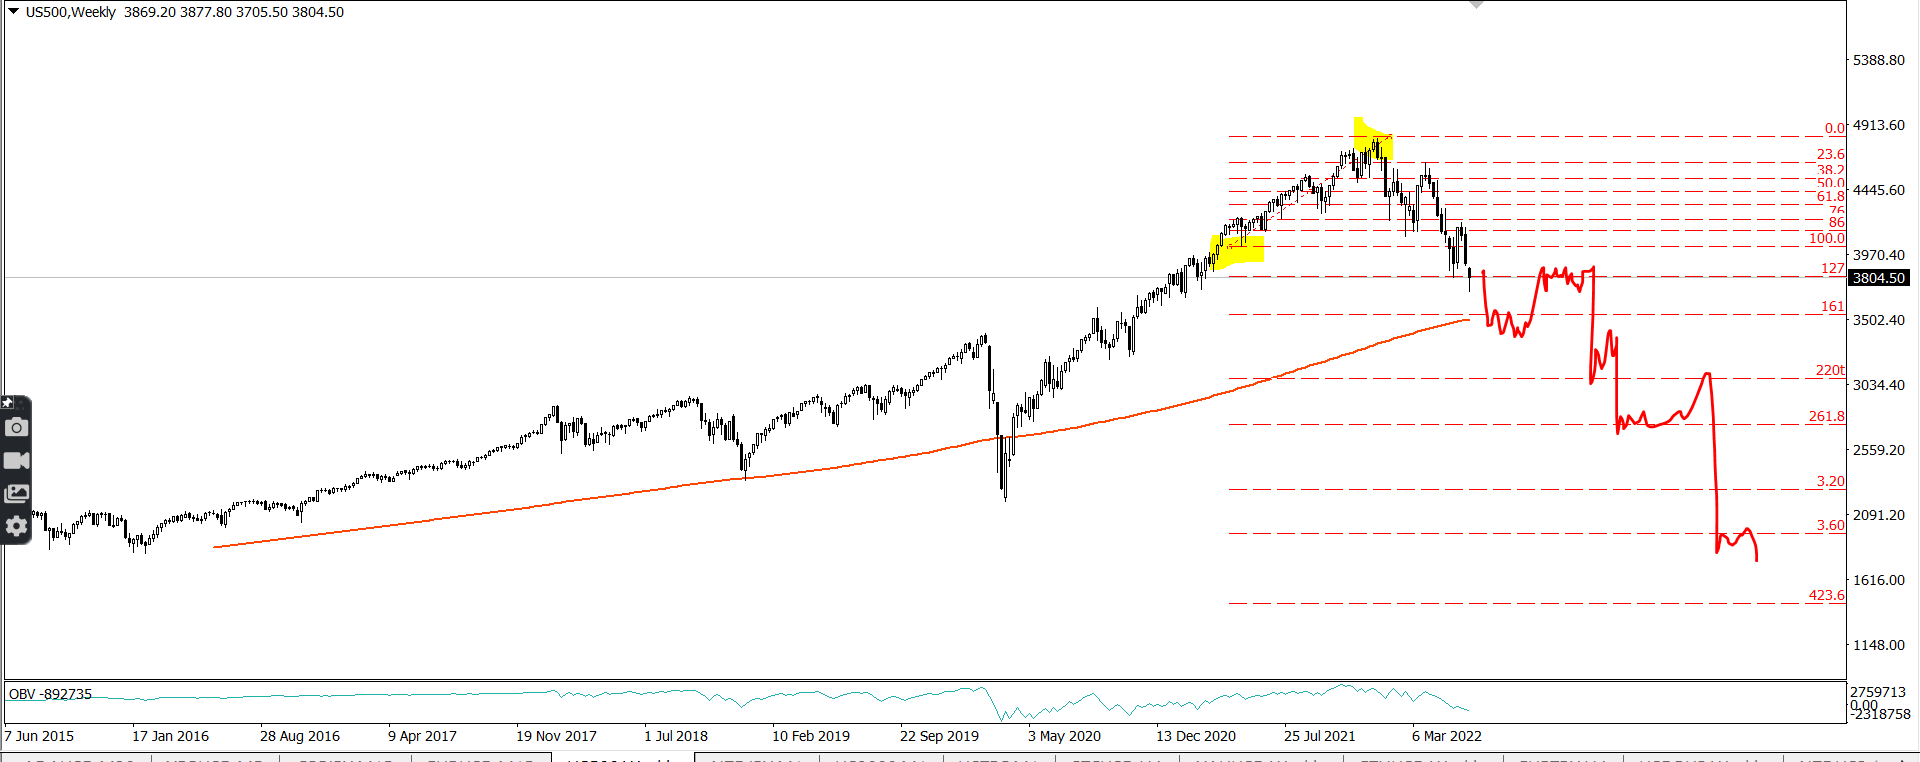
With that framing, I want to tell you I think a devastating market crash now seem very probable. Like, unless these models just don’t work and it all just breaks down - it’s going to happen. We’ve hit a terrifying amount of the markets and we’ve triggered the capitulation signal.
In 2020 I was wrong about the second drop. I’d assumed the 161 break and I thought we’d see the bull move failing on the fibs. Breaking the 161 with a strong capitulation fall and we’d then be in the crash. This did not happen - A drop of 20 - 30% and breaking of the 161 failed. Capitulation signal did not trigger.
The 2020 drop was a big false signal but it did not trigger the capitulation signal. That failed to form and the crash did not happen.
In 2022 the capitulation warning HAS HIT.
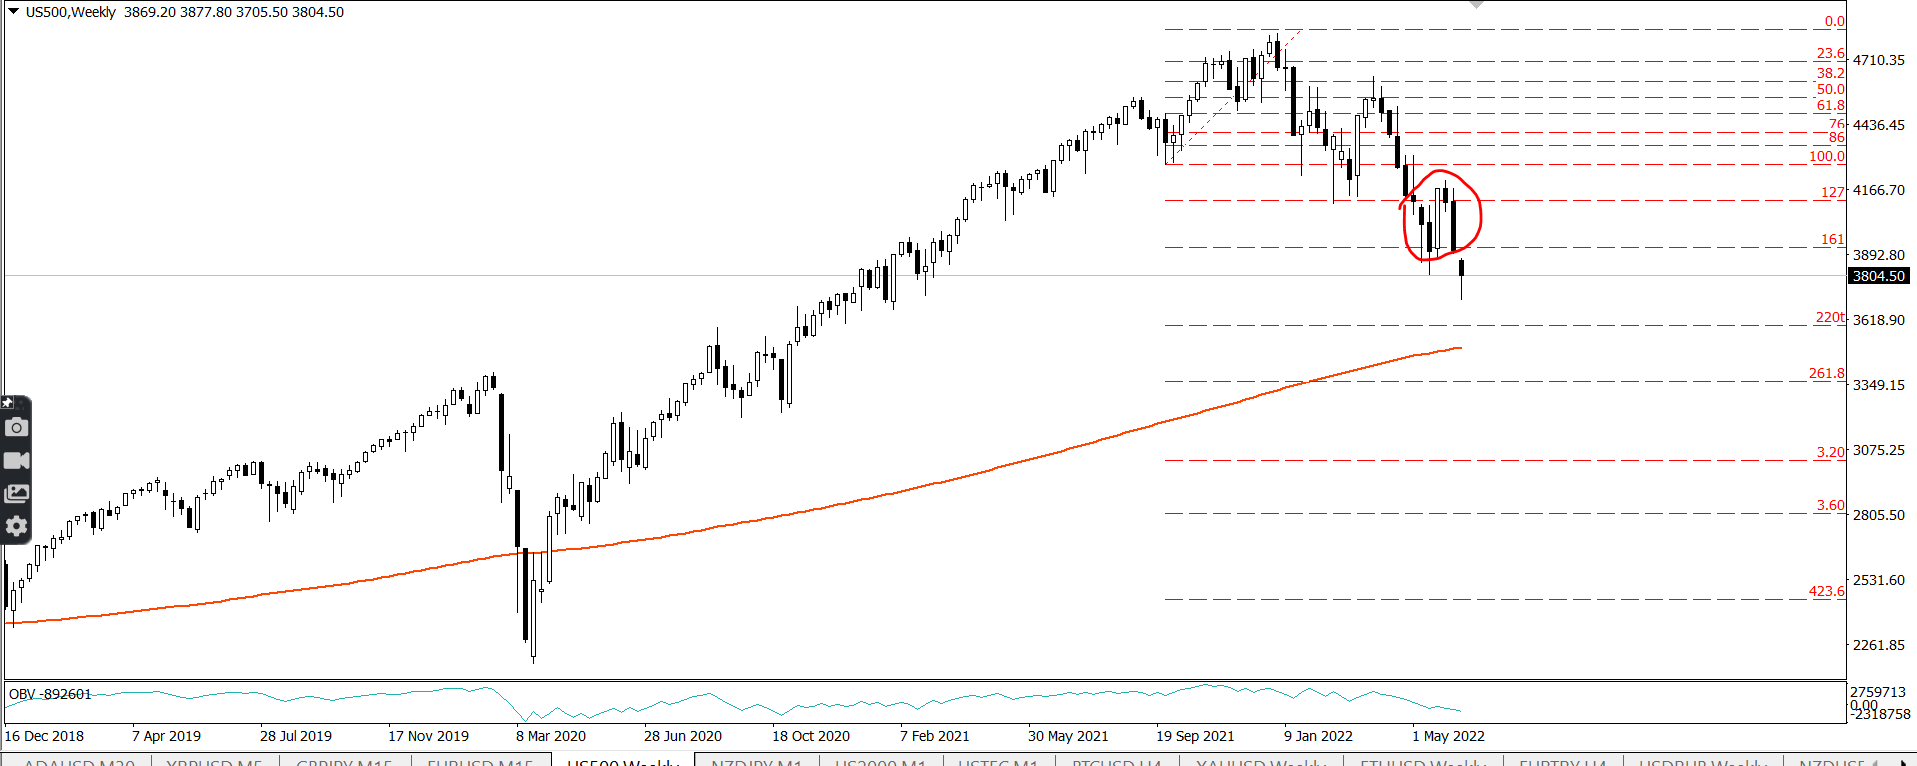
It did happen this time.
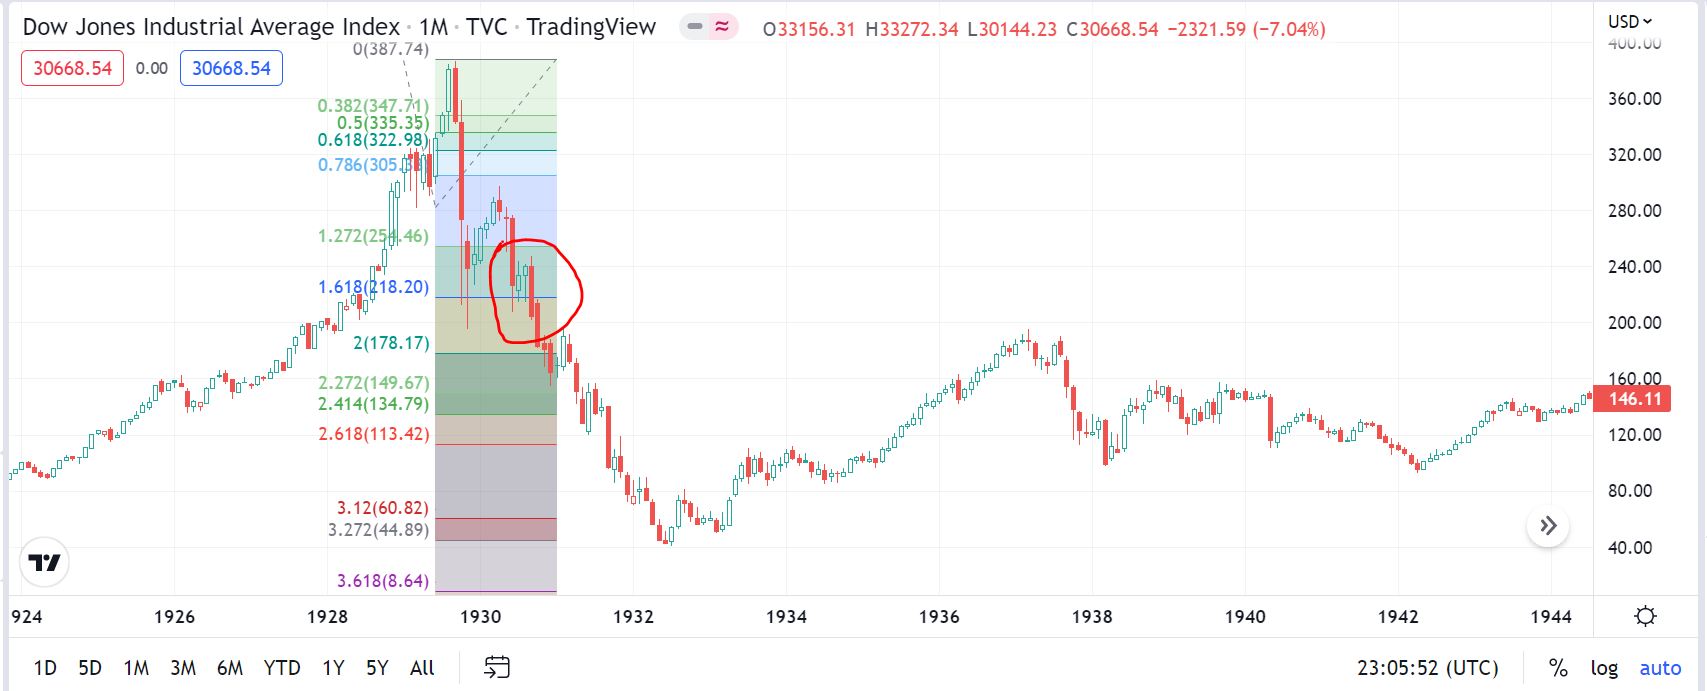
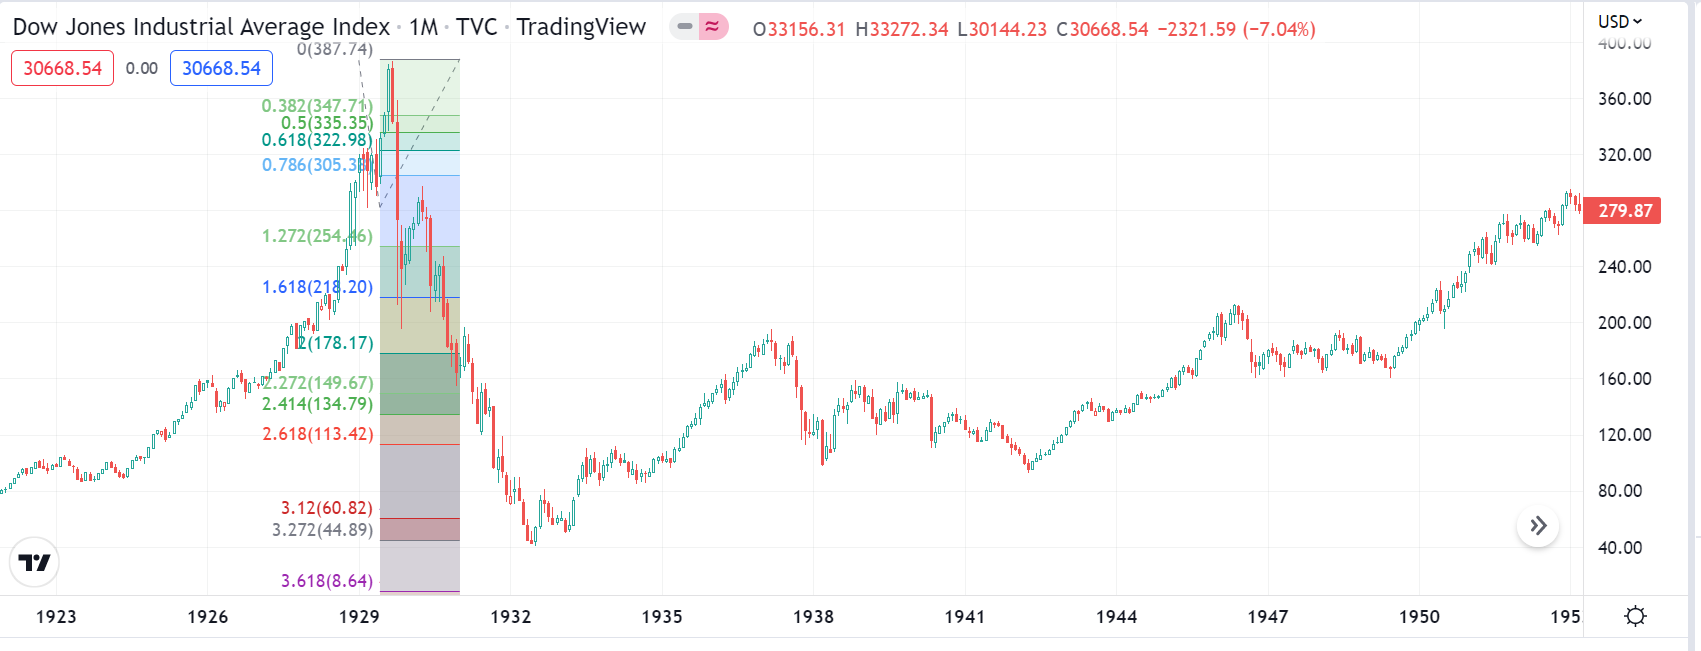
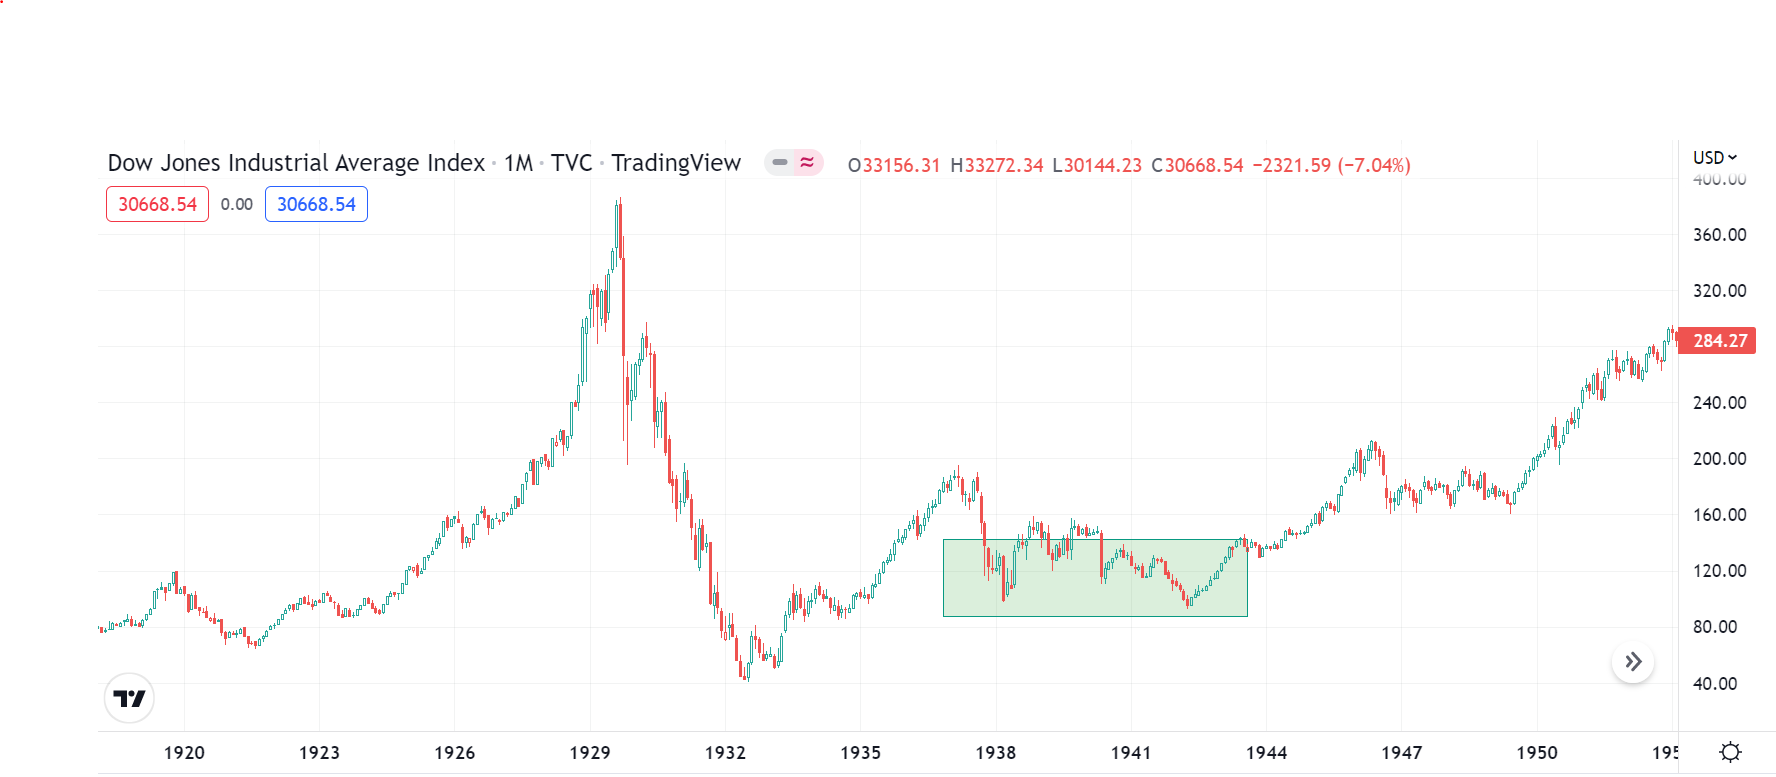
Here’s the DJI 1929 break.
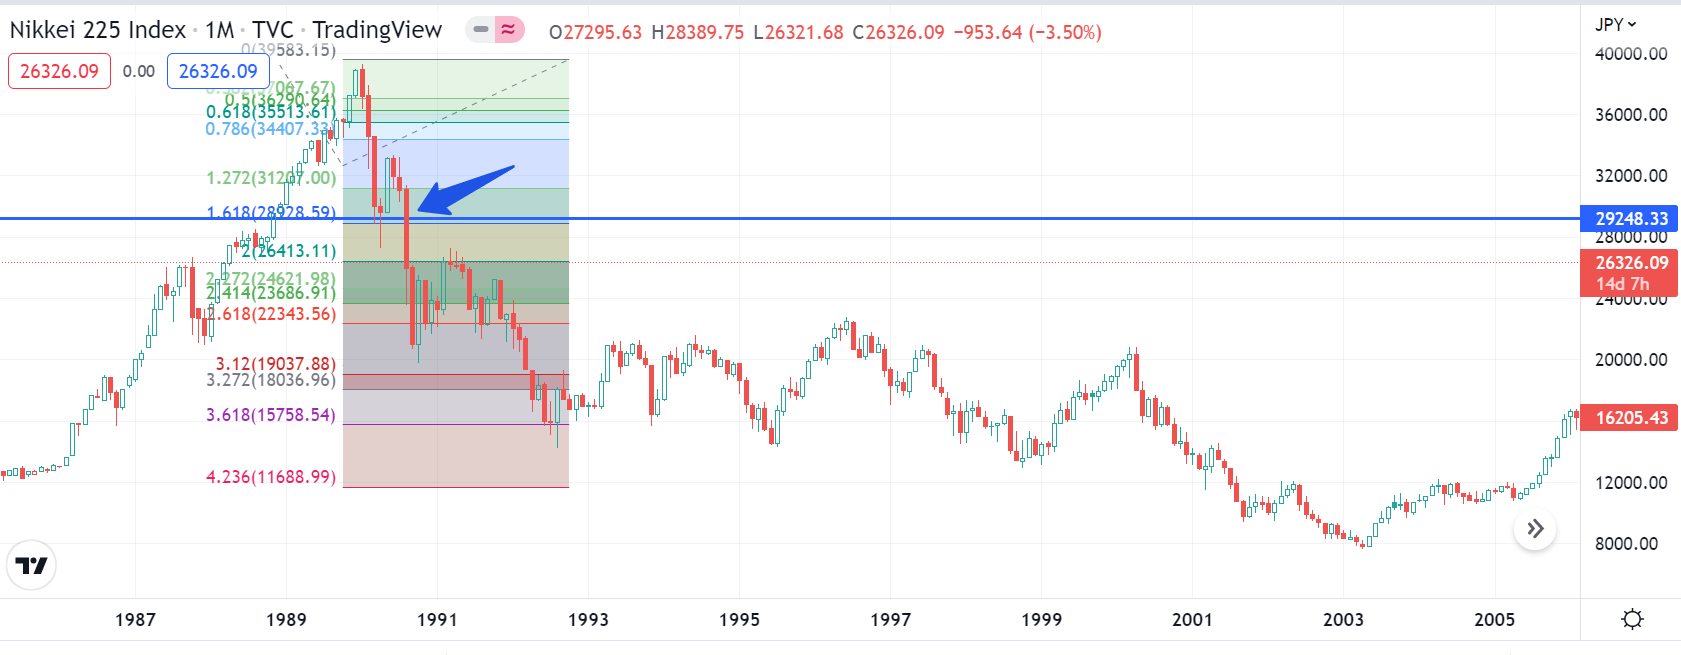
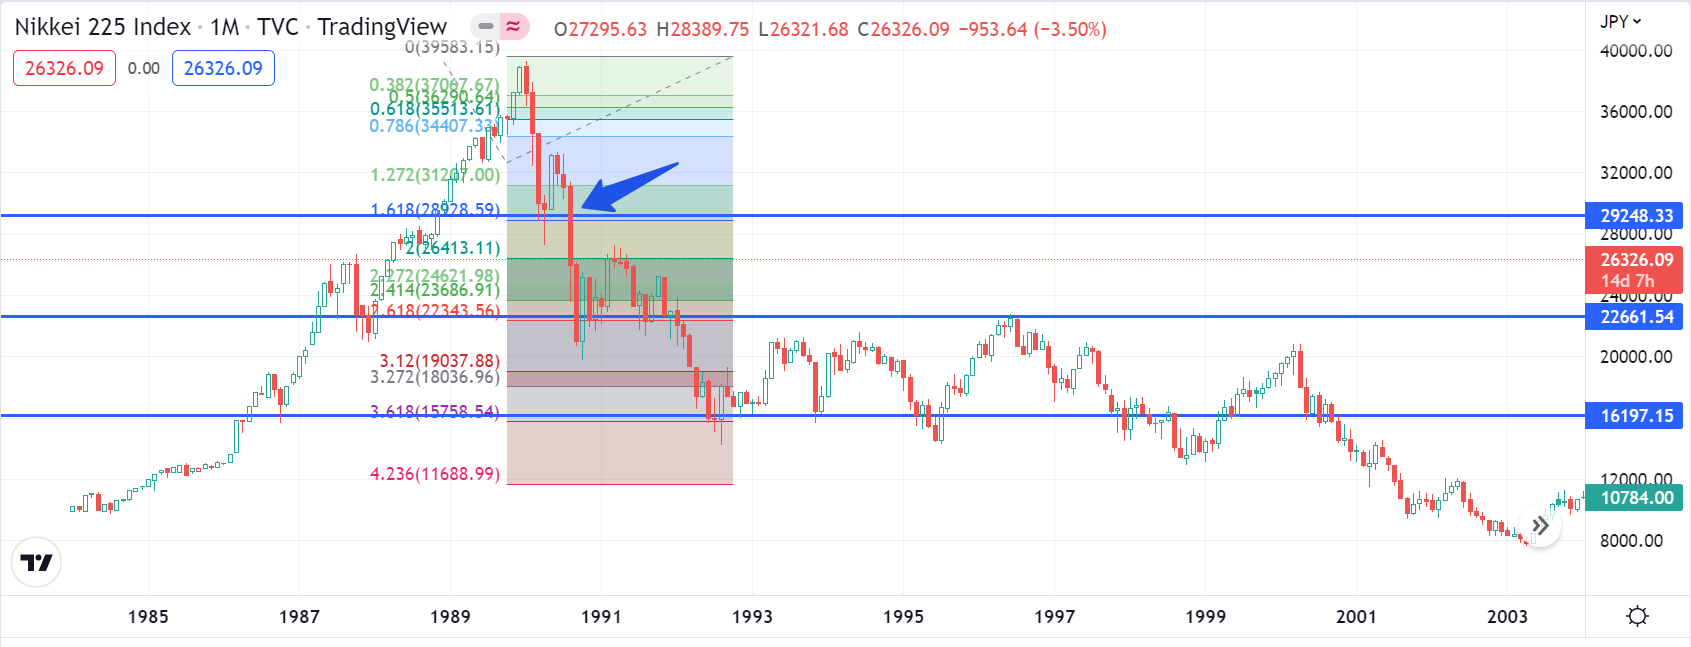
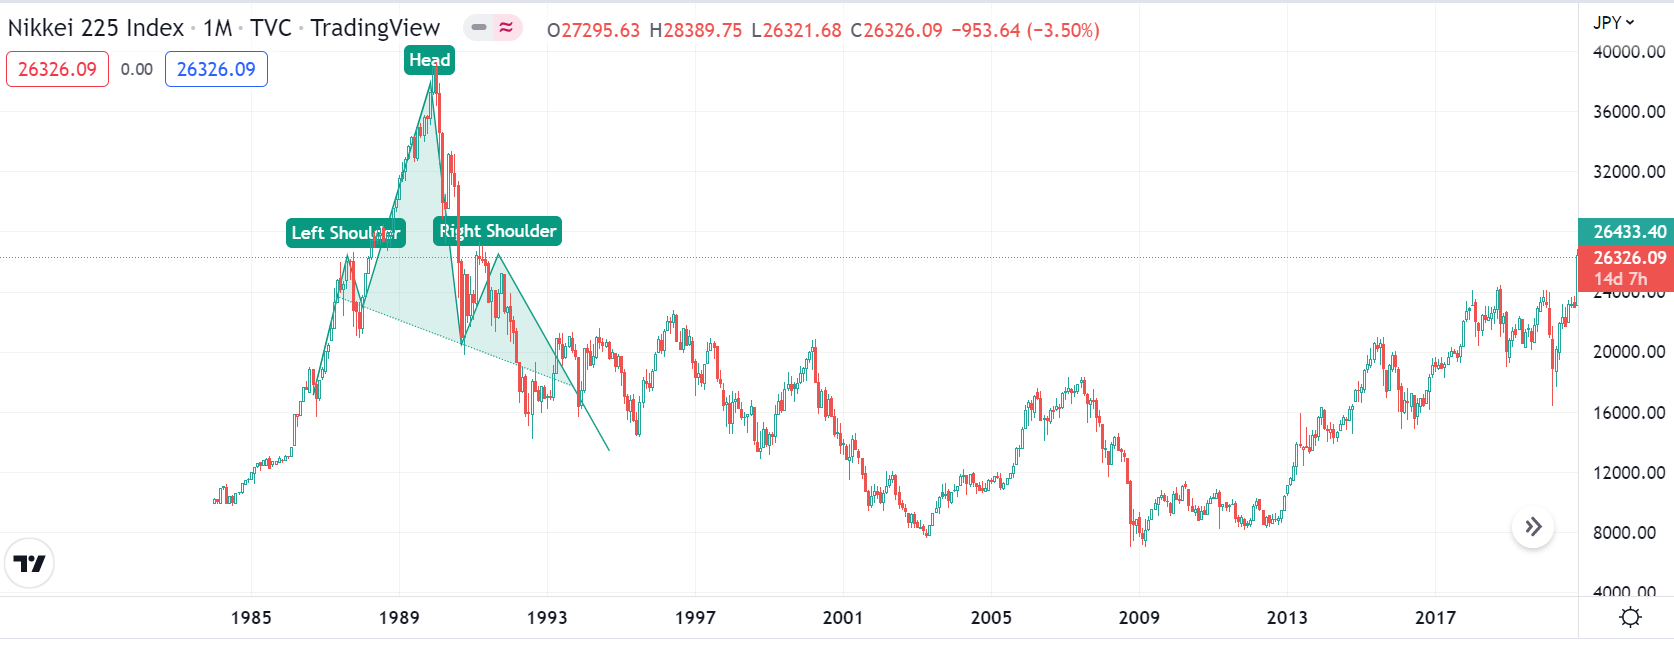
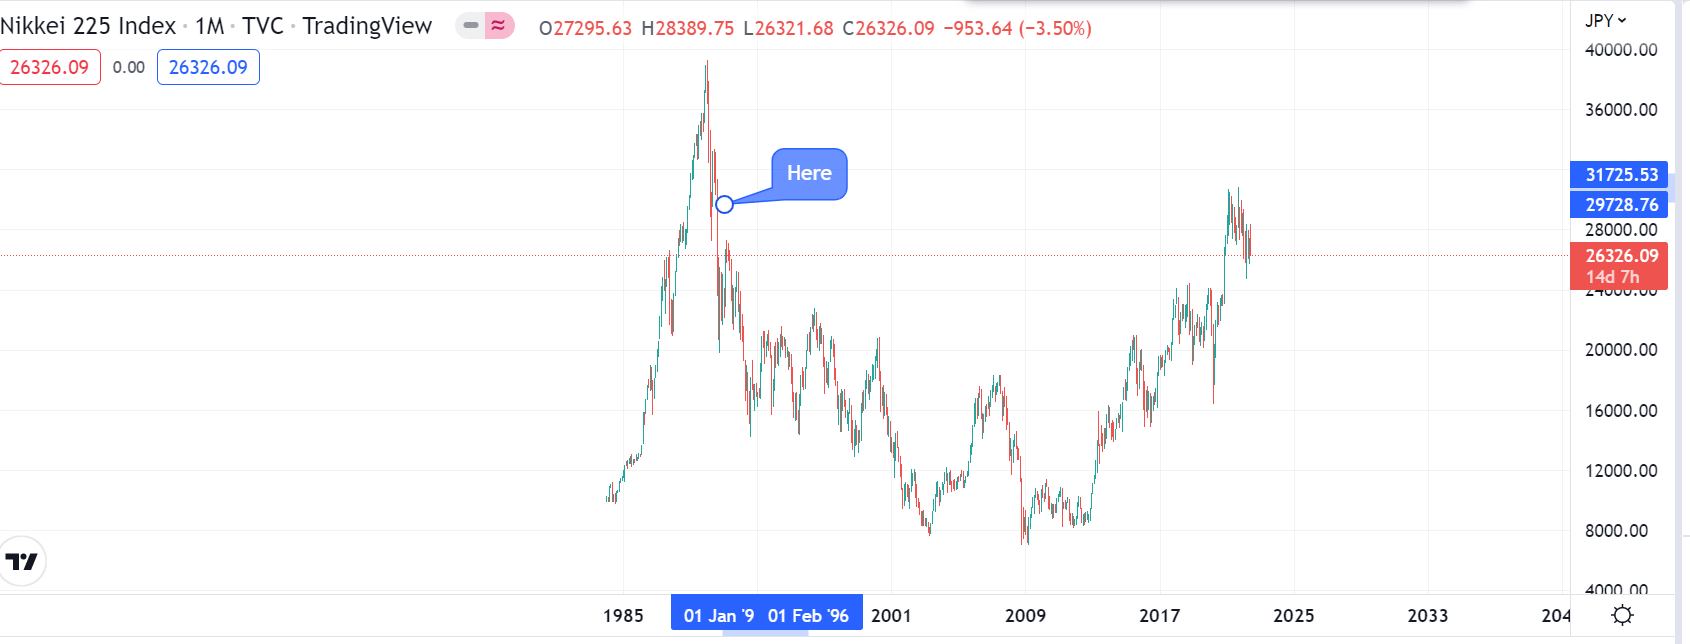
Japan 1990.
These:
Hit 161 of topping swing.
Big strong bull candle to over 127.
Super strong bear break candle though 161.
The worst part of the crash begins.
Now, seriously guy …. WTF!
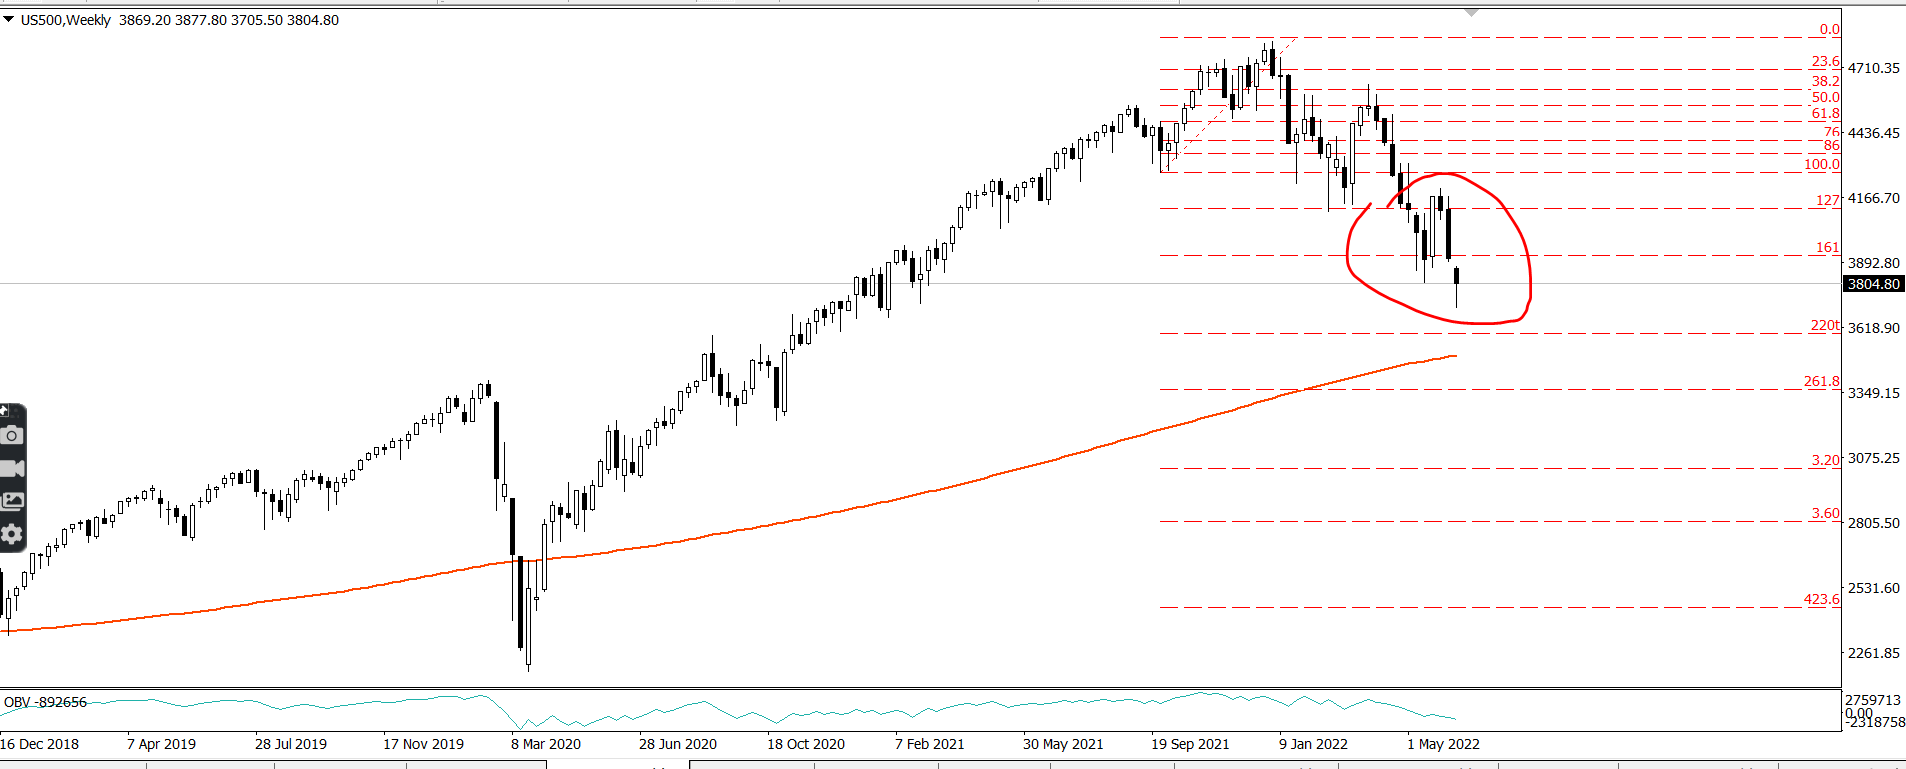
I can not predict the future, but I can very confidently and competently tell you what happen in the immediate action before major crashes became major crashes. And they looked like this! Furthermore, I propose if I am right I should be able to make uncannily accurate forecast before the fact of unusual moves:
If we continue to develop this trend as per the norms we’re currently complying with the following targets are going to 261 and then at least 320-360.
That’s about another third off the current price.
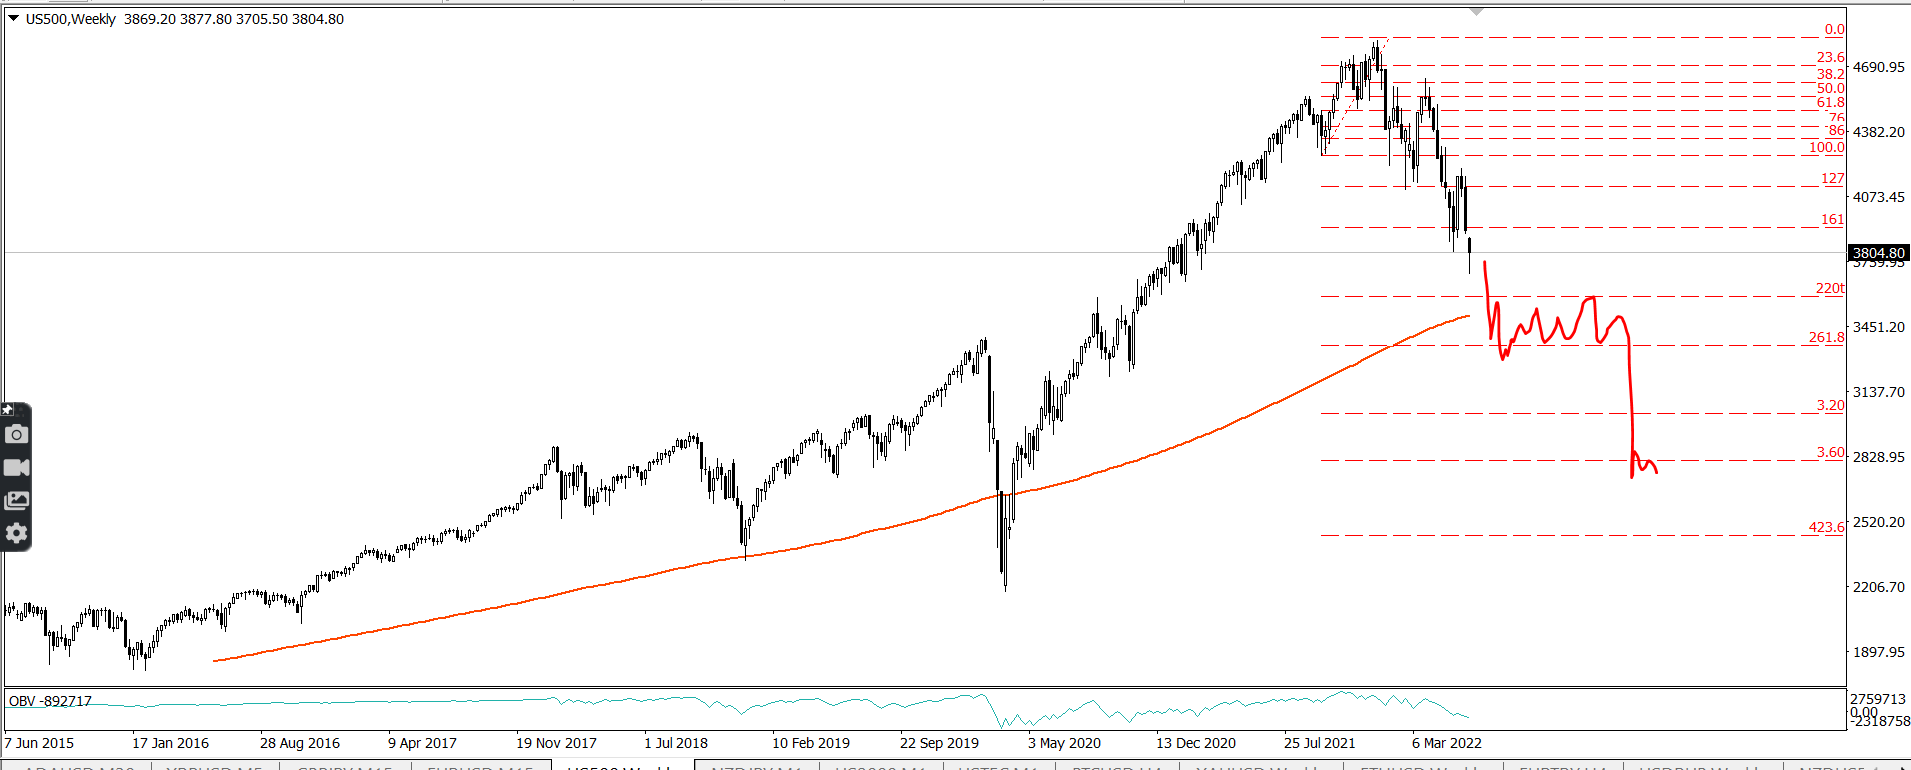
This would not be bad. It’d just be the bullish leg up taking a 76 correction. This happens in uptrends. The much more worrying thing is if we make this swing and it does not become a 76 low for simple bull continuation, we’re triggering a much bigger 161 trade. And that one would take the market down under March 2020 lows.
The problem with these models is not the 50% crash. A 50% crash would not warrant posts such as, “Playing with FIRE”. The highly under-considered risk is in the DJI and Niekki these 50% drop started the crash. It held a retest of the 161 and then dropped about 75% from thre bull trap high.
The implied swings in SPX would make a giant head and shoulders.
The initial crash in Japan was under a year to complete - but the following bear market was 13 years before it made a low.
The DJI crash of 1929 happened within a month or so, but the low took three years to be made.
The drop from the high has been about 6 months at time of writing. A secondary downtrend here typically takes at least ten times as long as the crash. If we call it a soft five and the whole crash happened tomorrow, we’d be looking at at least 2.5 years. Using realistic metrics, we’d be looking at no less than eight years.
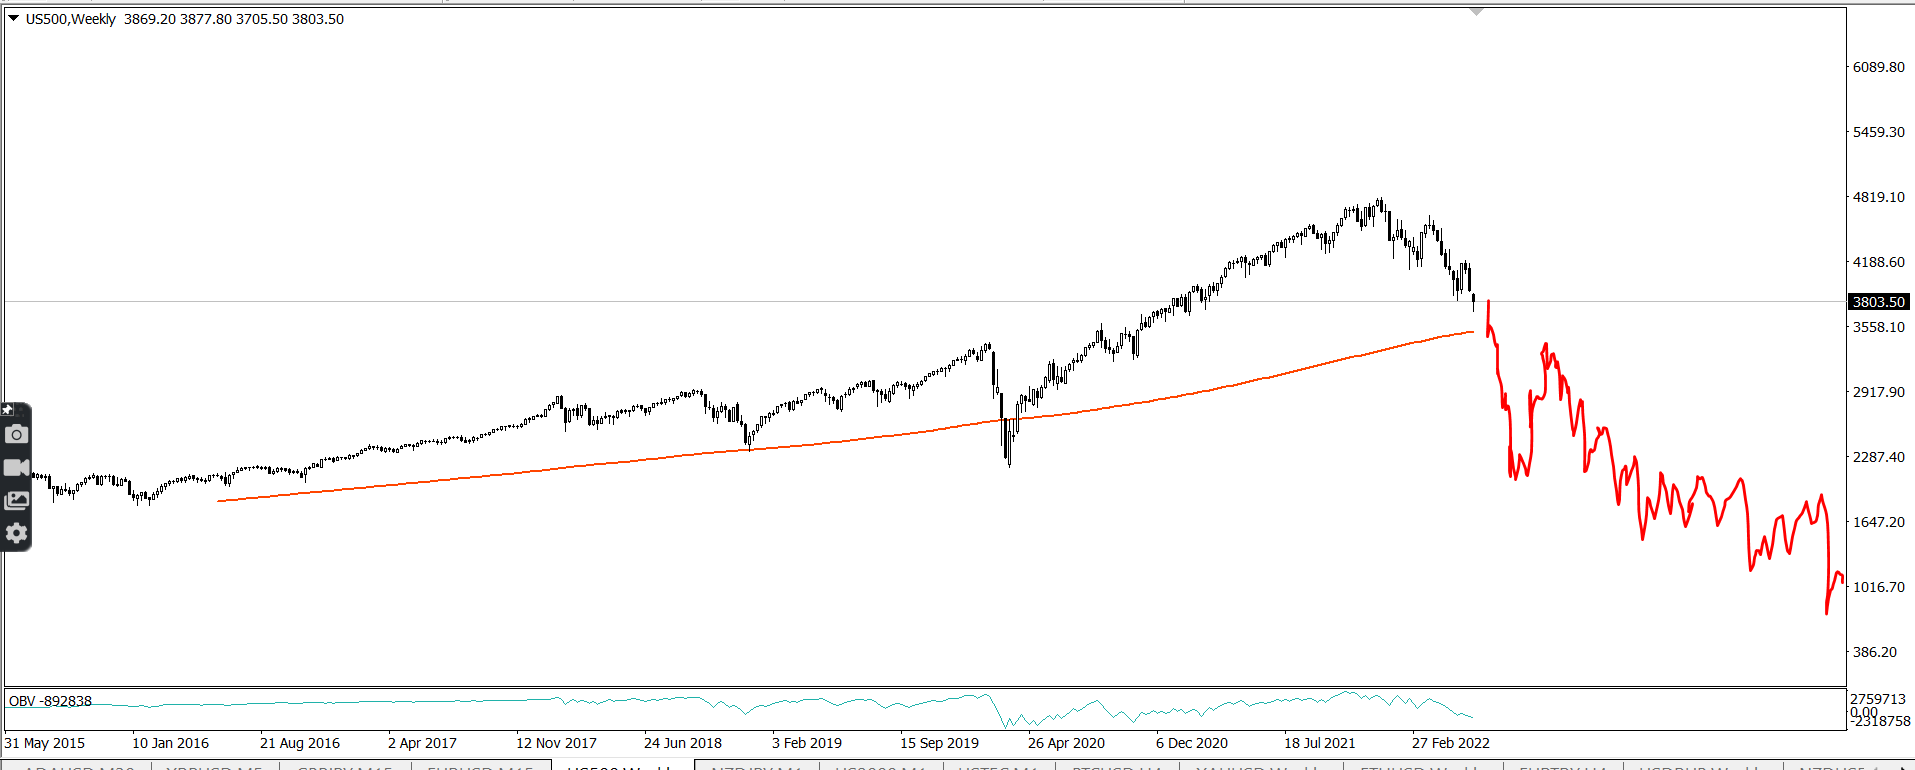
If markers continue to hit and then they continue to produce the implied following swing, this is what is coming. It would be nothing less than the end of the US bull. We’d see US bear markets for a sizable chunk of most of our respective investing lifetimes.
We’d be very early into it. Not near the end.
These charting cycles would be implying the end of the US bull and potentially the re-emergence of the Japan bull after the next drop. Japan may be around here.
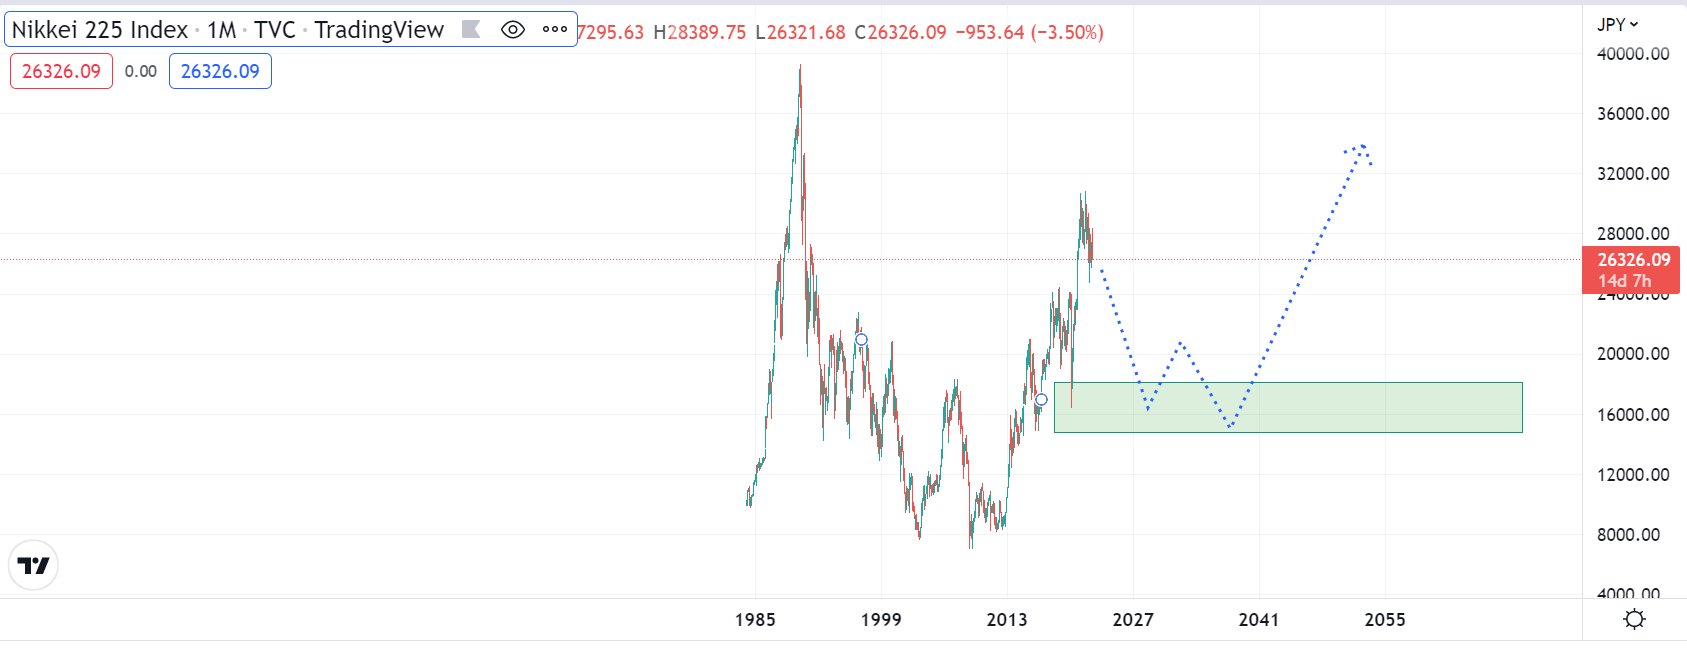
Here’s what happened in the US after that spot.
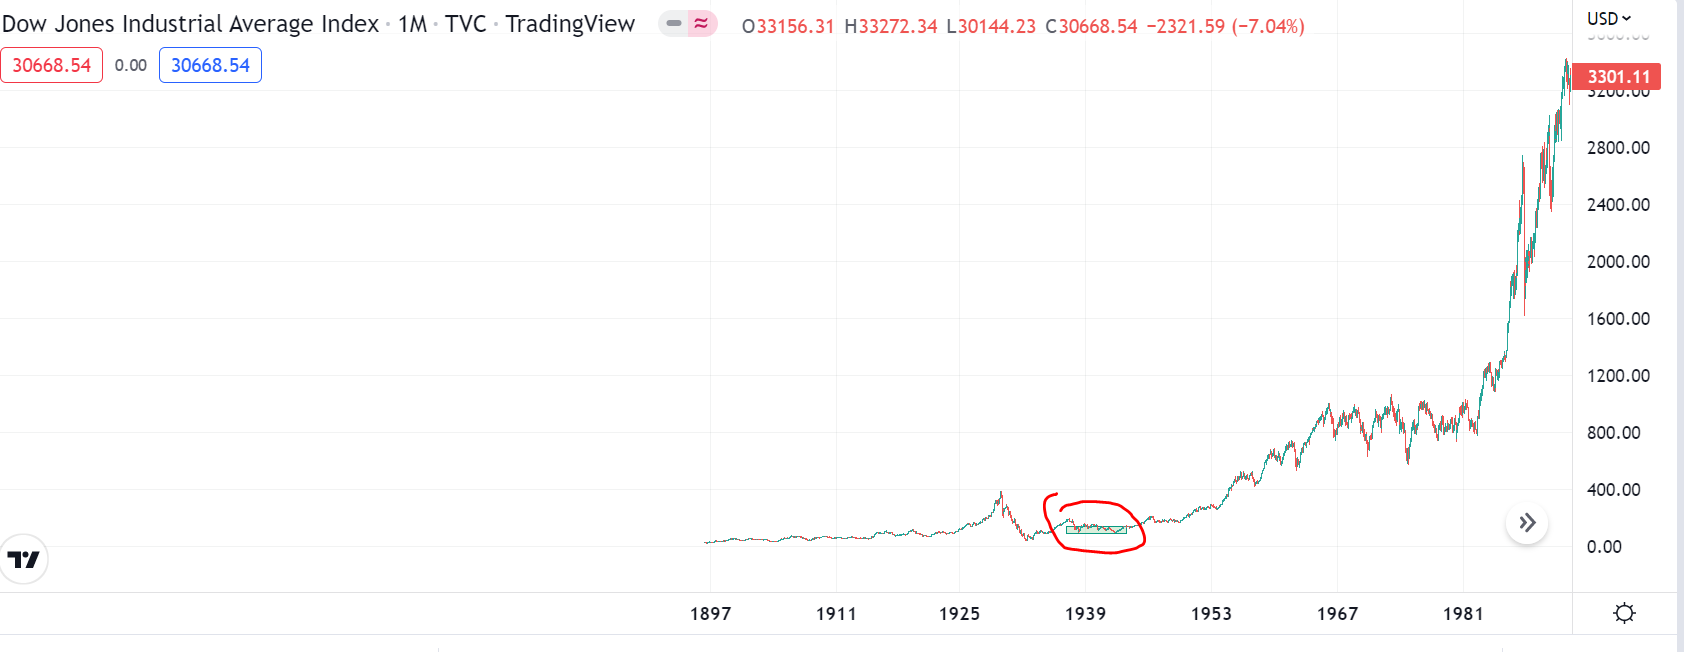
The coming to pass of these two respective charting cycle forecasts would be implying a switch in the market leader from the US to Asia. We’d really be talking about the end of the US as the headliner bull of the world. One that would be forgotten over the years as people piled into the new bull markets.
I understand the real world implications of these forecasts and I agree with an opinion that charts should not be able to forecast such things - but anytime someone says this I ask them to show me major asset crashes that did not comply with the main norms explained here, and no one ever does. I did look myself, I didn’t find any.
All I want to do is put these warning signs on your radar. In previous crashes there were always ways to protect yourself had you know this beforehand. And it’s not been different this time so far. Unless it becomes different - it’s reasonable to be alert to the dangers of what it’d mean if it was the same.
https://holeyprofitnewsletter.substack.com/p/looks-bad-getting-out-longs-and-reversing