
All the conditions for a big trade are now in place.
All the conditions for a big trade are now in place.
Markets seem primed to become much more volatile.

Everything apart from a trigger. Some big headline to explain it all.
The macro bear case is strong from a TA perspective. I’d also venture to say it seems solid from a fundies perspective, but that’s outside my area of interests and knowledge. It is interesting the narrative is fitting with the expected trade path of the fibs plan, though.
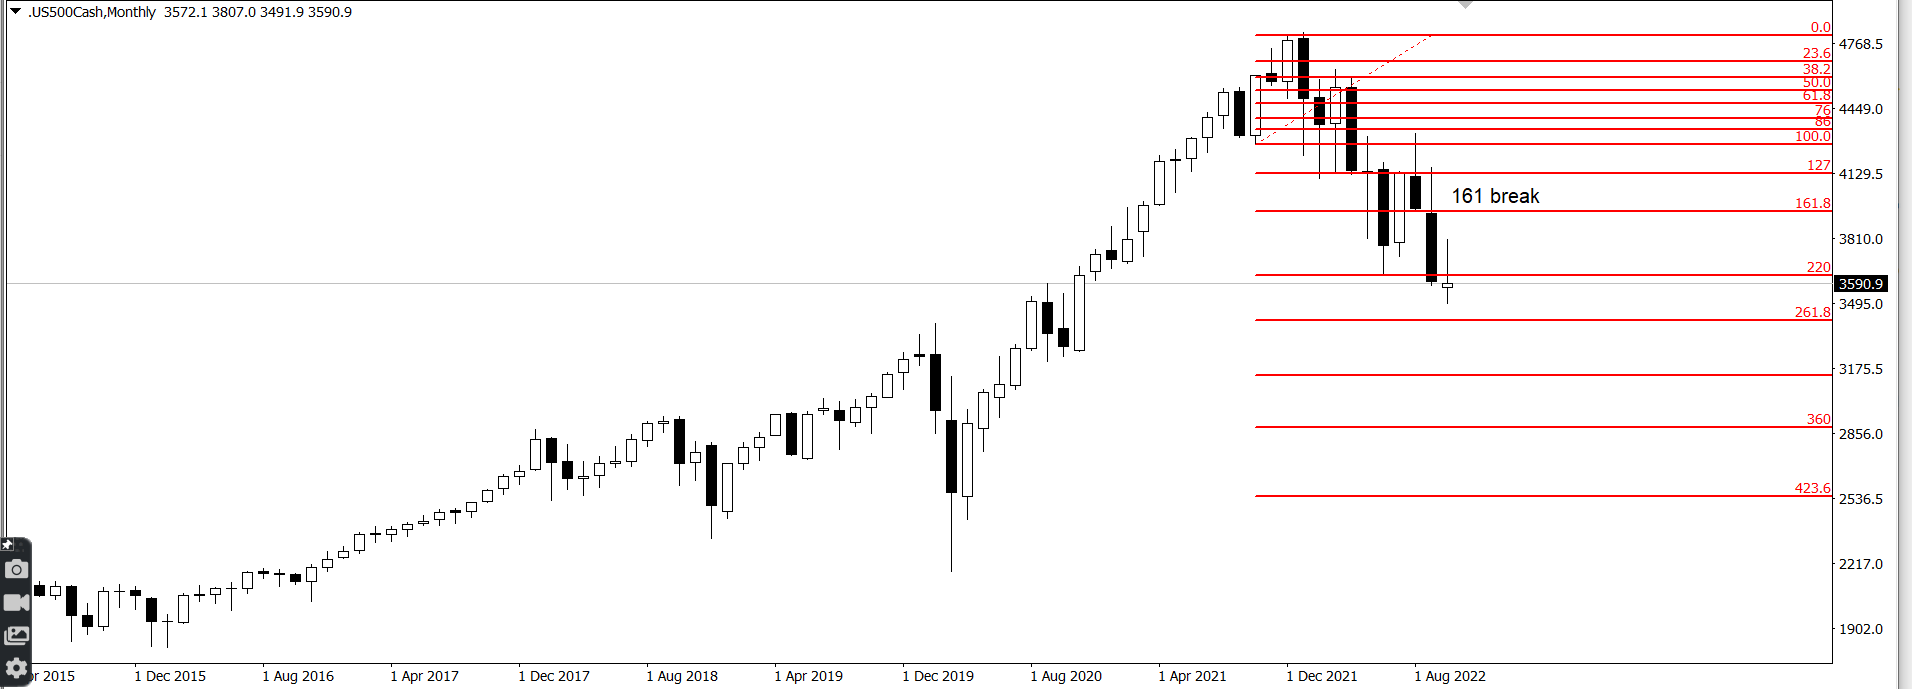
The fibs of the March 2020 swing continue to be useful in giving us big decision levels in the market. We’ve now triggered a series of different break patterns.
Here are posts on the types of break patterns in the order they have broken (These were all written pre-break).
March 2020 161 Break
The big 161 extension of March 2020 - by HoleyProfit (substack.com)

Topping swing 161 break

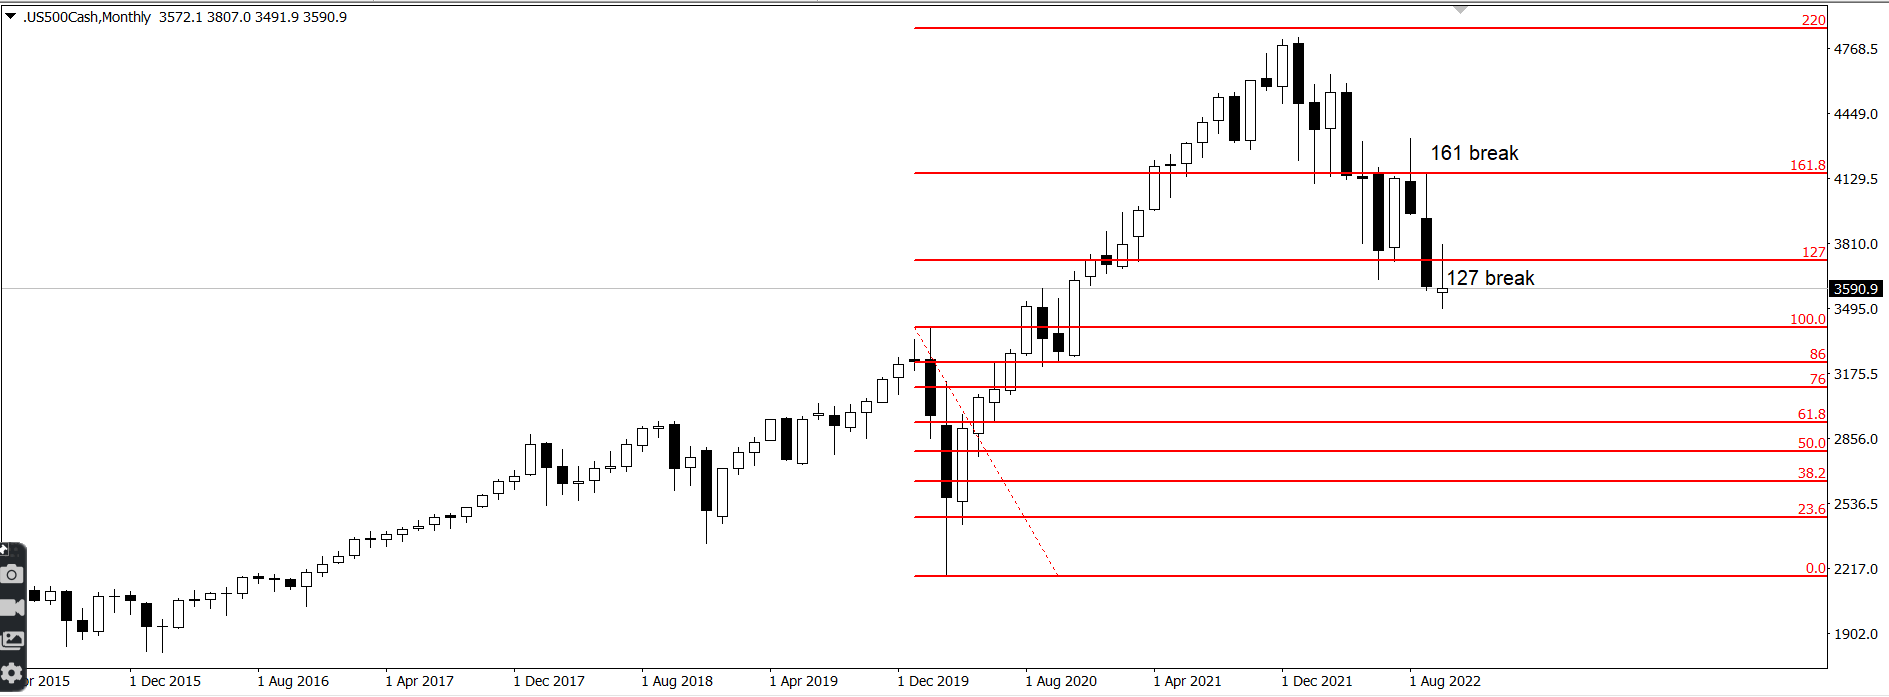
March 2020 127 break
Critical fib support failures - by HoleyProfit (substack.com)
We have also now broken the 220 fib of the topping swing. We’ve not done a post specifically on the 220 break but if we were using these fibs as support levels to buy from it is on the breaking of the 220 fib we’d stop out. Often if it does not stop by 220 it’s going to get a lot worse.
So, the macro TA setups strongly imply the break here. In the post about the 127 break, we were specific in saying the 127 breaks often indicates a reversal of trend. Breaking under the 127 can very often be the exact point at which we enter into an obvious trend in the other direction.
While this is different type of pattern, here’s an example of a 127 break coming before the obvious and lasting BTC bear started.
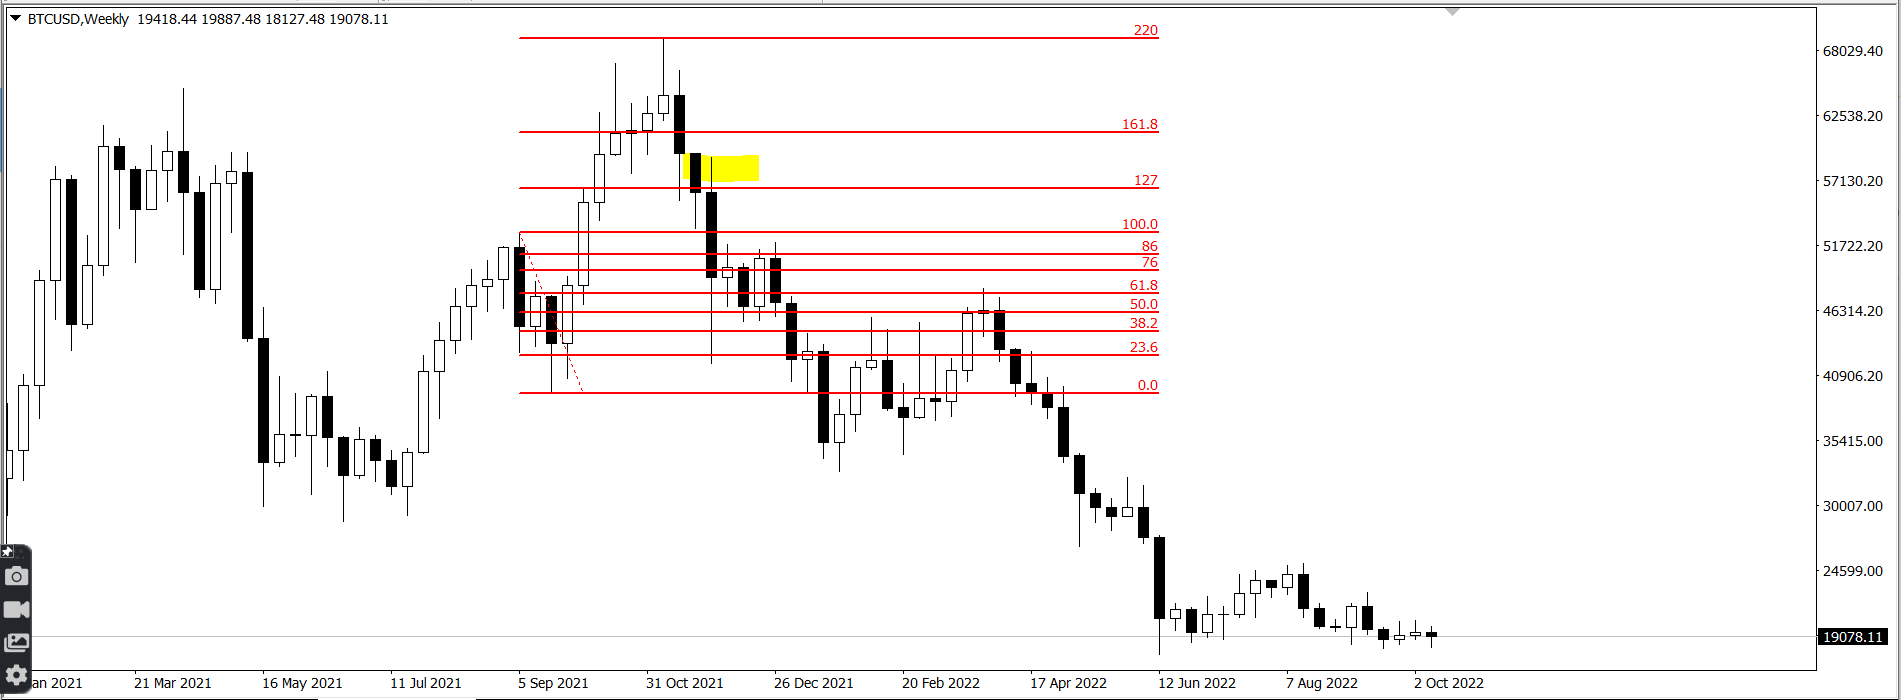
A signal we were able to point out in real time 11 months ago
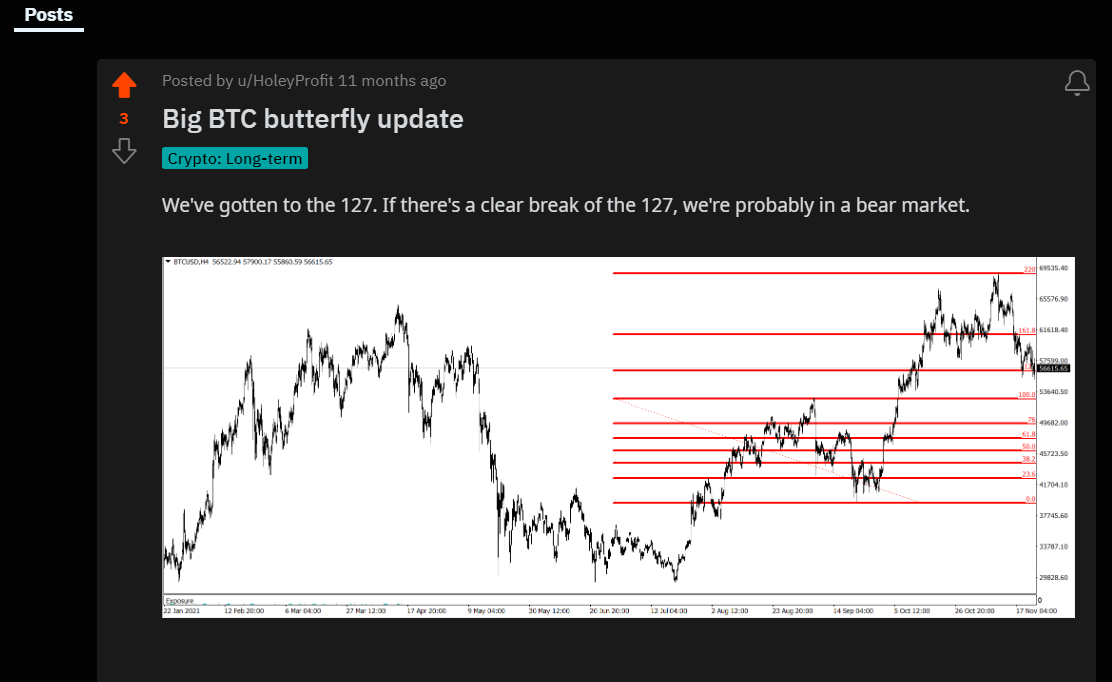
.
The overall macro strategy for the bear reversal is pretty simple. All of the macro stuff here could have been put out in 2021 and left at that. It would have been a great forecast of the top and 25% drop so far - but if we’d done that, it’d have not been very practically useful. It’s not as if it’s been without its traps.
We’ve been consistently paranoid about traps. Sometimes correctly and sometimes incorrectly but all the times I think it was worth it. Getting caught out in the rallies before the crash can really ruin what would have otherwise been a great big trade.
Put in the historical analysis and in actionable implication of these strategies it’s become clear the devils in the detail. For example, take a look at this 161 break in 2008. The 161 breaks and then the market capitulates. Simple as that … right?

Not quite. Not when you look closer. While this would have been simple for swing trades if you were just not watching, if you were trying to engage this market on a short-term basis and make aggressive high pay-off trades, this candle would have been traumatic.
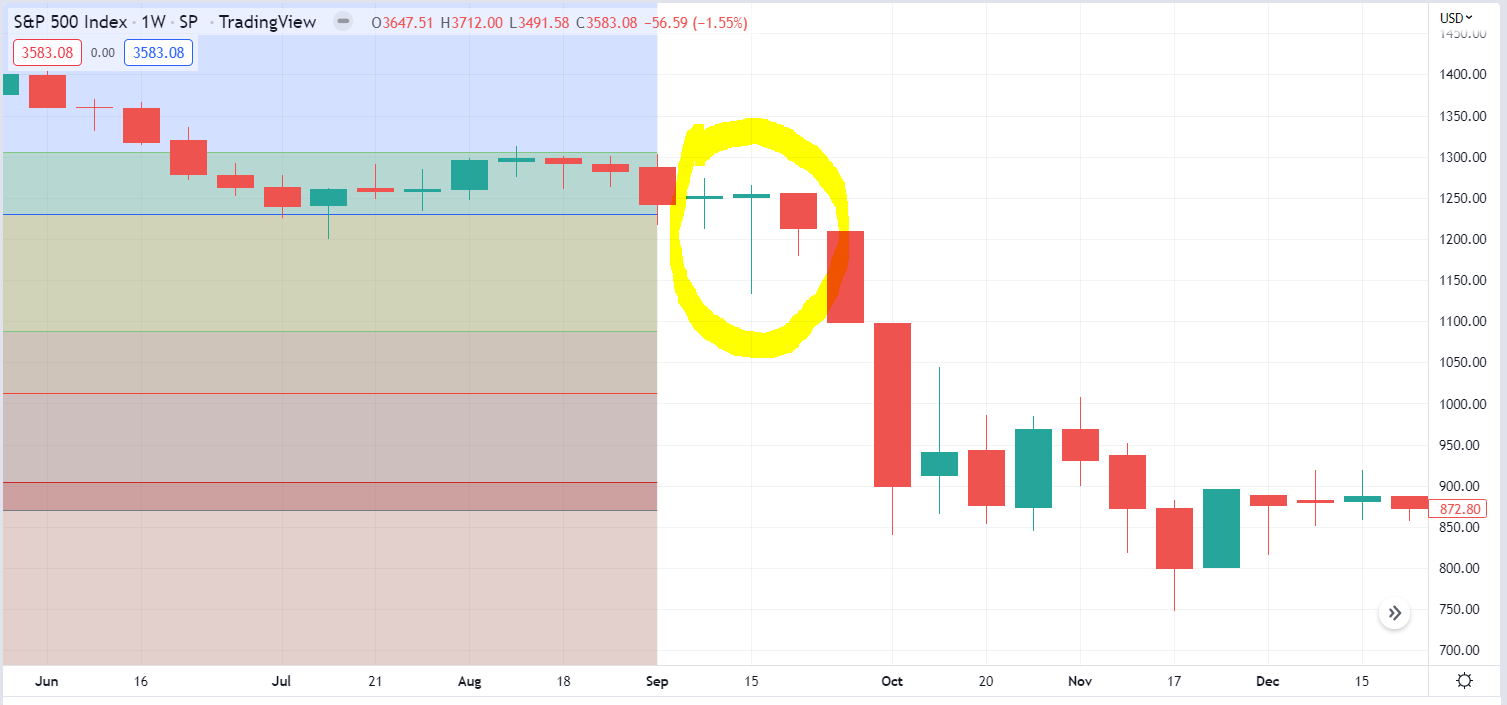
The bring in and the kick out. Big massive wick low and then a full recovery. Only to turn into the real crush after. Consider how many people were probably bearish into the lows of this, bullish into the highs and then sceptical of the following drop. I’d imagine it’d have had a similar effect as this candle has had.
If we expand out the topping swing to look for a bigger 161 we have also broken that 161 in this move. As with out previous 161 break, once the 161 is broken the bias is a move towards the 220 - 261 fibs (At least). If we trade back through the wick made last week this could be a significant break.
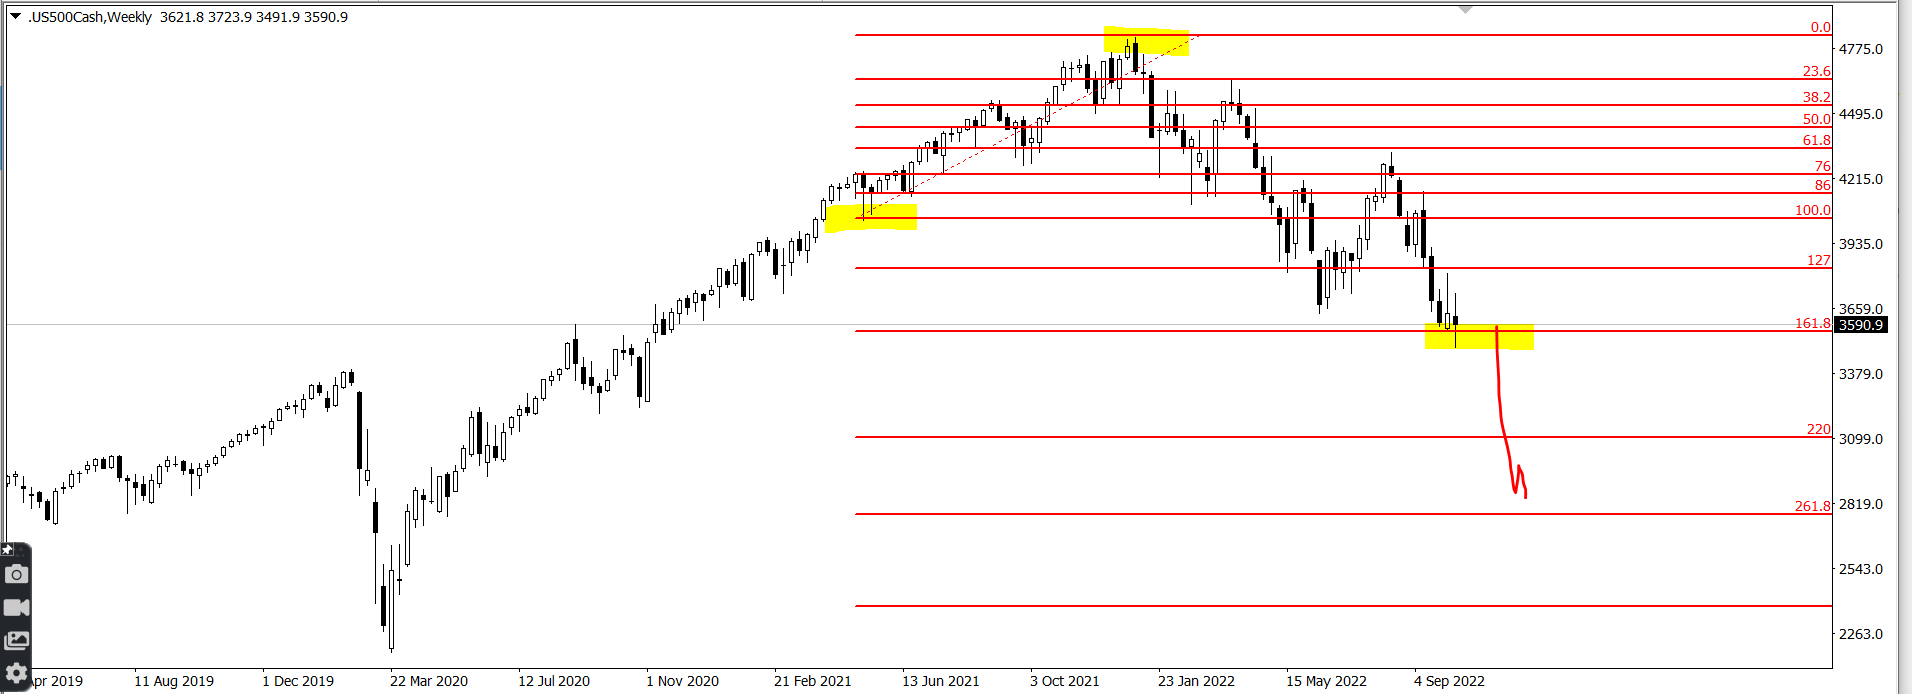
At this point we have a very good case for price heading to the 2900 sort of area. We can define these targets by the fib breaks from the topping swing and also if we were to use bullish setups if we’re breaking under the 50 fib the bias is more towards us getting close to the 76 fib before making a low.
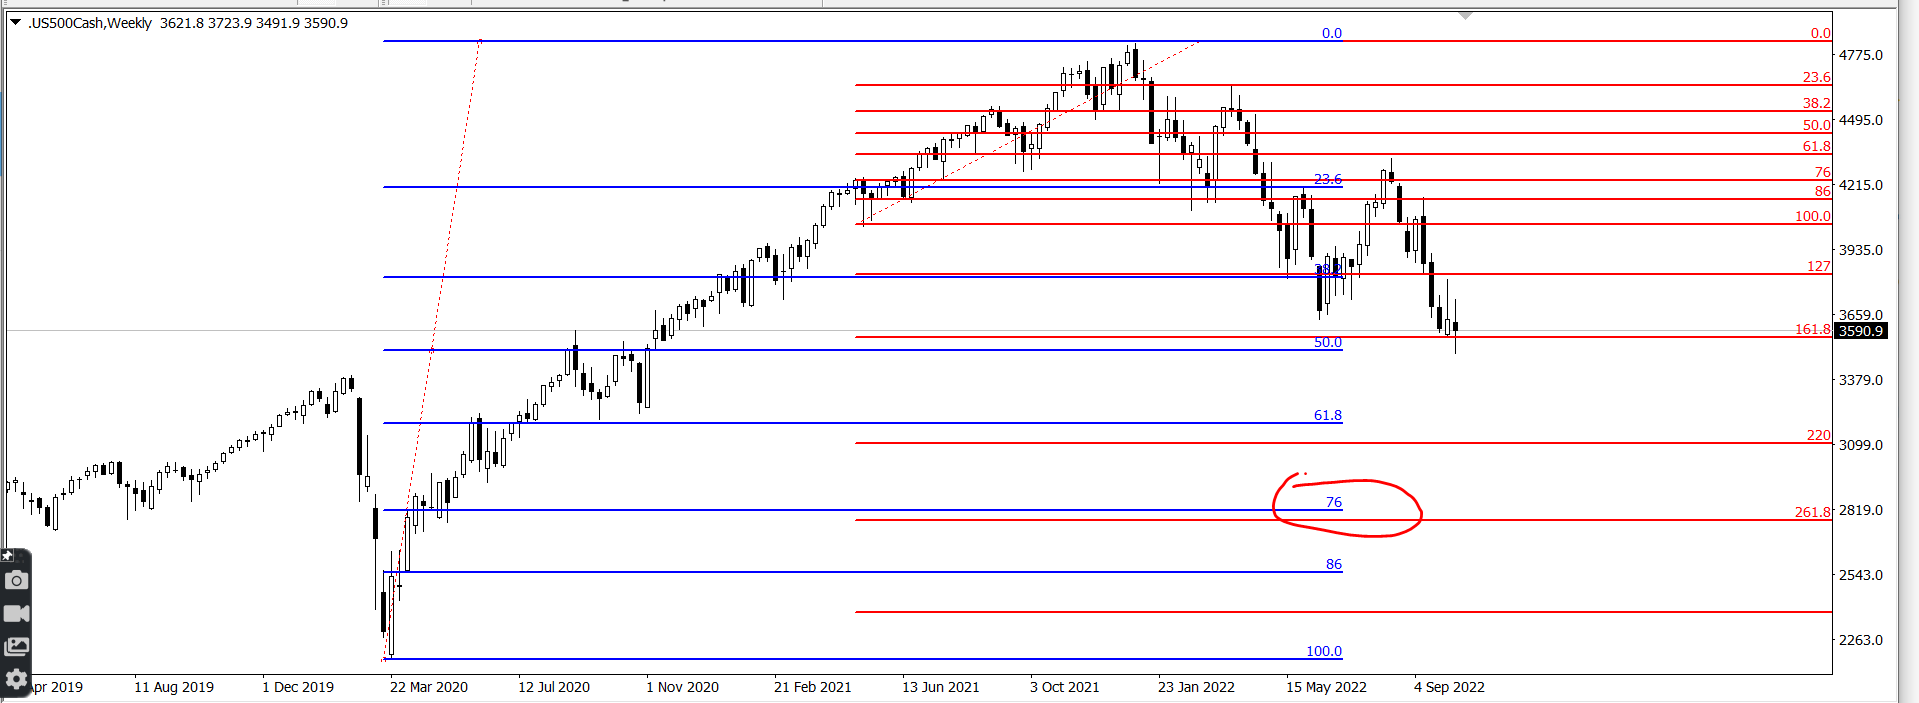
I think the macro best case for the bull now is these 76 retracements. And the bear case would be considerably more brutal.
Here are two recurring tendencies:
When 161s and 220 fail as support often move will continue until at least the 423 fib.
When a 76 fails as support often move will continue to at least the 127 fib.
Now, look what happens if we zoom our chart out with these two fibs sets we’ve drawn above on it. We have a perfect confluence of the 127 and the 423. It’s things like this that make me sceptical of the random walk hypothesis. The probabilities of these matching up randomly would be very slim.
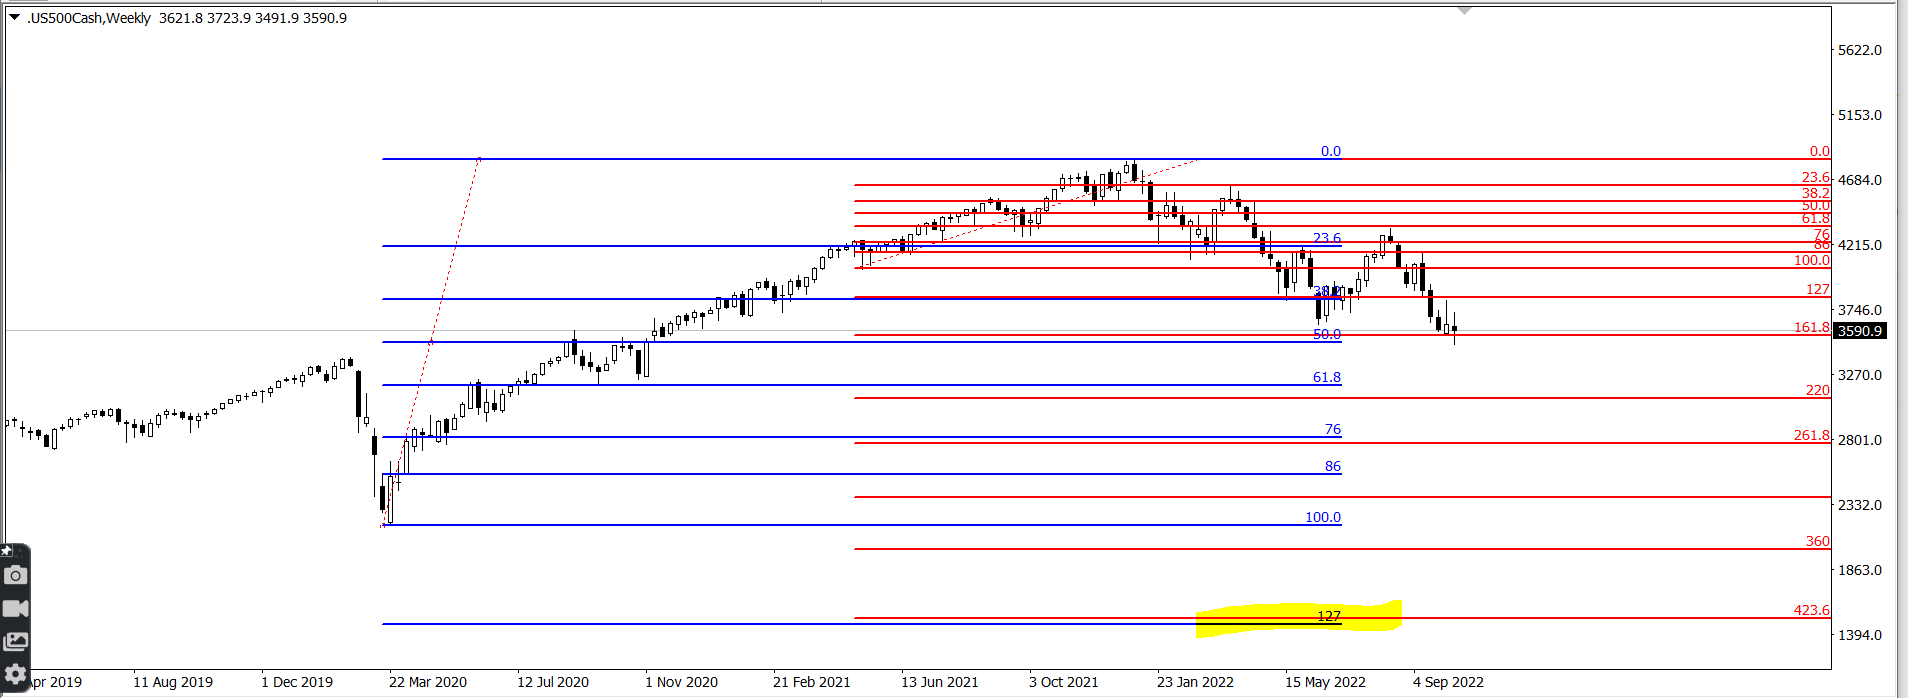
I think where these levels match up would be our extremely high value buying levels. Especially if preceded by action something like this.

As bears, in the real break swing we’d want to target the 320 fib. This is not the ultimate low, but it is the end of easy short. First really big bounces come here.

These breaks could become actionable any day now. But it will probably take a headline.
Our swing stops are currently over 3740 and we’ll update if these hits. As things stand, we’re positioned for the big break. And waiting to see what happens.