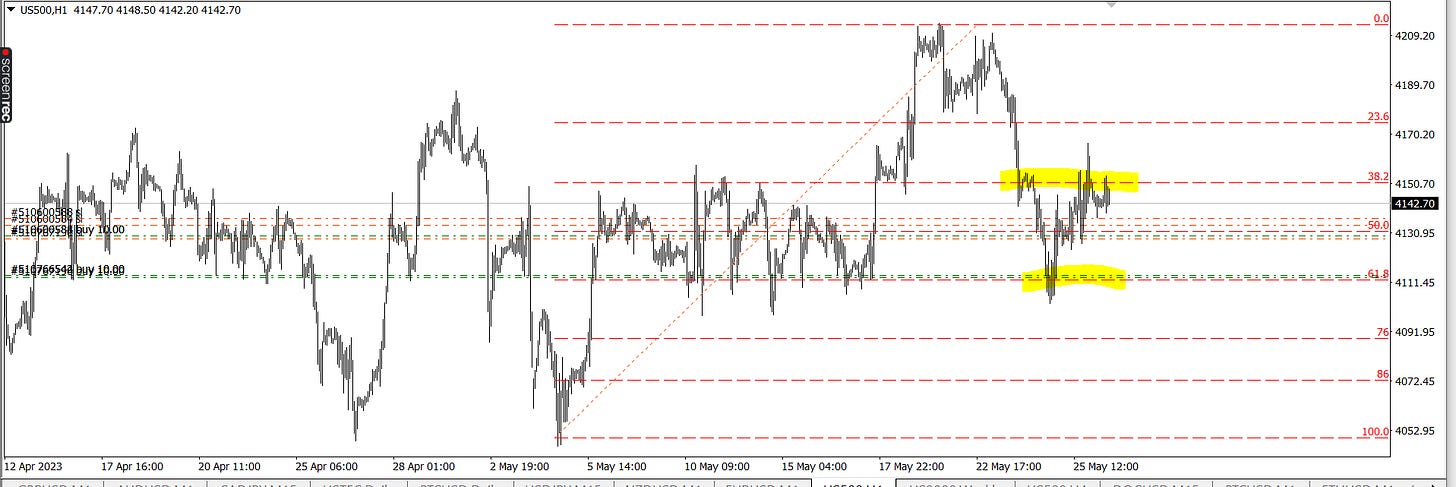
In previous newsletters we said our main areas of interest were around 4140 - 4100 (4090). We currently have our most important reactions around these areas.
Note: For any bear plans to have validity the higher lows structure of the short term trend has to break. This has not happened at time of writing.
At this point long profits are best protected. An impulse trend leg should be strong and it failing here can give us a lower move. A move lower to 4090 would still be acceptable in a bull setup and it’d be a high RR trade buying a spike out to there.
If we have a failure of this level it could be an important bear break. We have strong reactions on the previous fibs which gives us fair reason to believe the following fibs may be important. A 76 failing in this type of setup is often indicative of trend failure. Inside of the largest context this could be important.
Let’s recap on the overall larger context of where we’d expect to be if we were in a bear market and all of the bull action of the last 6 - 9 months had all just been a part of a complex bull trap.
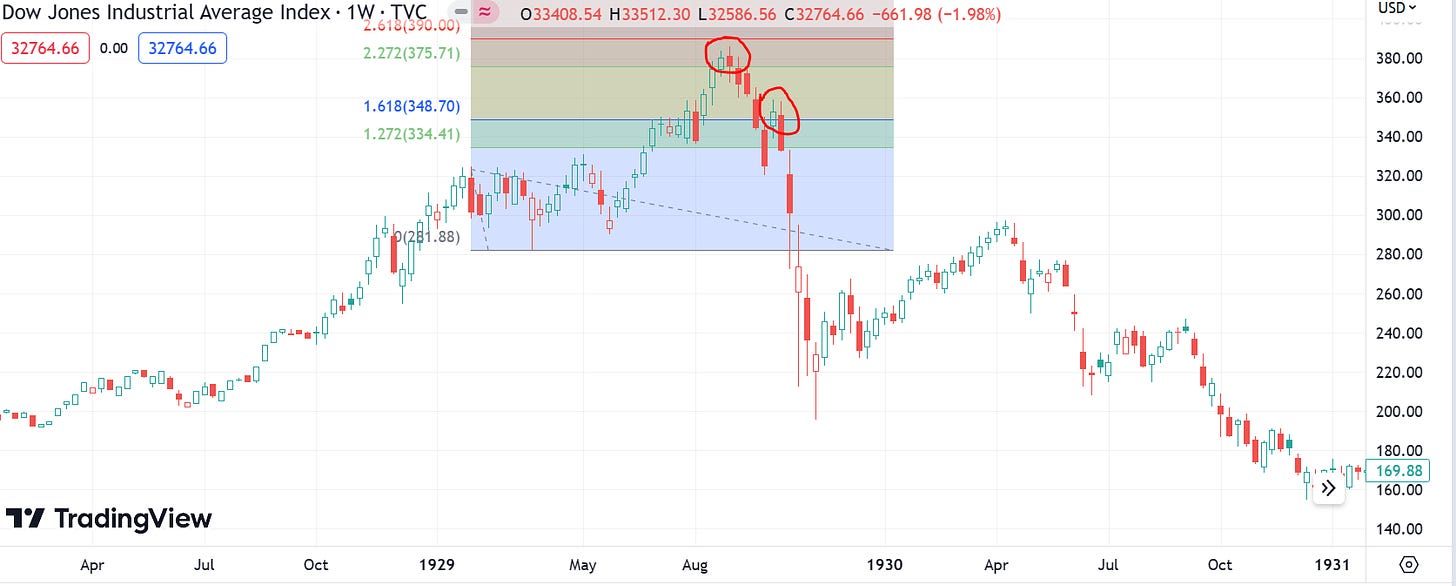
The best “Crash forecaster” I could find looking at historical crashes was when there was a small crash/choppy range and then the market went parabolic to a 161 - 200 extension of that, but this turned into a rejection. In many historical crashes, the failure of the 161 has become the actionable crash signal.
Since it was broken, this 161 has become the effective ceiling for price, with there only being short lived spikes over it. It has held for an impressive amount of time which I think means we can define it as an important level.
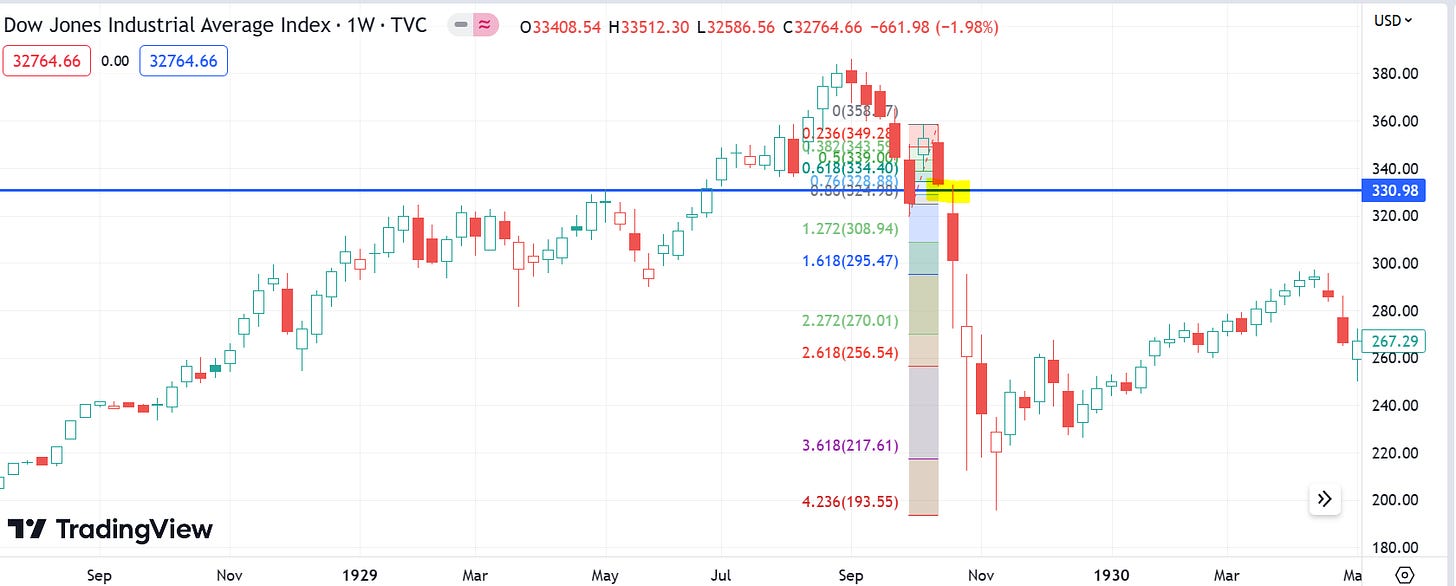
This 161 tendency can be found in many crashes in many markets over the years. An early prominent example being the DJI high of 1929.
The match ups between the DJI of 1929 and the market of the last decade is scary and it is possible this big break scenario is still on the cards. As it pertains to trading, there are many different points of caution for bears - but as it pertains to overall market outlook, I do not think things look good for bulls.
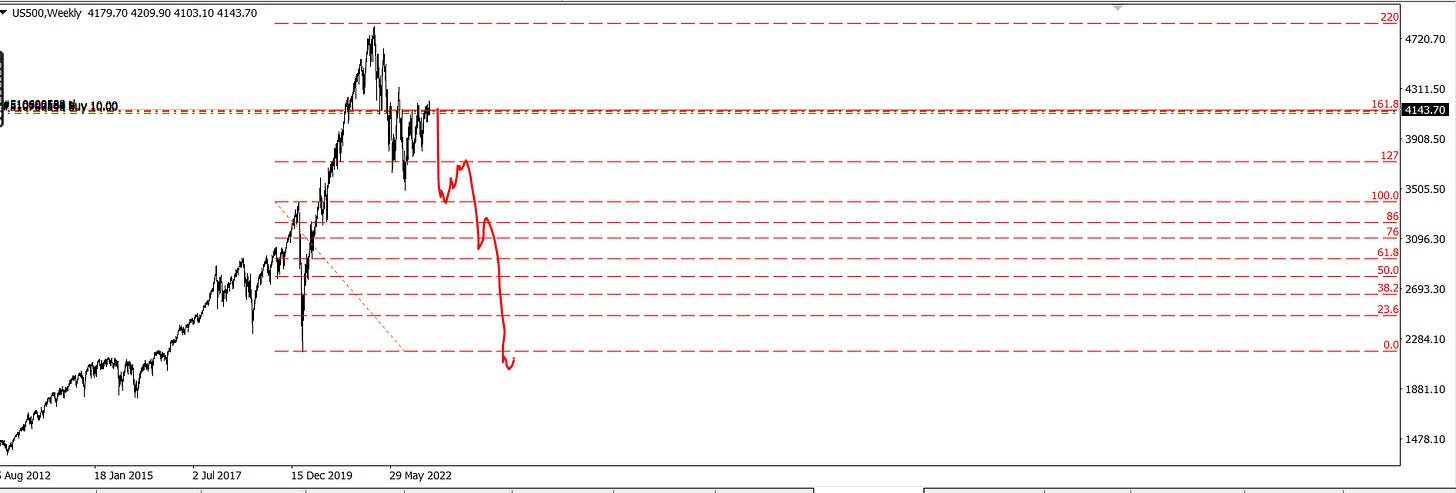
If we do a like-for-like forecast for today - we’d have this.
We’d be in the early failure of the bull trap. A new low would be made. Sharp rally to test the 127 fib and then the crash would come.
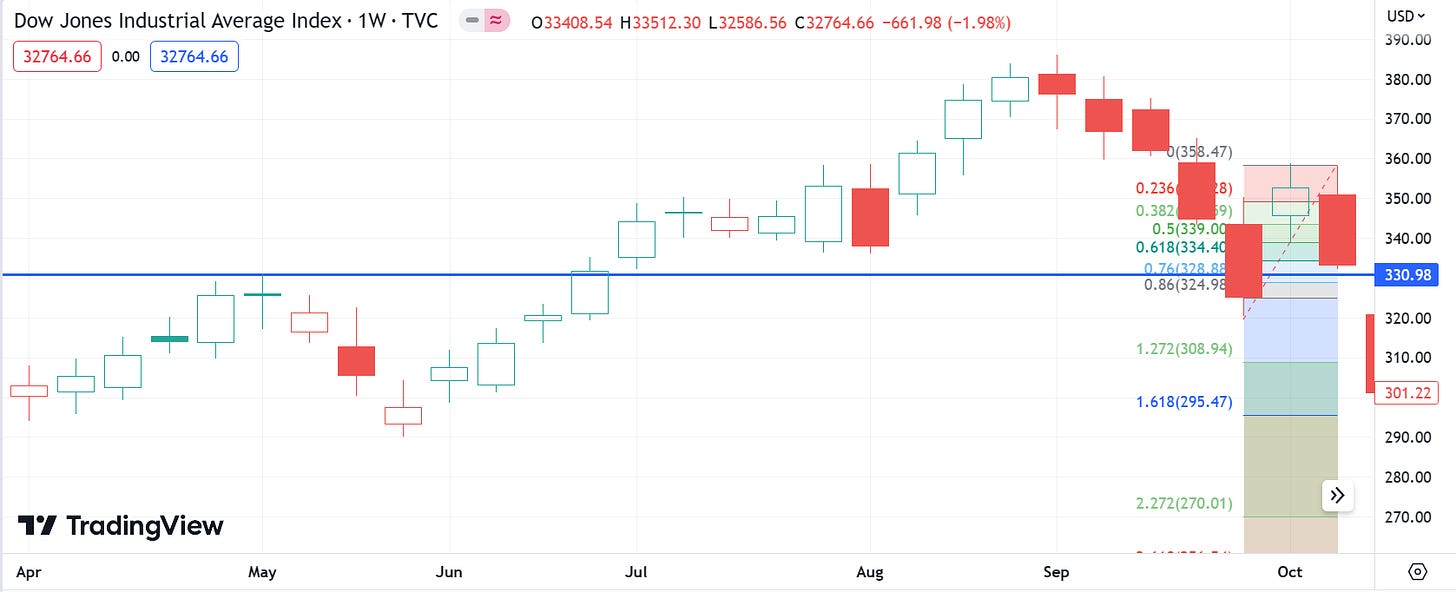
Zooming in on the last period of hope before the DJI crash would rally bite, we can see where we’d get our failure of the big 76 retracement for bulls.
If we look at that in the bigger context, this would have given us the ideal area to short a retest to bet on the bigger break.
This is very easy to replicate for a like-for-like move.
The DJI-esk scenario would make a horrifically bleak forecast, heading far lower than the chart shown above, but the minimum likely target for a break now would be the 76 retracement of the 2021 rally.
The DJI of 1920 - 1929 and SPX of 1990 - 2023 have matched up a lot. Here’s more written on this back in 2021 just before the high was made.
Different ages with similar crashes - by HoleyProfit (substack.com)
A major trend failure level would be a break of 3700, but obviously if there’s to be something like that we’d want to spot the break much earlier. Which is why the breaking of the 76 at 4090 may prove to be very important and is an area where we’d want to take shorts for the high RR ops and remove long exposure.
Things to support a bear thesis at thesis at this point and earliest bear entries are:
Keep reading with a 7-day free trial
Subscribe to Market Forecasts and Trade Plans to keep reading this post and get 7 days of free access to the full post archives.


