
Bull Failure Levels and Plans for a Bear Move
Bull Failure Levels and Plans for a Bear Move

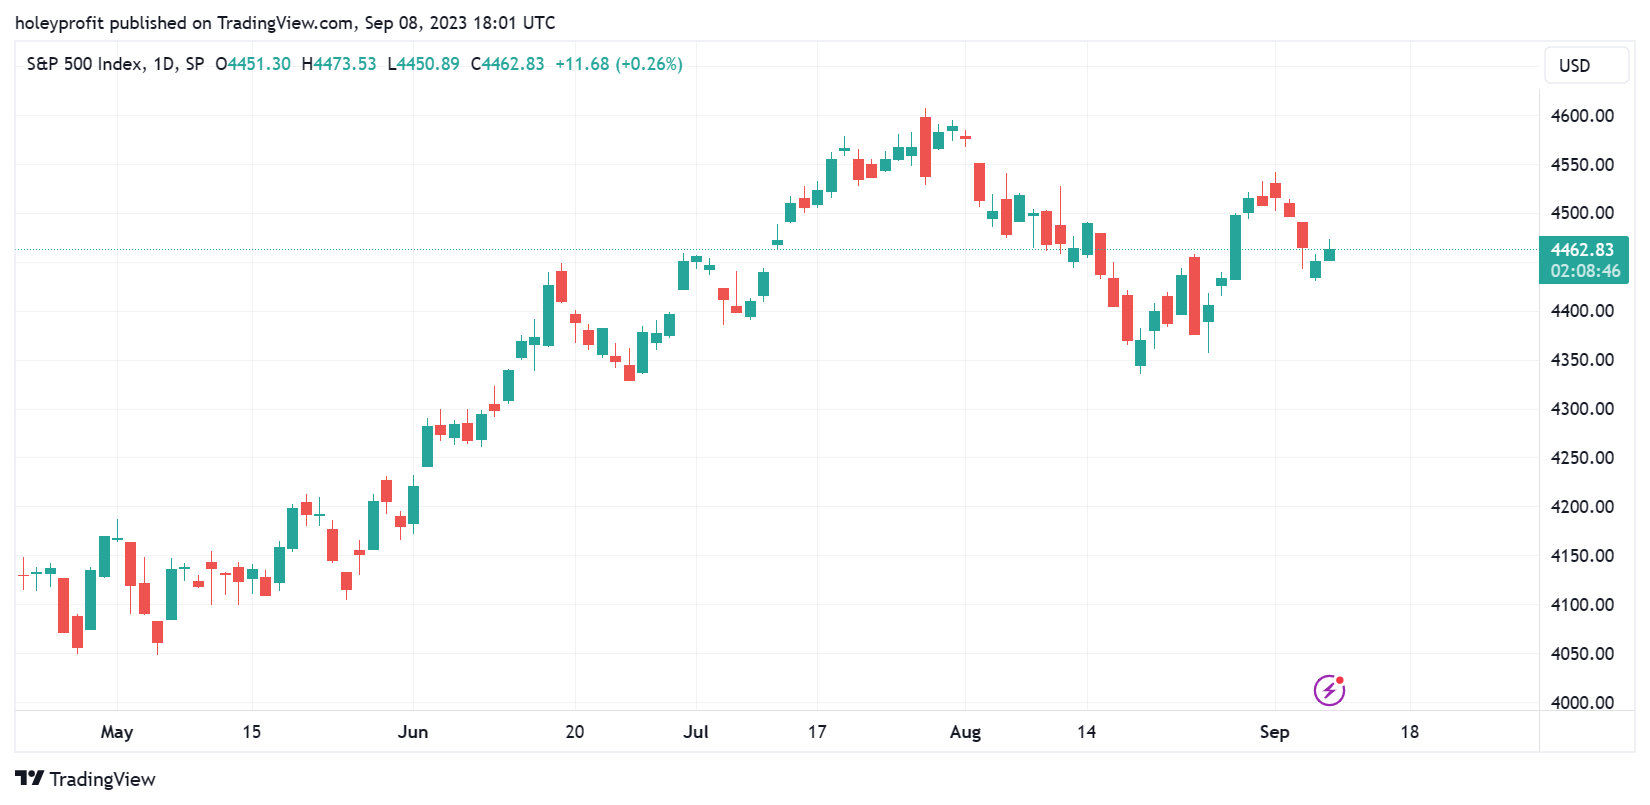
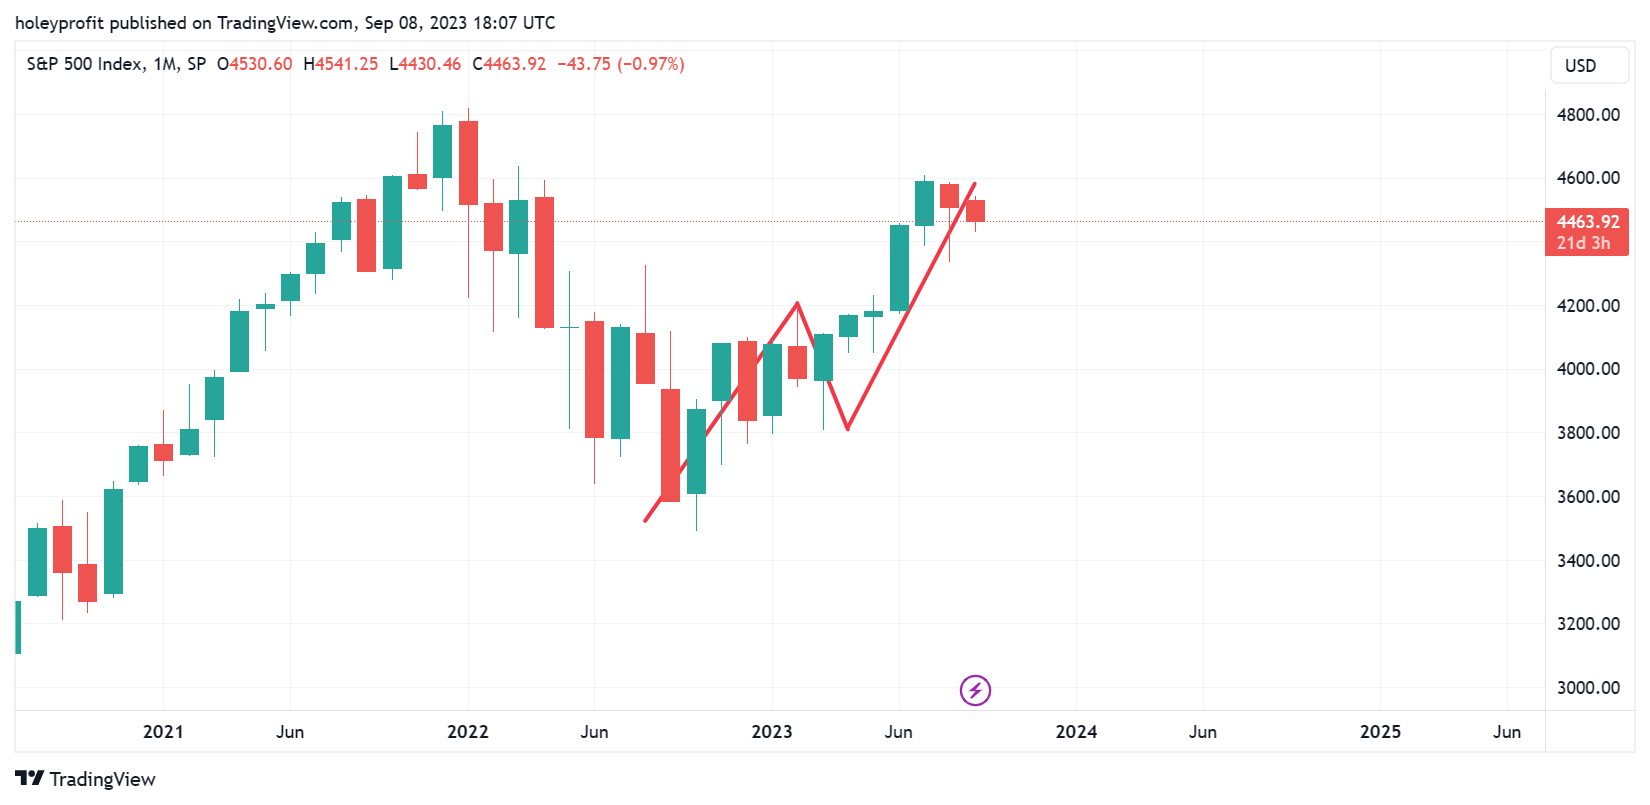
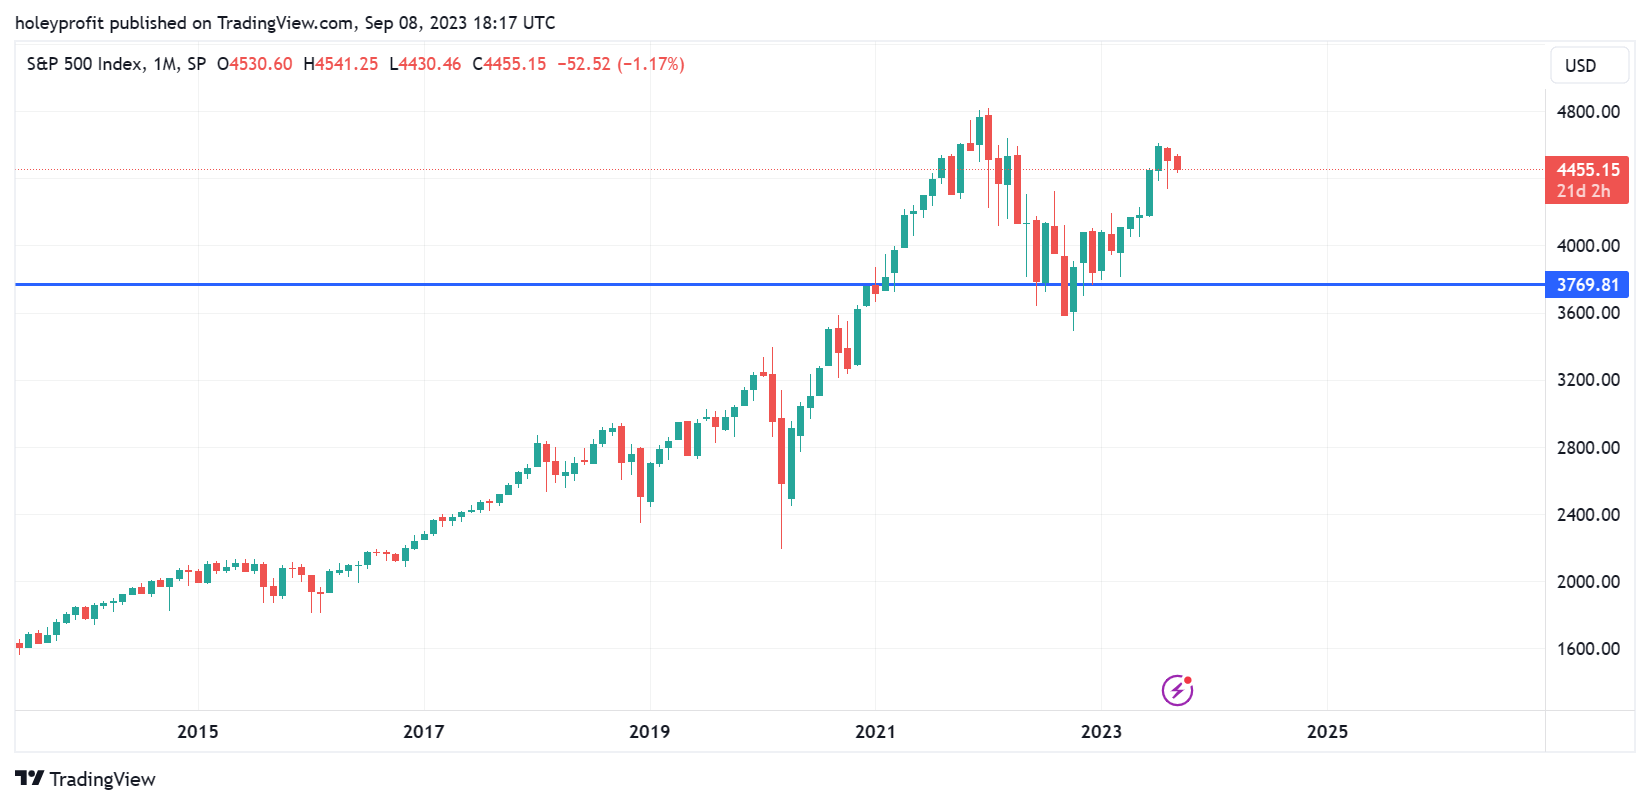
Strong Bull Failure
Our selling recently has broken the simple strong Elliot uptrend. Here we’ve dropped more than we’d expect to see in wave 3 without getting as high as we’d expect to see.
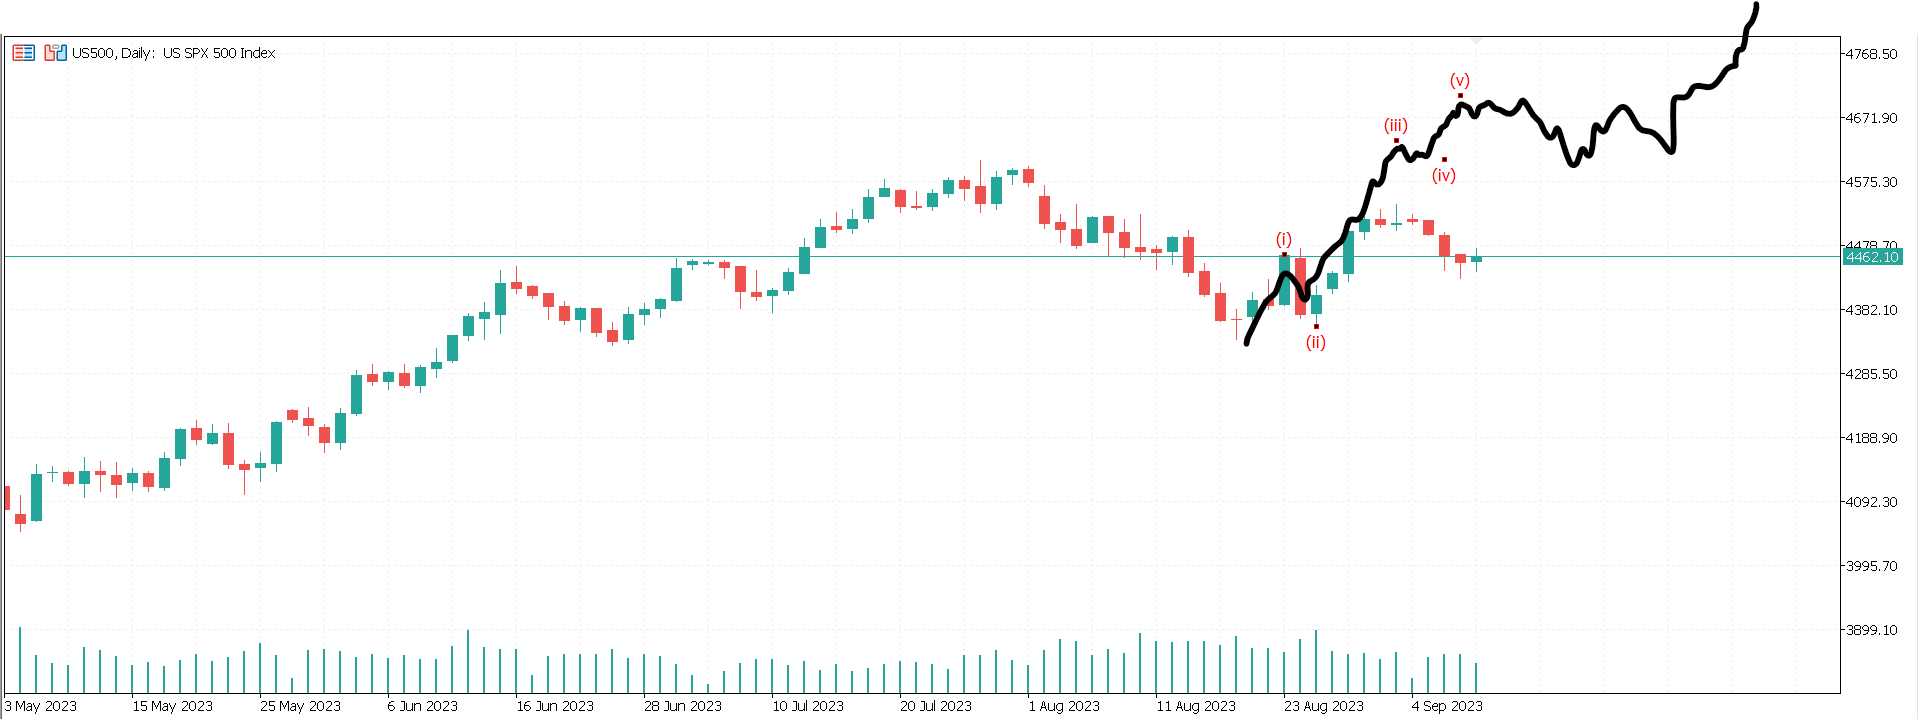
While the uptrend was in place it made sense to bet on continuation of it because it would have a lot of momentum but the breaking of this annuls the simple strong uptrend plans. Now something else must be happening. In both bullish and bearish scenarios I’d expect to see us 100 points lower.
Bull Scenario
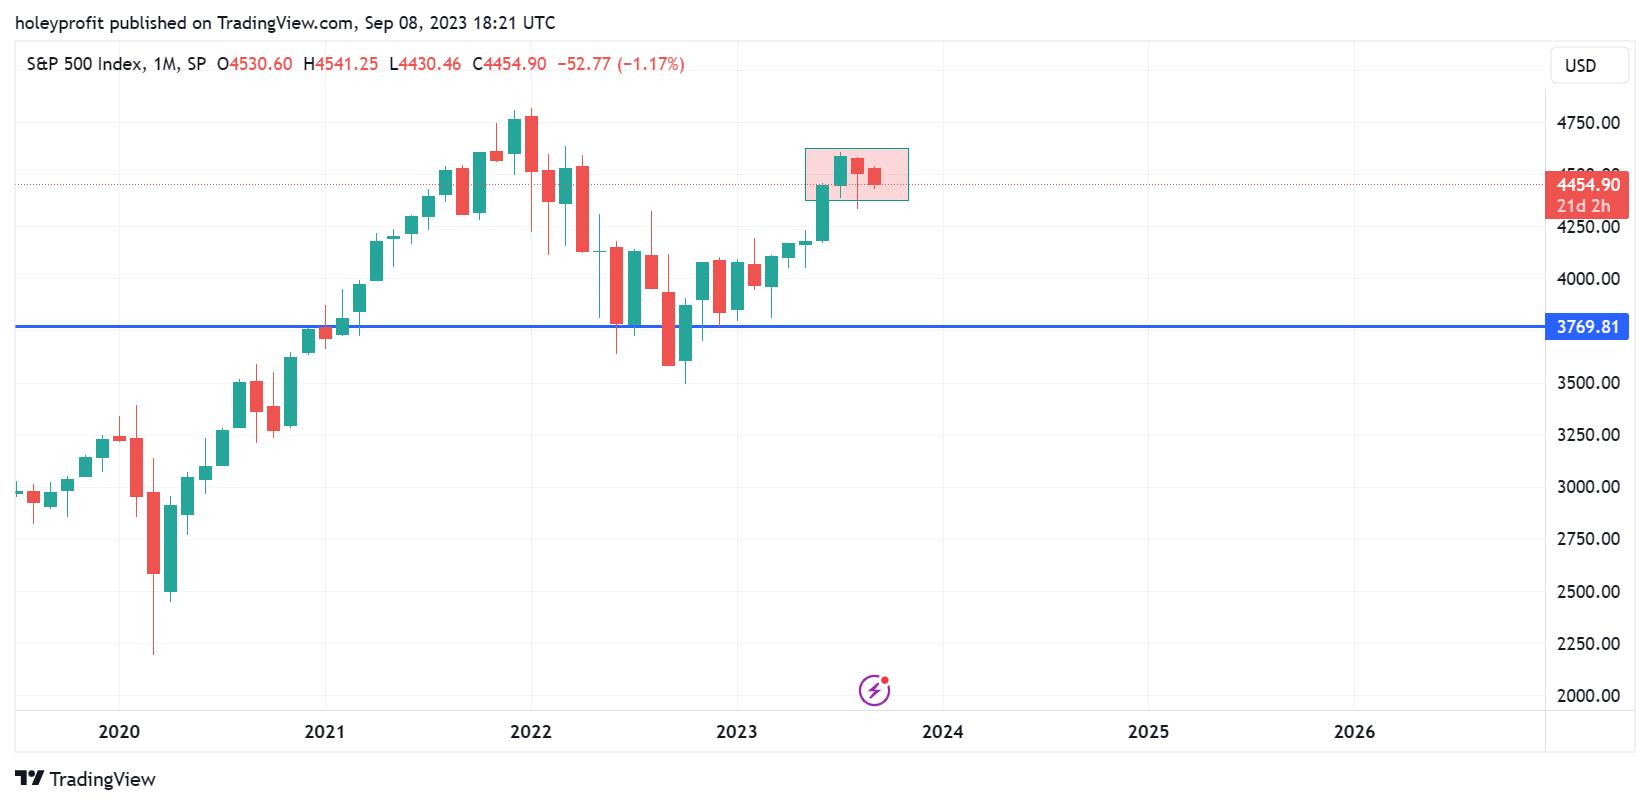
The comparison to 2020 may not yet have failed. It’s possible we’re in this bit.
A small expression of this pattern has formed and has failed over the last days but it could be this was just noise inside the building of a bigger (More similar) W.
It remains possible we’re inside of a really strong bull move and this drop is something we could expect to see inside the context of this.
But it’s also the case now if we were heading into a bear move things could develop really quickly and we need to be ready for it.
The Bear Break Setup
This looks really good for bulls.
And this is scary.
Sometimes that shape means you there’s a very big reversal of trend coming.
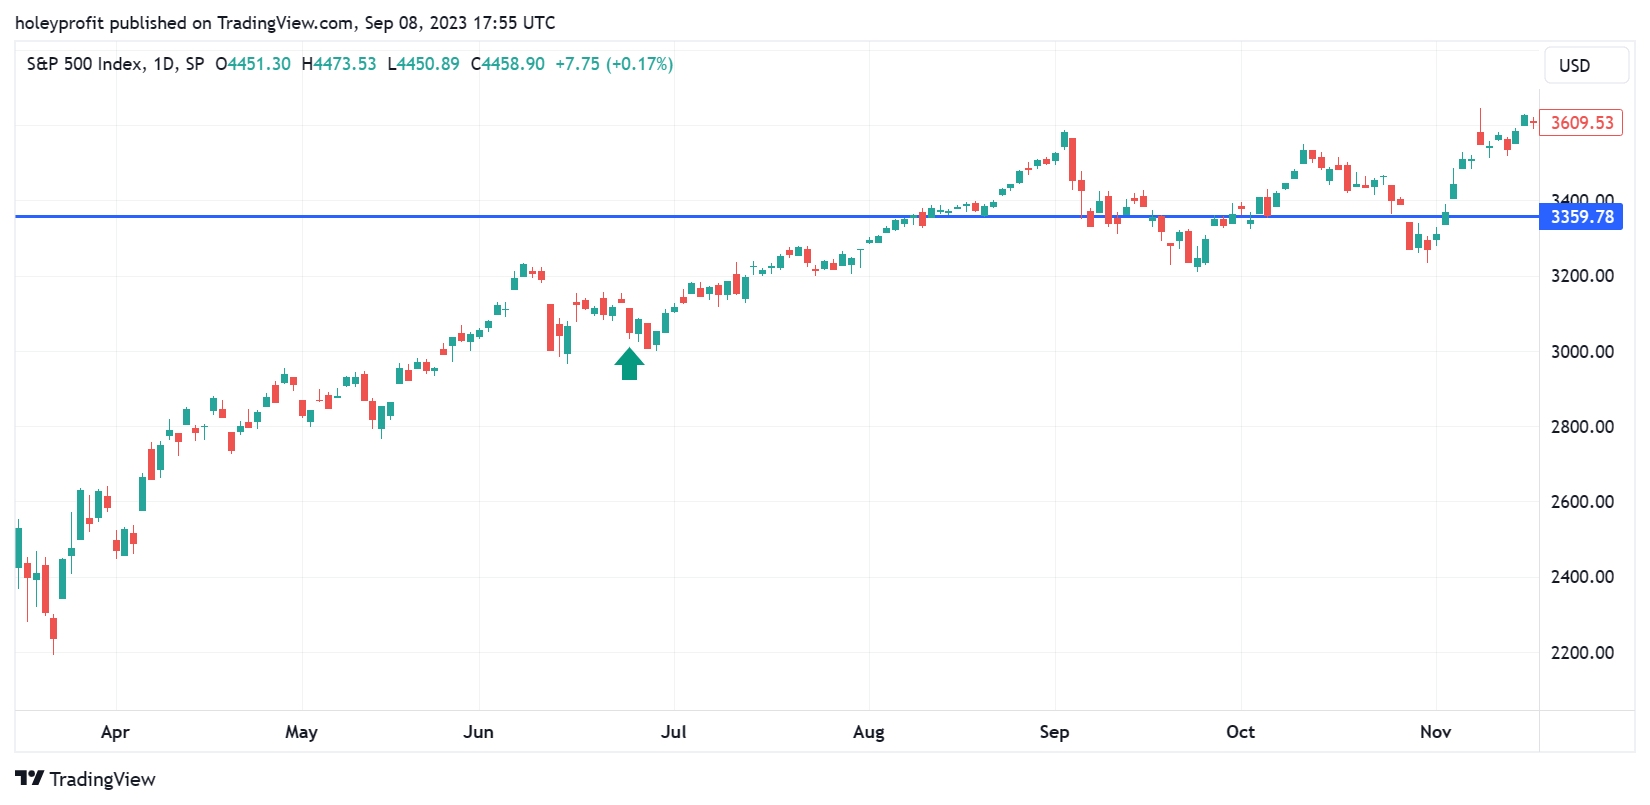
Here’s an example. AAPL while good.
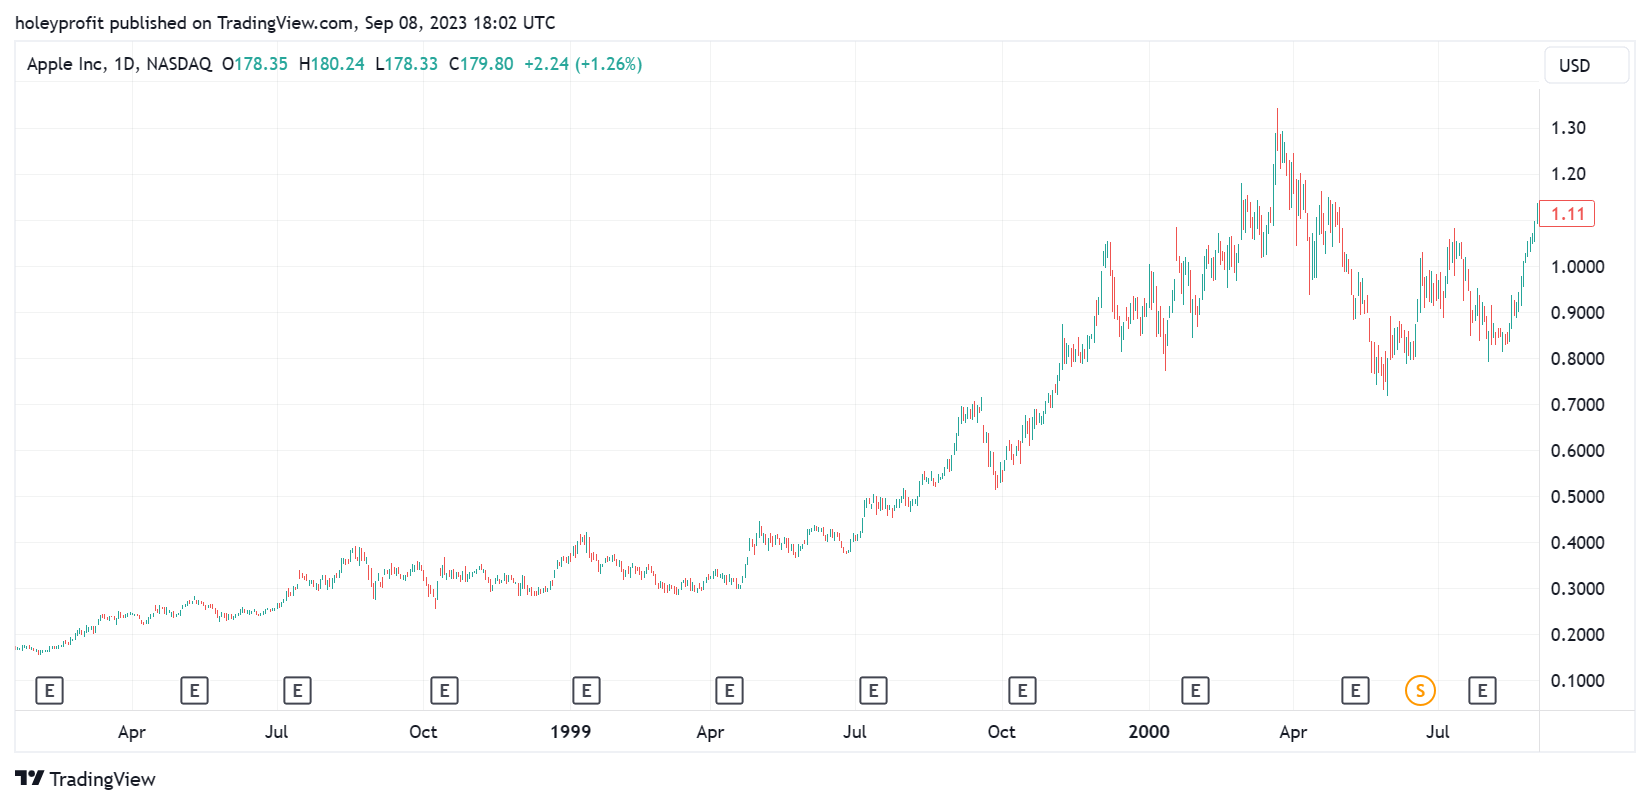
Early signs of AAPL being “Scary”.
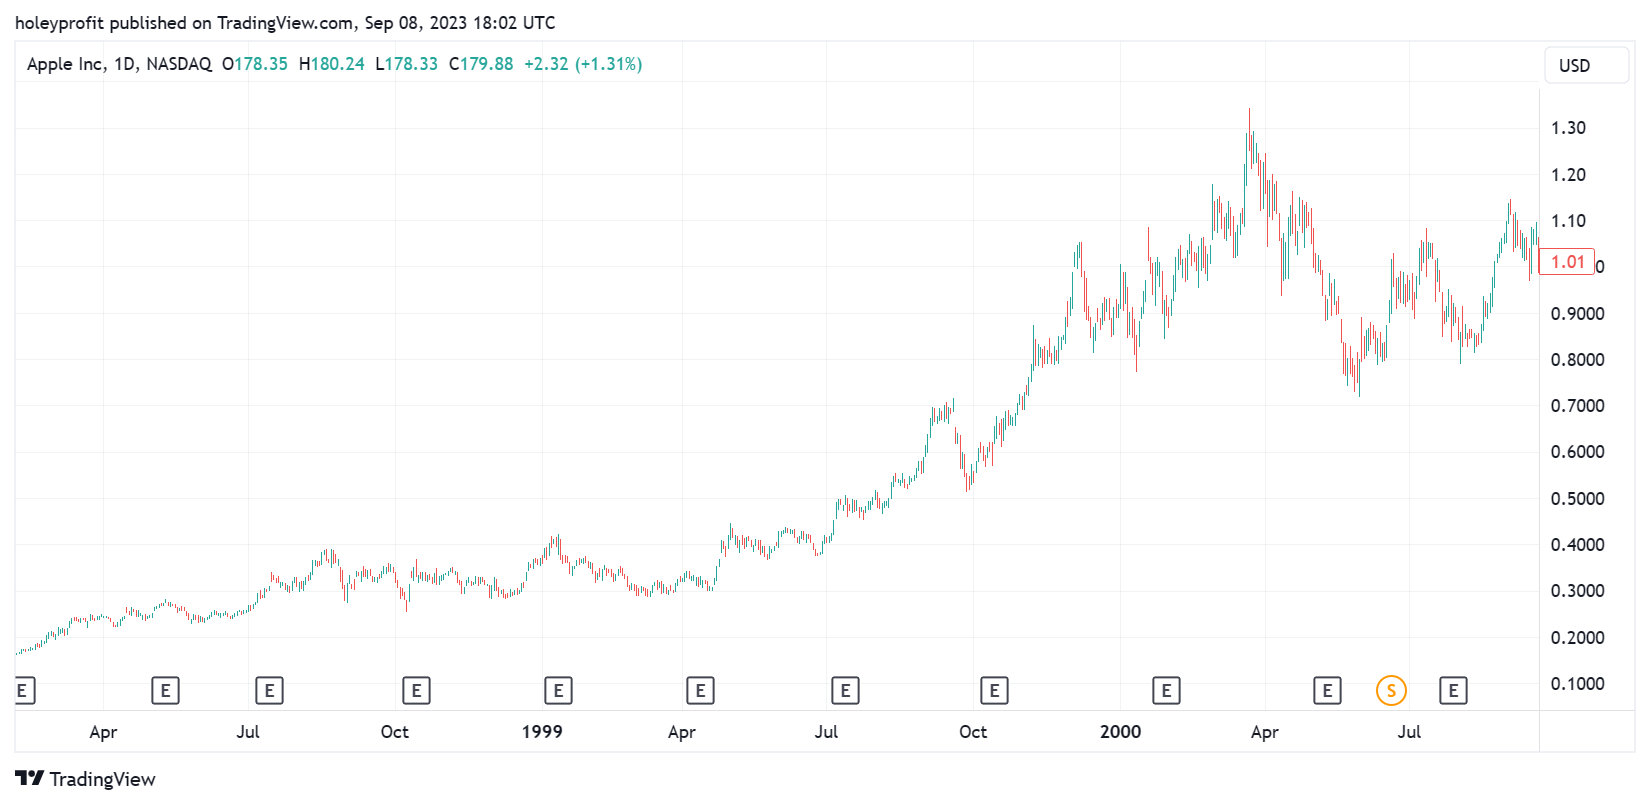
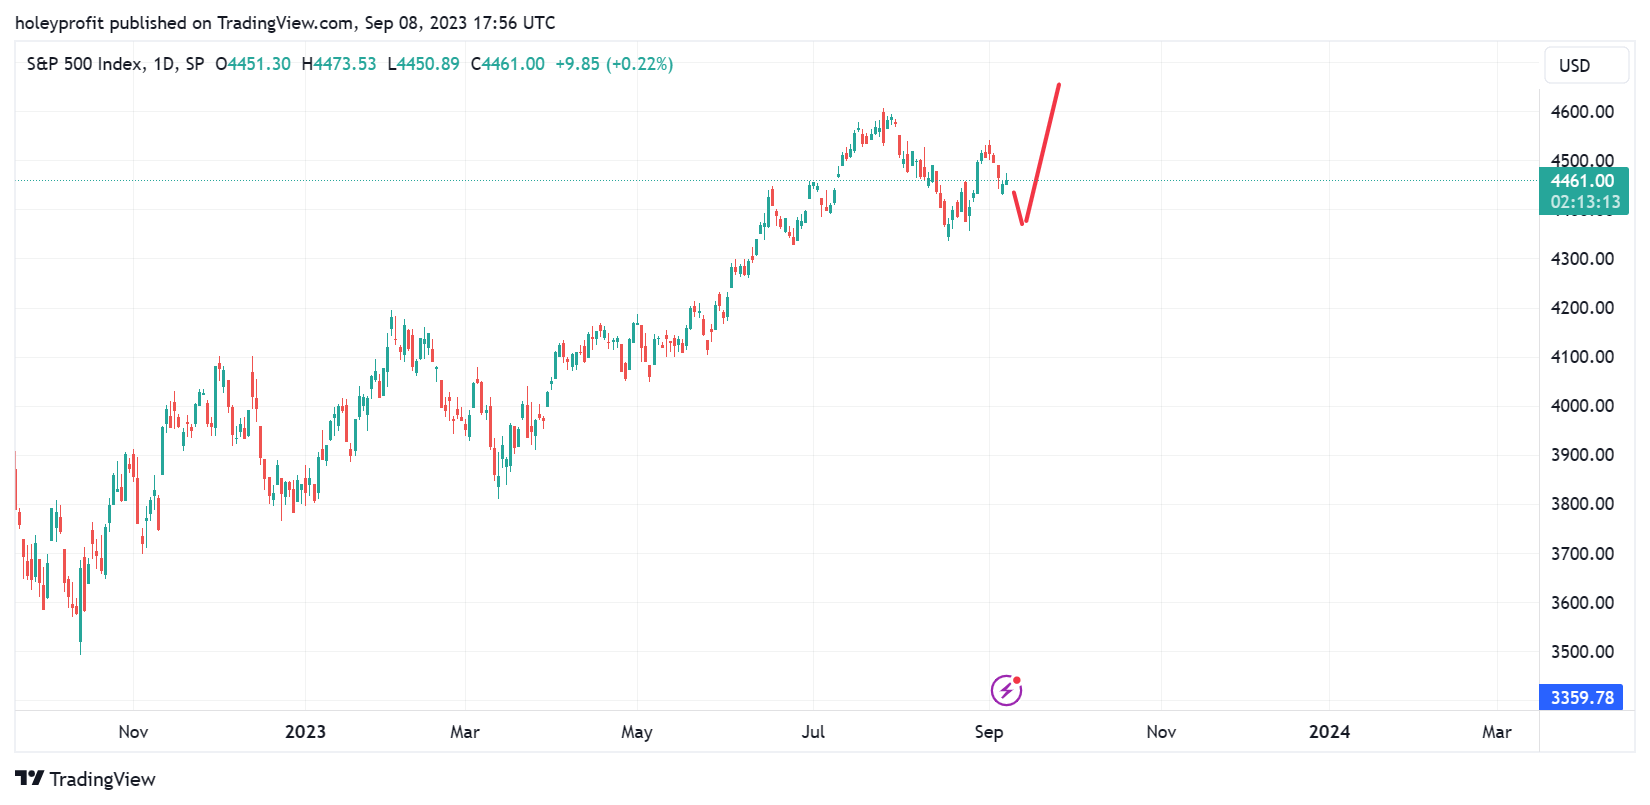
This was the high of the W structure before the crash.
Now … this is a daily chart and it only forecasts a crash relative to recent action. It would not be a massive crash - but what’s interesting is what the implied patterns would then be on the bigger charts.
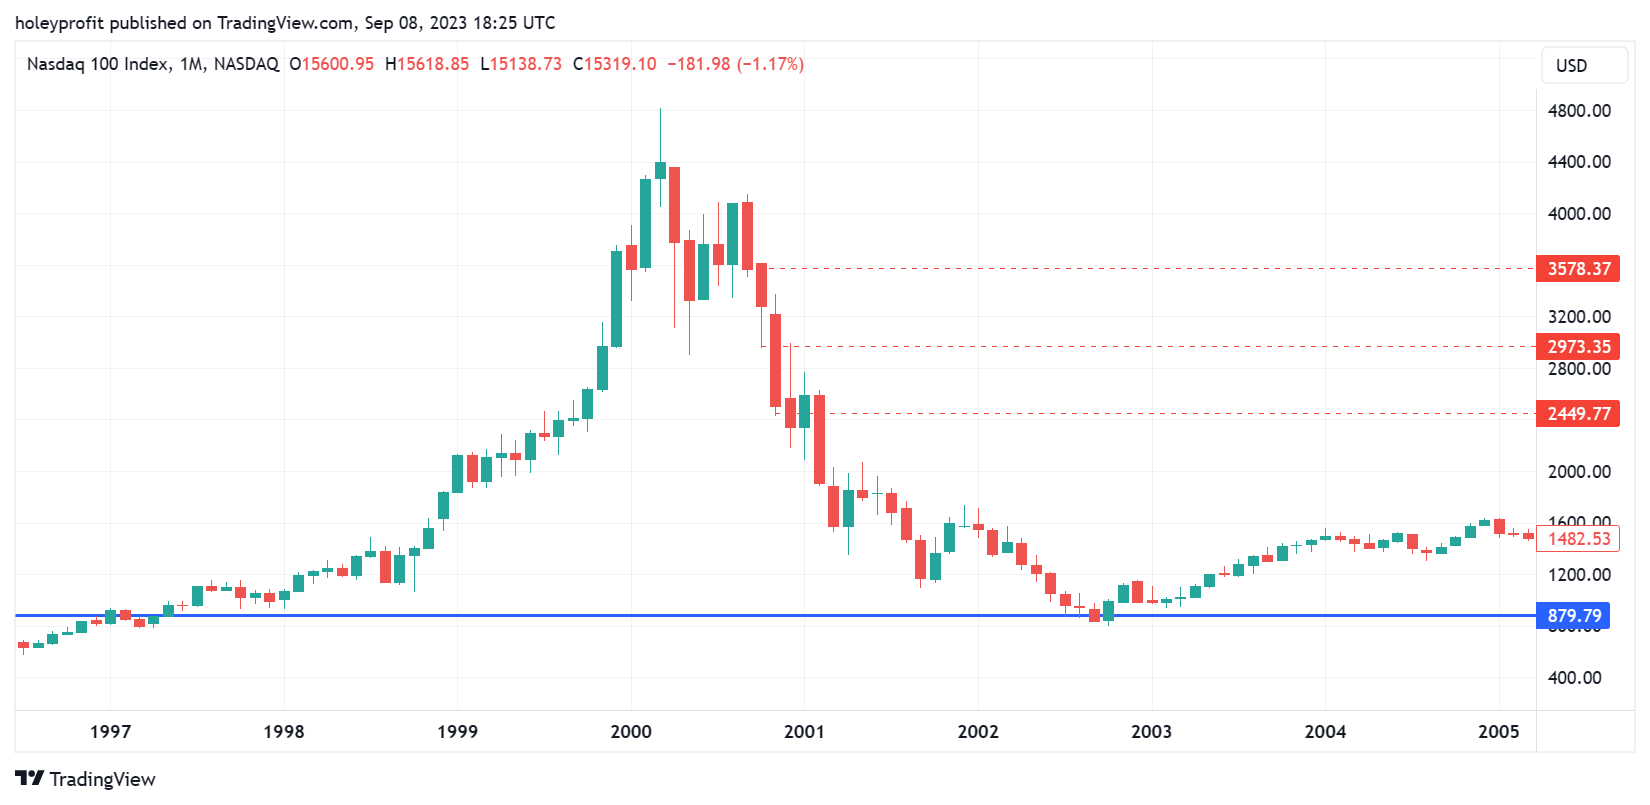
Big Chart Patterns
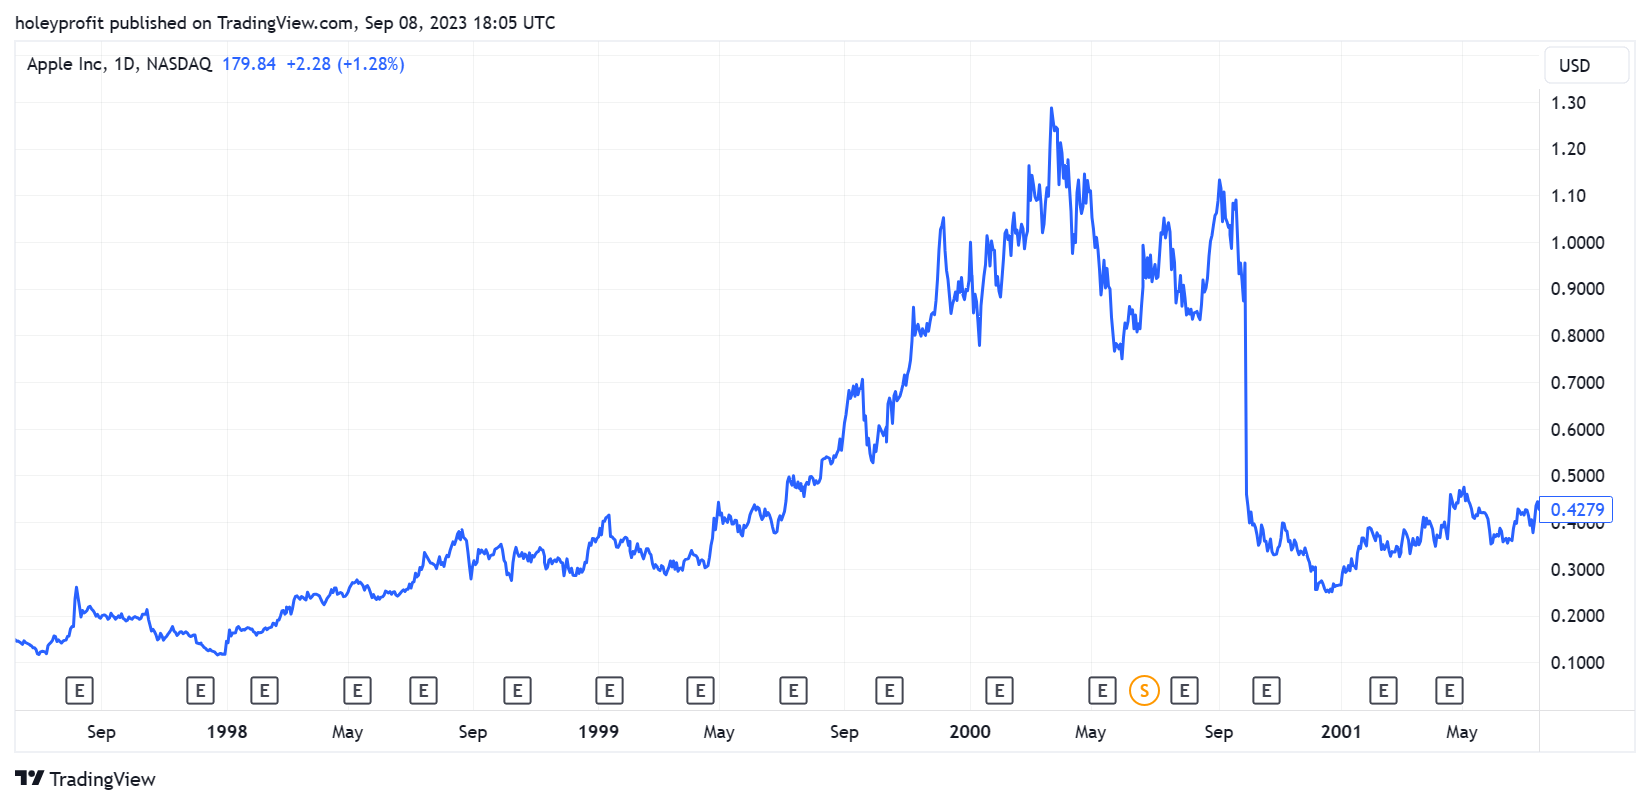
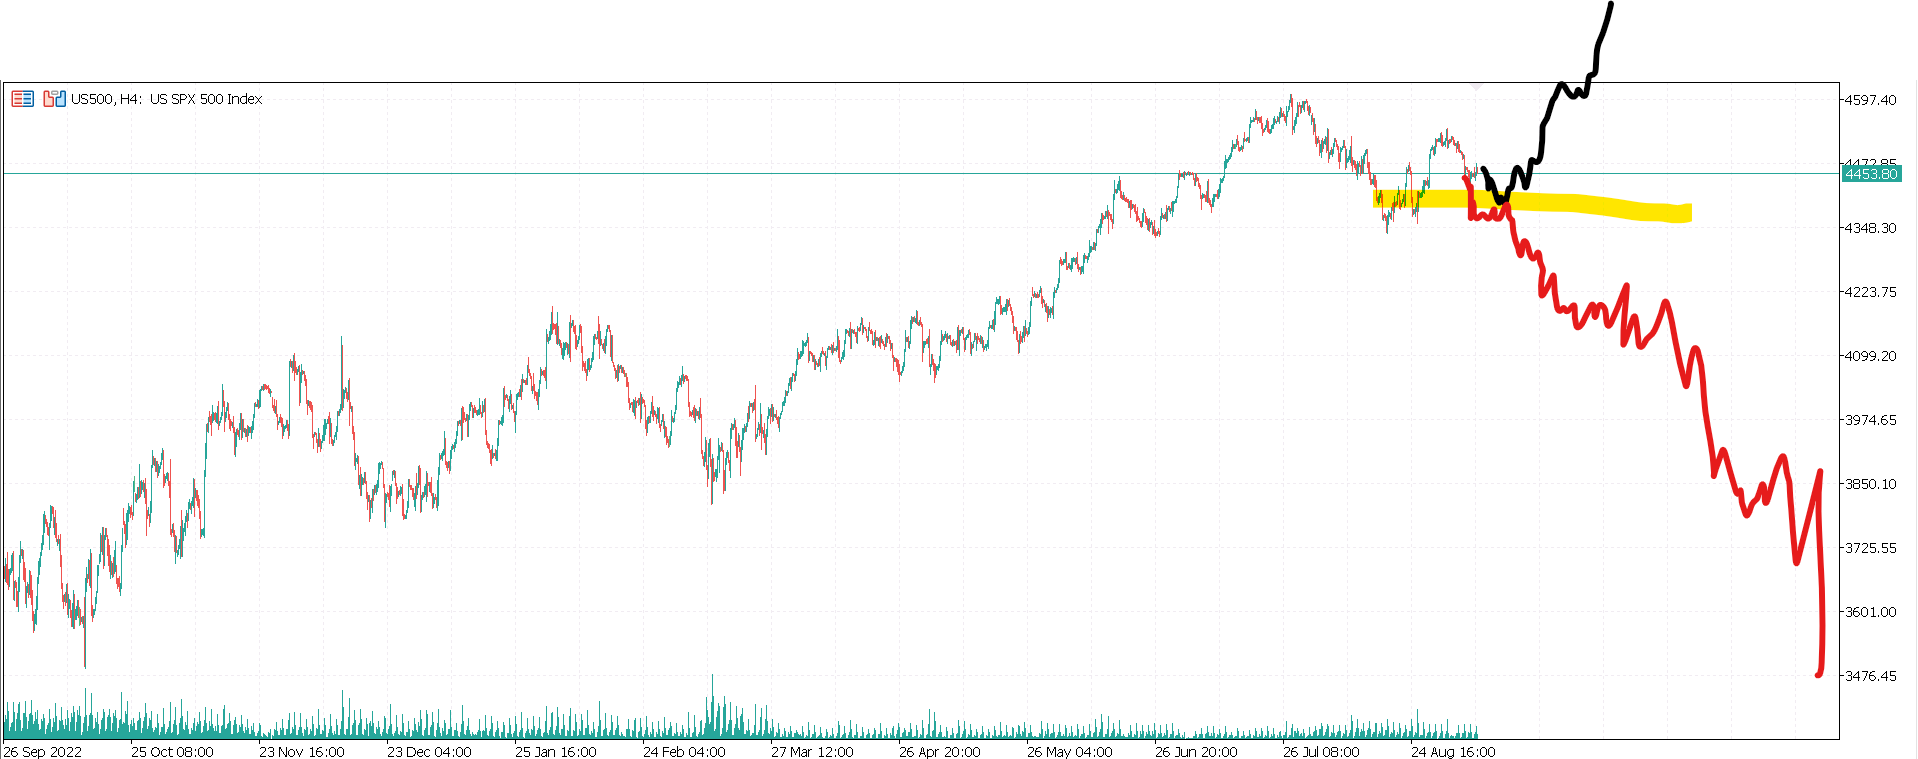
This small chart W structure might be similar to the monthly chart.
That would be implying something much bigger. This would be essentially the same as the Nasdaq break setting up with a bigger stop run on top.
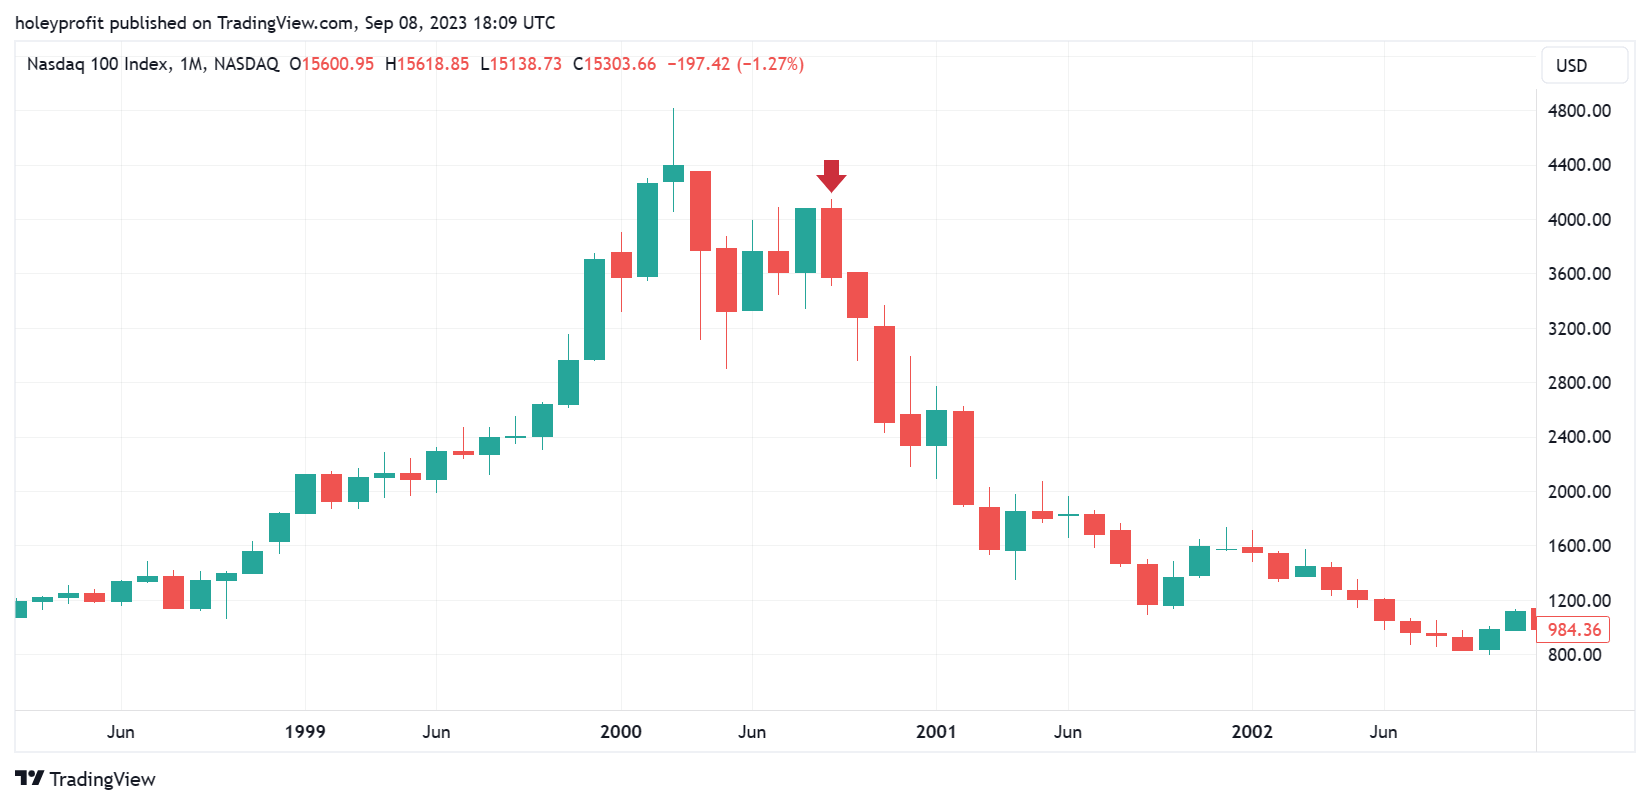
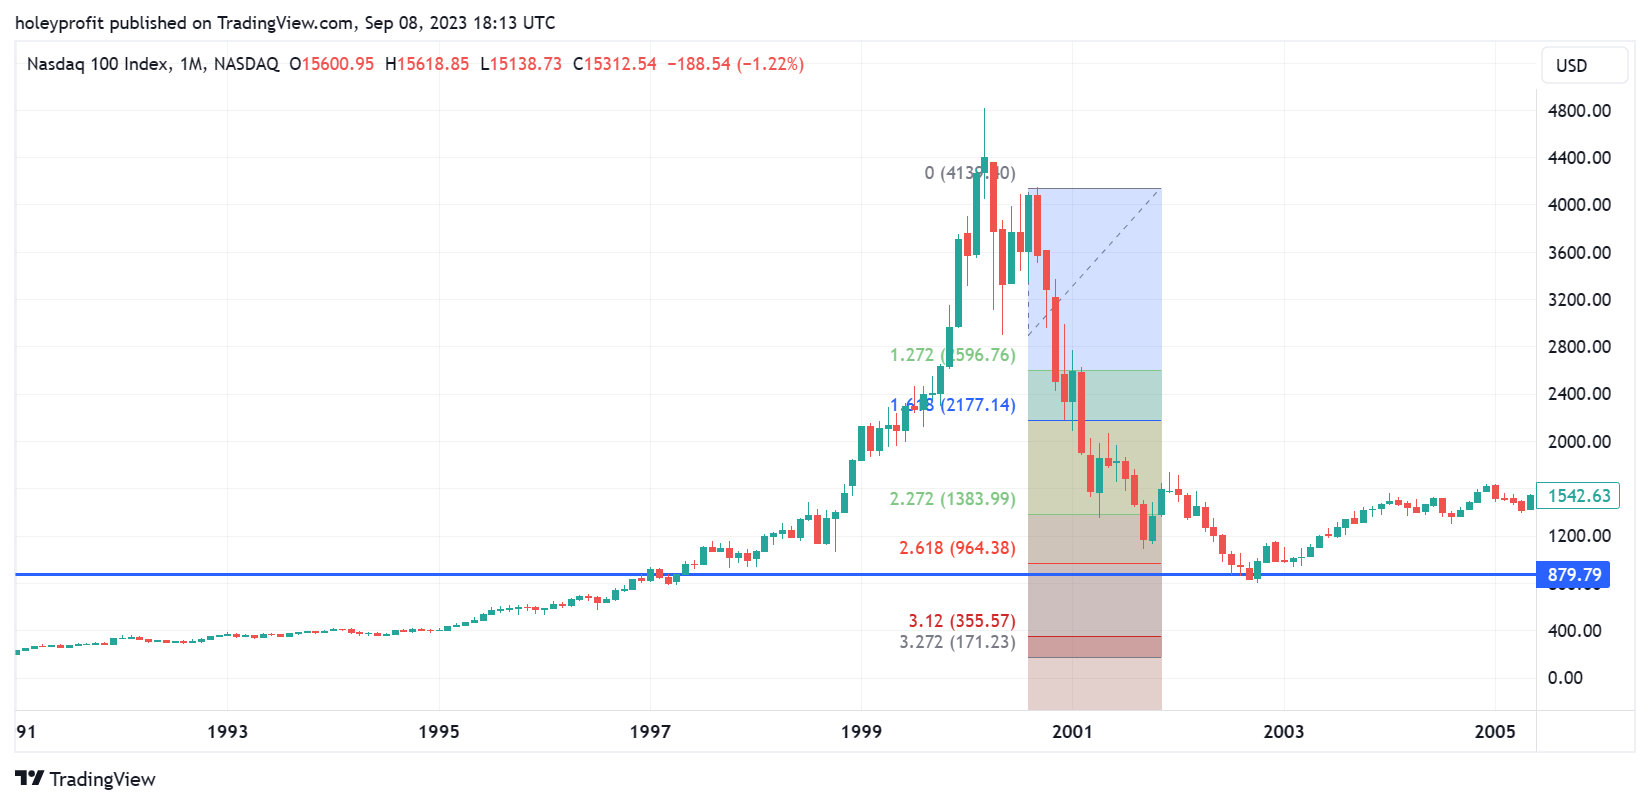
What happened from there in Nasdaq made all the sense in the world as per the fib norms. Totally textbook bear trend through 1.61 and to 2.61.
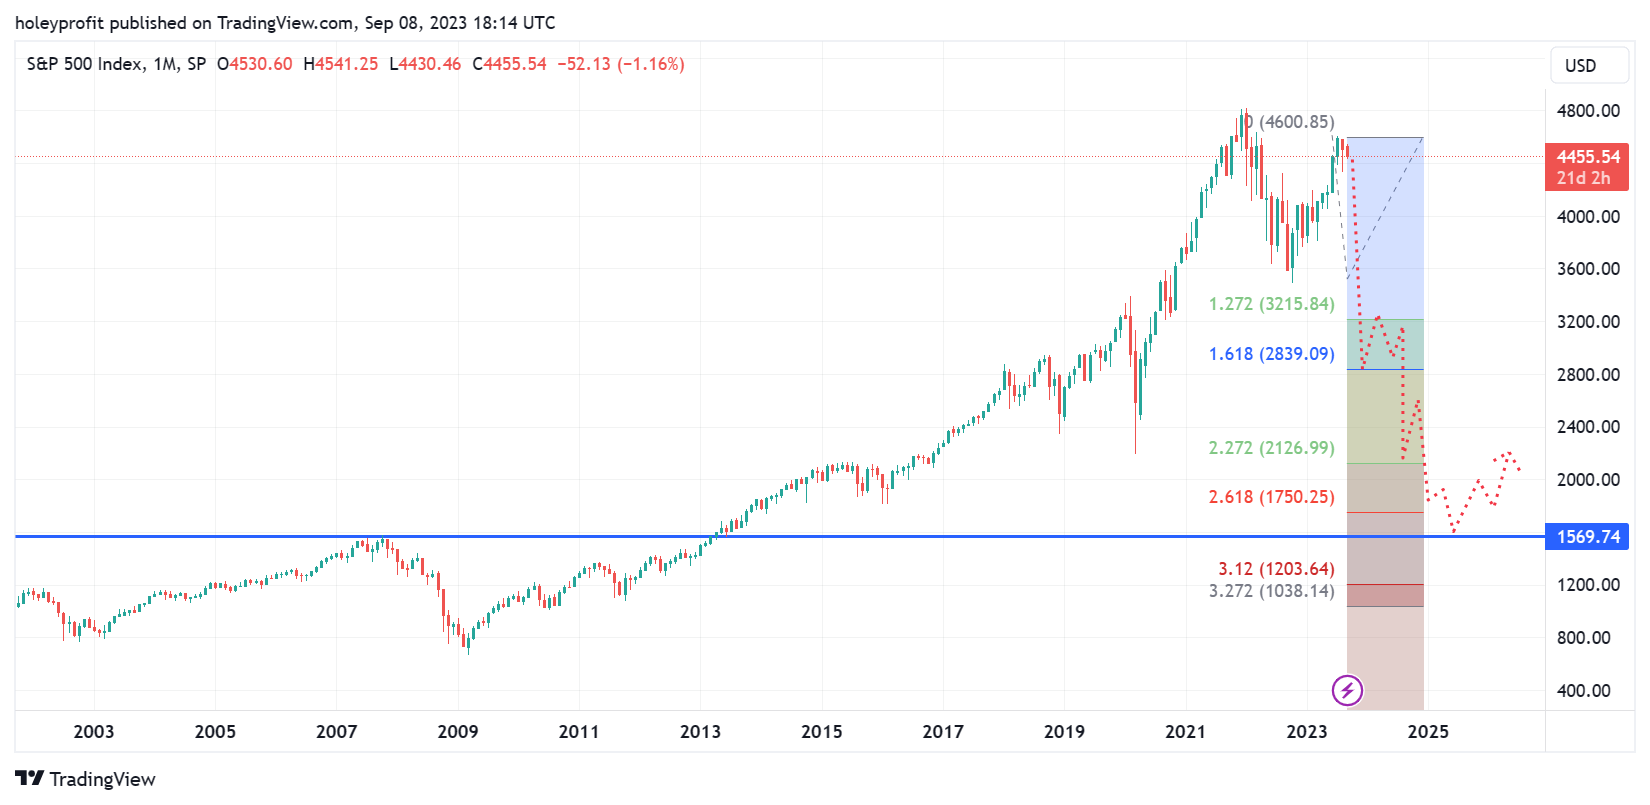
A like for like implied move in SPX would be horrific.
A Bear Develops Fast
A bull trap failure usually mostly happens within 1/3 of the time of the bull trap took to form. For example in the Nasdaq we have 3 months bull trap and then a breaking of that mostly in one month. The next month the low was broken. The approx ratio of 1:3 is fairly reliable (Although far from a hard rule).
This would tell us if this is a breaking bull trap we’d likely see all of 2023 gain (And latter 2022) taken out within the final few months of the year.
At the minimum, we’d be looking for this previous support low to be threatened.
Or put more simply, a drop of over 600 points in to the end of the year.
**Note - All of these numbers would assume the bull trap has ended. Hypothetically we could trade sideways for a few months and then we’d have to redo the numbers. This I think is unlikely, but important to note.
If we sell through the coming weeks to close the month lower we have formed a strong reversal pattern. With a strong full bodied bullish candle, a big wick candle (Hanging man) and then a bearish engulfing candle. I don’t think this is technically a “Shooting star” but whatever this is has a name - or should.
If this month closes down, we’re formed a 3 candle pattern on the monthly chart that does not appear often. It is coming off extremely important resistance levels.
I’m not saying that 100% means the market will crash, but I am 100% sure a lot of market crashes started just like that.
“Timing” the Crash
At this point I can make a very accurate template of price moves and approximate timing extrapolating the Nasdaq break to our current chart. If it is the same, it should be easy. As always, forecasts are descriptive and not prescriptive.
Simple observations:
Nasdaq comes down in 3 candles (And then gets to the big 1.61)
Second bull spike out engulfed by first bear candle.
Next bear candle tests low.
After a shallow bounce the break to 1.61 is made.
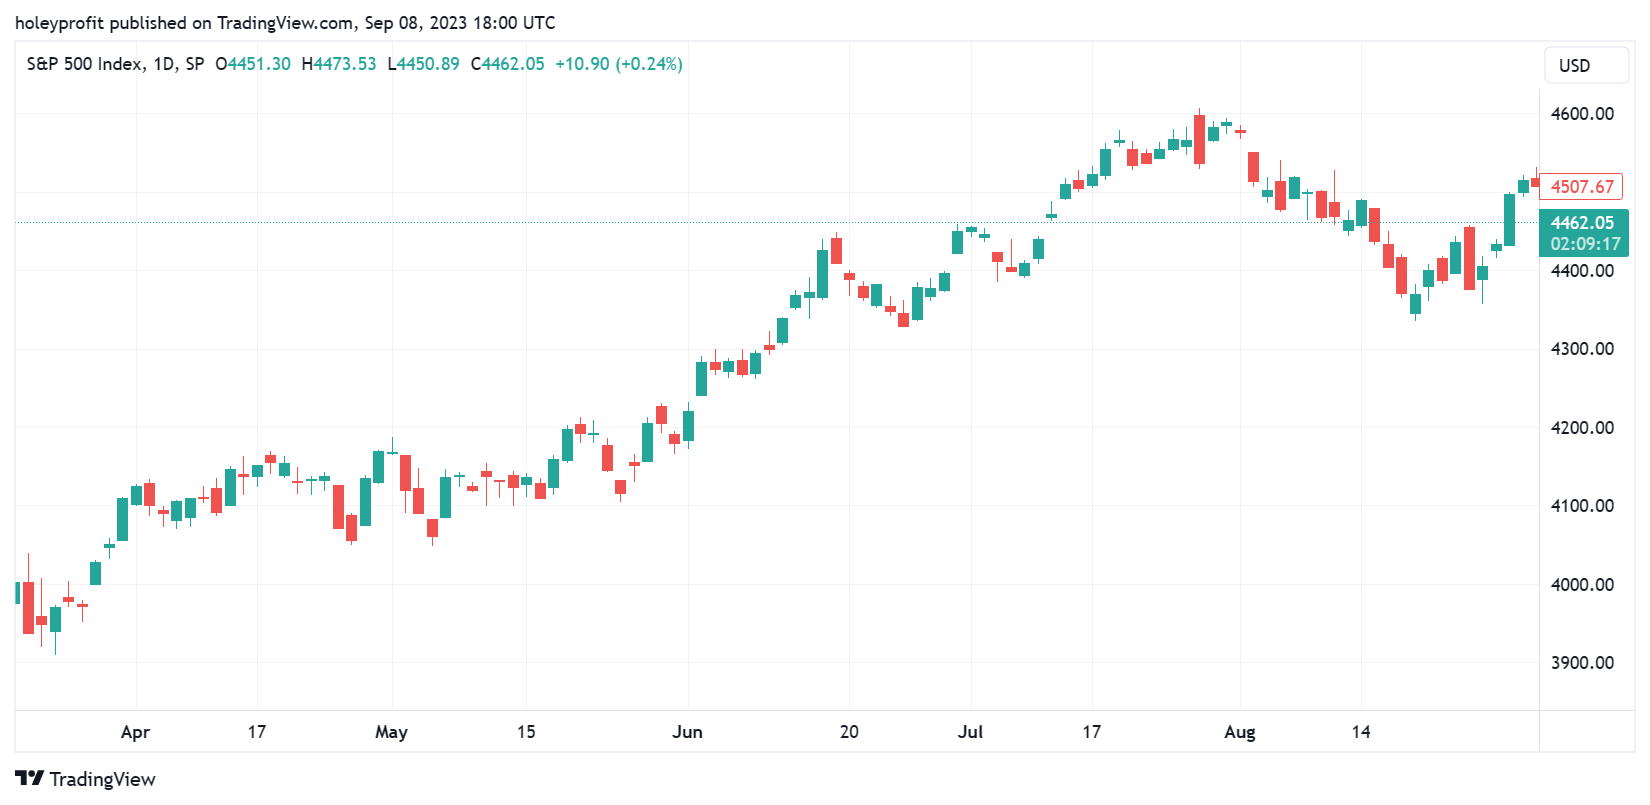
We can easily convert these onto the current SPX chart by looking at a 6 month chart.
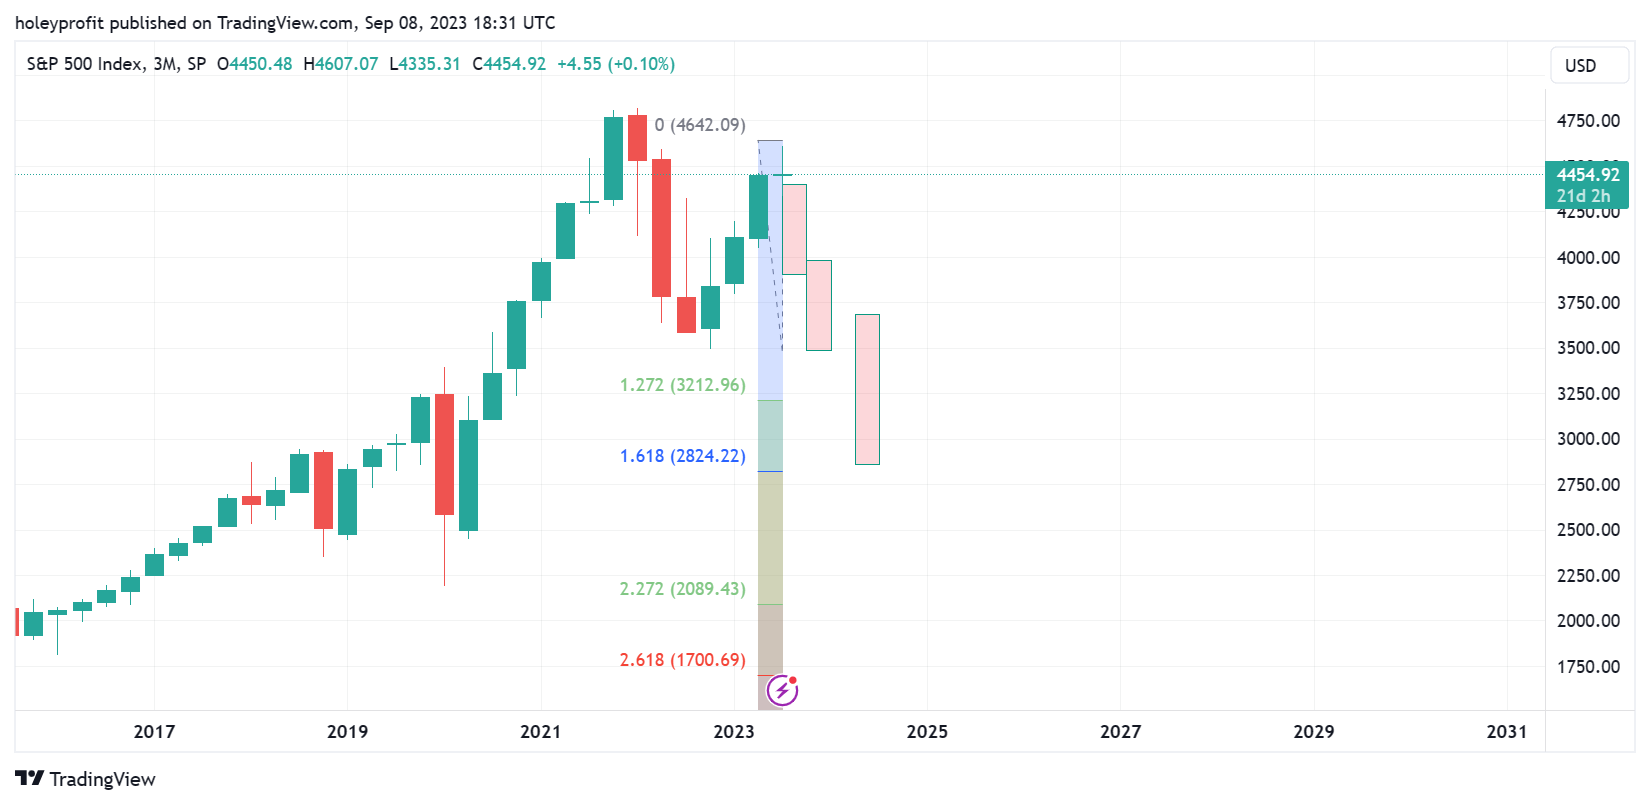
And the like for like forecast would be:
By end of year SPX to have traded 4000.
By March 2024 SPX traded 3600.
By June 2024 SPX traded 2900.
Then a period of chop for 6 months or so and more down trending.
Bear Break Pending
This is starting to feel a lot more realistic. I’ve learned fading big trends that it’s more profitable to bet on the thing that happens most often than the thing that happens only once which has skewed my bias recently bullish, but this type of action has real potential to become a bear break.
Under certain conditions I’ve found SPX to be almost impossible to lose on running certain long strategies (As such, I use these) but that is entirely contingent upon not holding bad positions and getting rugged. We’re starting to see conditions that are more inline with a rug than a bull trend.
I’ve been long a lot 2023 during times when people have said it was really risky because I could get rugged and I’ve never worried about that because I am strong technically with bear setups. No one has ever seen me get rugged. I get stopped out before that nastiness happens. Expecting I’d spot a break makes me comfy long.
Through the recent candles I’ve seen things that have made me worried about a break. This was meant to be a trend section in a bull move. Through the drop here this got progressively more sketchy.
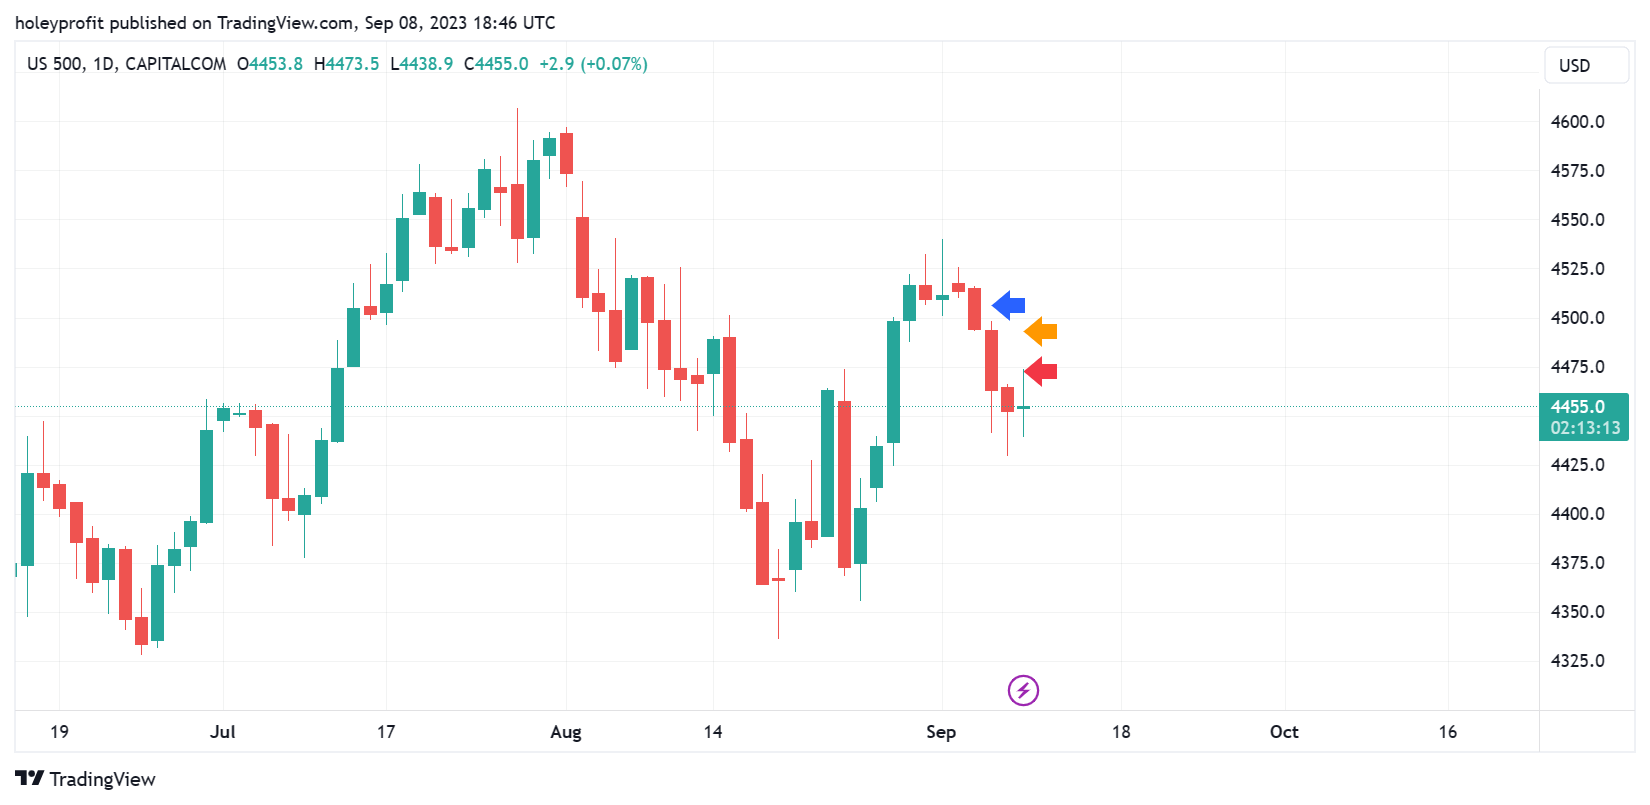
Blue - This should be the low if this is good, I’ll buy here.
Orange - Not liking is so much. Will try one more buy.
Red - Eek. Let’s make bear plans.
This is about how many candles I expect it to take me to get the memo things might not be okay. We can use a similar system on monthly.
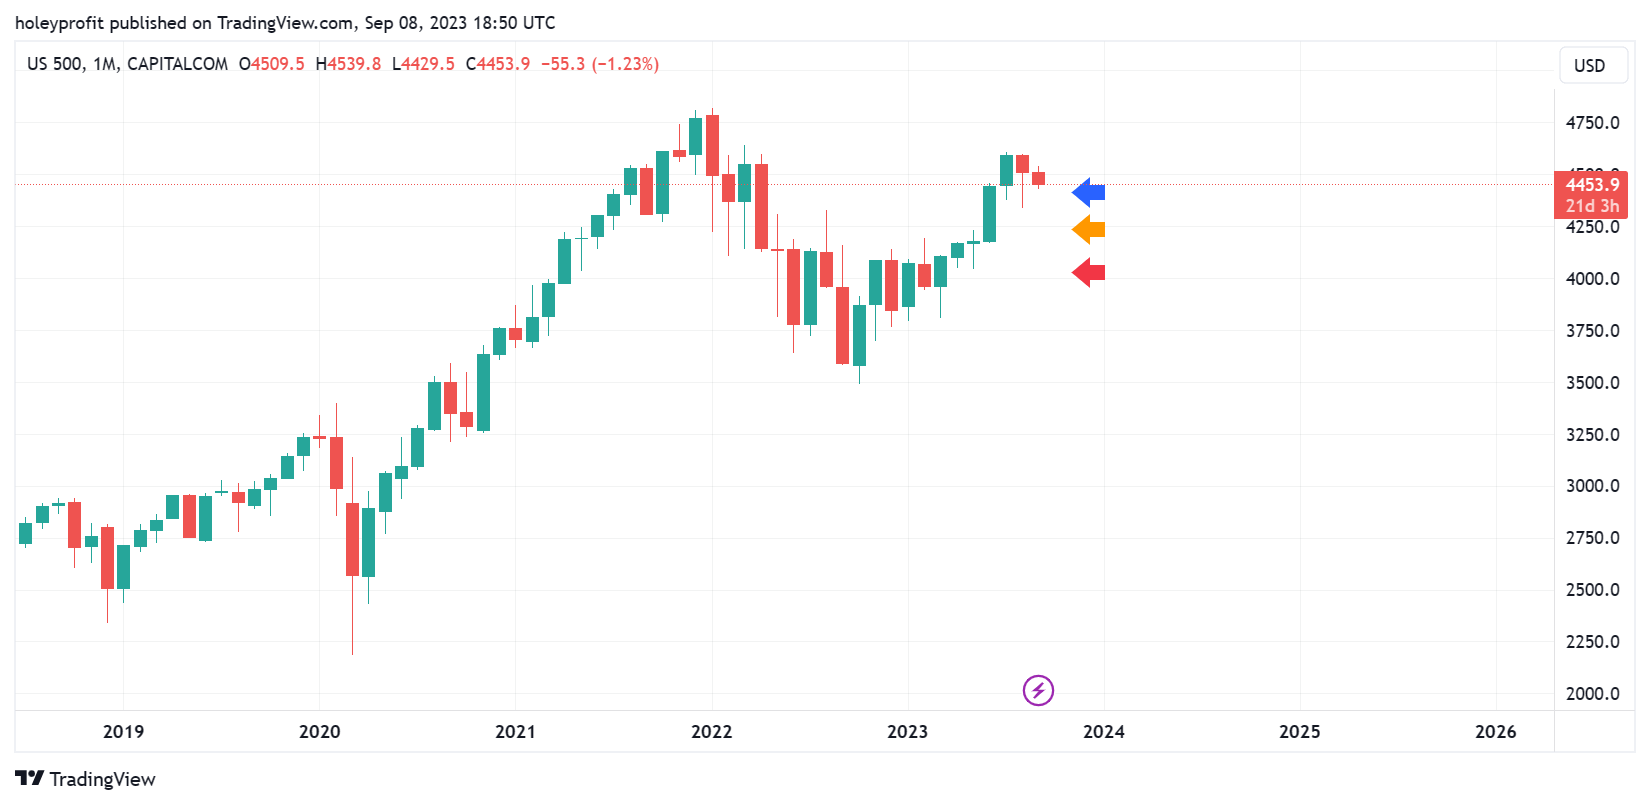
We’ve recently been at the ideal time to buy if a bull move spot but this action is threating to take us into spots where our monthly bias has to be firmly bearish.
Bulls can come in at 4350 sort of zone and make this just a little bear trap. The most nominal of moves when viewed later in context. So incredibly small you’d have to look specifically for that bit to see it. However, if this does not happen we might have begun a series of breaks.
A series of breaks starting on smaller timeframes and scaling up to monthly ones.
If the small patterns become monthly ones, these will be major headline events.
This feels like a crux point coming up. If we hold and rally there’s probably no swing bear trade for at leas 6 months. At some higher price than today. If we persist and make the break, we go back to be fully focused on bear market strategy (As was the original intention of our work) because the bull trap might be over.
If we do go into a bear market it will either be entirely unlike every other one in history or it will be reasonably easy to forecast all the big swings of it with simple fib rules. We’ve covered these extensively in previous posts but if breaks setup we’ll go over them again and look at more real examples.
This looks terrible now. I don’t think there’s support until at least 100 points lower so I am just trying to get tight stop shorts on, move stops to even and then wait to see what happens. I might be interested in buying around 4350. Failure of 4300 now I think would be very likely full uptrend failure.