

Butterfly Blow Off Failure
Trend Continuation

This is part of a series of strategy posts.
Once all strategy posts are up, they will be linked together. Initially there will be placeholders for links - Marked “(Link)”. This is because all posts need to be published to be able to interlink them. Please check back later for complete interlinking.
The original series of posts will contain 15 strategies. All of them time tested and ones I’ve personally used to make a living in markets for over 10 years. These will all be free. Multiple additional posts will be added for paid members. Discussing advanced strategy, nuances and covering the common questions we’d expect about the strats.
Strategy Name:
- Butterfly Blow Off Failure
Strategy Type:
- Momentum Continuation
Strategy Premise Overview:
- The Butterfly Blow Off Failure strategy identifies potential market scenarios where the harmonic butterfly pattern, typically a reversal signal, fails to hold. This failure indicates stronger momentum continuation rather than a reversal, providing opportunities for trend-following trades.
-This is a counter strategy to the Butterfly Blow Off Strategy. The idea here is the butterfly will signal the reversal level for us and if that is not the reversal level, then the trend will very often continue and we want to ride momentum.
Conditions for Use:
-One way we can use this strategy is using all of the exact same criteria as the Butterfly Blow Off Strategy and just trading the failure of that strategy.
-We can also use this when we think we’re in the middle of trends. Basically assuming if the butterfly risk of reversal fails the trend is “Safe” to continue to follow.
-The basic premise of this strategy is to aim to spot the points at which a possible trend reversal has failed and there is good odds betting on strong continuation. As such, the optimal conditions for it are ones in which we have some other reason to expect good trending conditions. For example, in Elliot wave 3.
- We can use this strategy at big support or resistance levels to spot an important breakout but an easier way to use this strategy is using it for momentum decisions between levels when we have a bias towards the next level hitting. This method can then be used as a means of confirming momentum is still strong (And can also serve as a means of trailing stops on profitable positions).
-We can also use this strategy as a means of trailing stops rather than taking entries. Trailing our stops when possible butterfly reversals fill. Protecting us from reversals but allowing us to ride the trend is reversals fail.
Planning Entries:
-There are varying levels of aggression on this strategy. The most aggressive is setting pending stop orders to enter a breakout of 2.20. This is a bet on strong momentum.

- A similar version of the same would be to set an alert for the 2.20 break and then use some sort of candle patterns for entry and stop signals.

- The conservative way to trade this is to set a pending order to enter a retest of the 1.27 fib.

Planning Stops:
-The maximum tolerance for this as a successful breakout is price will retest and marginally spike out the 1.27. The maximum tolerance is just past there (100% retracement would be good for a static rule).
- If betting on the momentum moves then it is best to have stops tight. Usually based on price structure and/or candle patterns. There is no point in putting wide stops on aggressive entries. Might as well just get out early and look for the limit order entry.
-Note that the main tendency bet on here is harmonics will either give extremely accurate reversal levels or they will fail spectacularly. As such, if we’re betting on a failure we’re looking for a lot of momentum. We can be impatient with losers. If there’s not a lot of momentum we’re not seeing what the setup looks for.
---
Trade Execution Plans
Bullish Execution Plan for the Butterfly Blow Off Failure Strategy
Step 1: Market Analysis
- Identify a market with a persistent downtrend and signs of an aggressive spike or blow-off move.
- Confirm the trend direction (downtrend) by analyzing lower lows and lower highs.
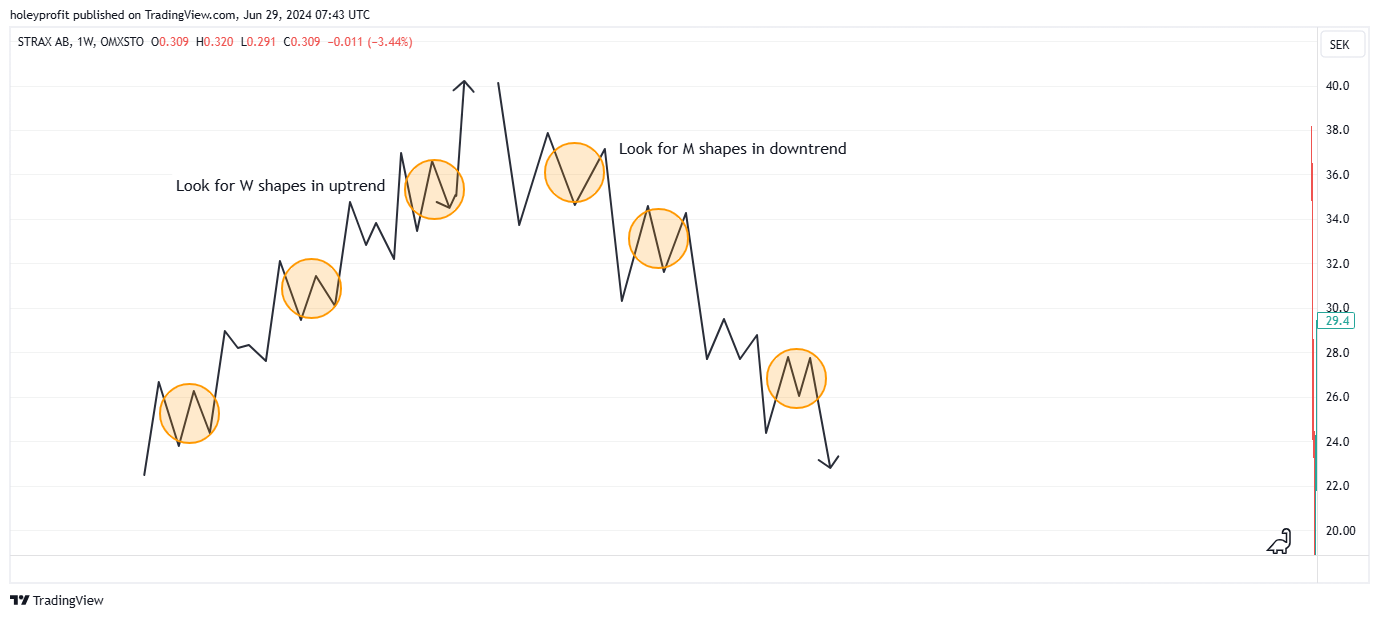
Step 2: Identify the W/M Structure
- Look for the formation of a W-shaped structure in the price action, indicating a potential harmonic butterfly pattern. This includes:
- X to A Leg: Identify the initial move down.
- A to B Retracement: Look for a significant retracement higher.
- B to C Leg: Identify the second leg down forming the aggressive spike.
- C to D Retracement: Observe the pullback which ideally fails to hold as a reversal.
Step 3: Entry Signal
- Enter the trade after the failure of the harmonic butterfly pattern, specifically after the price breaks above the 2.20 Fibonacci extension of the BC leg.
- Optimal entry point is on a retest of the 1.27 Fibonacci extension of the BC leg, where price action confirms continuation of the uptrend.
-The assumption of the setup is if a reversal does not come before the 2.20 fib the deepest retracement will be a retest of the 1.27.
Step 4: Stop Loss Placement
- Tight is right. When betting on momentum wide stops make no sense.
-Widest stop would be under the lows/highs of the start of the harmonic.

Step 5: Target Setting
- Initial target is the 2.81 Fibonacci extension of the BC leg, where resistance may initially appear.
- Moves can extend far further in a strong trend. This is a setup where it’s ideal to use trailing stops. Locking in profits as we get close to fibs and seeing if they break.
Bearish Execution Plan for the Butterfly Blow Off Failure Strategy
Step 1: Market Analysis
Identify a market with a persistent uptrend and signs of an aggressive spike or blow-off move.
Confirm the trend direction (uptrend) by analyzing higher highs and higher lows.
Step 2: Identify the M/W Structure
Look for the formation of an M-shaped structure in the price action, indicating a potential harmonic butterfly pattern. This includes:
X to A Leg: Identify the initial move up.
A to B Retracement: Look for a significant retracement lower.
B to C Leg: Identify the second leg up forming the aggressive spike.
C to D Retracement: Observe the pullback which ideally fails to hold as a reversal.
Step 3: Entry Signal
Enter the trade after the failure of the harmonic butterfly pattern, specifically after the price breaks below the 2.20 Fibonacci extension of the BC leg.
Optimal entry point is on a retest of the 1.27 Fibonacci extension of the BC leg, where price action confirms the continuation of the downtrend.
Step 4: Stop Loss Placement
Place the stop loss just above the 100% Fibonacci retracement level of the BC leg.
This placement allows for some volatility while protecting against significant adverse movements.
Step 5: Target Setting
Initial target is the 2.20 Fibonacci extension of the BC leg, where support may initially appear.
Consider holding for further targets such as the 2.61 Fibonacci extension or beyond based on strong momentum continuation to the downside.
Step 6: Trade Management
Monitor price action for signs of strong momentum continuation to the downside.
Adjust stop losses and targets dynamically based on market conditions and price action developments.
Use trailing stops to protect profits and maximize gains as the downtrend progresses.
Step 7: Exit Strategy
Exit the trade if there are signs of weakening momentum or if the price fails to sustain below key Fibonacci extension levels.
Be prepared to exit early if the market shows signs of reversing despite initial bearish signals.
HoleyProfit’s Strategies is a reader-supported publication. To receive new posts and support my work, consider becoming a free or paid subscriber.