

Butterfly Continuation Failure Pattern in a Trend
Trend Continuation

This is part of a series of strategy posts.
Once all strategy posts are up, they will be linked together. Initially there will be placeholders for links - Marked “(Link)”. This is because all posts need to be published to be able to interlink them. Please check back later for complete interlinking.
The original series of posts will contain 15 strategies. All of them time tested and ones I’ve personally used to make a living in markets for over 10 years. These will all be free. Multiple additional posts will be added for paid members. Discussing advanced strategy, nuances and covering the common questions we’d expect about the strats.
You can join as a paid member for only $15.
Strategy Name:
-Butterfly Continuation Failure Pattern in a Trend
Strategy Type:
-Trend Reversal Following a Pattern Failure
Strategy Premise Overview:
-The Butterfly Continuation Failure Pattern in a Trend strategy identifies the failure of correction phases within persistent trends, leveraging the harmonic butterfly pattern to spot major reversals.
-This strategy focuses on identifying a failed two-leg correction, providing opportunities for counter-trend trades after aggressive trend corrections fail.
-This strategy particularly looks to spot very early when an unusually strong trend reversal is setting up and to get into that very early.
-This strategy is a counter strategy to the Butterfly Correction in a Trend Strategy.

Conditions for Use:
-This strategy triggers when there’s been a failure of the Butterfly Continuation. All conditions for the setup of this trade are identical until the butterfly fails. If you have a good understanding of the setup of the continuation strategy, skip to “Planning Entries”.
-This strategy is for use inside of a developing trend. The market should have a clear sense of direction. Some obvious breaks should have been made.
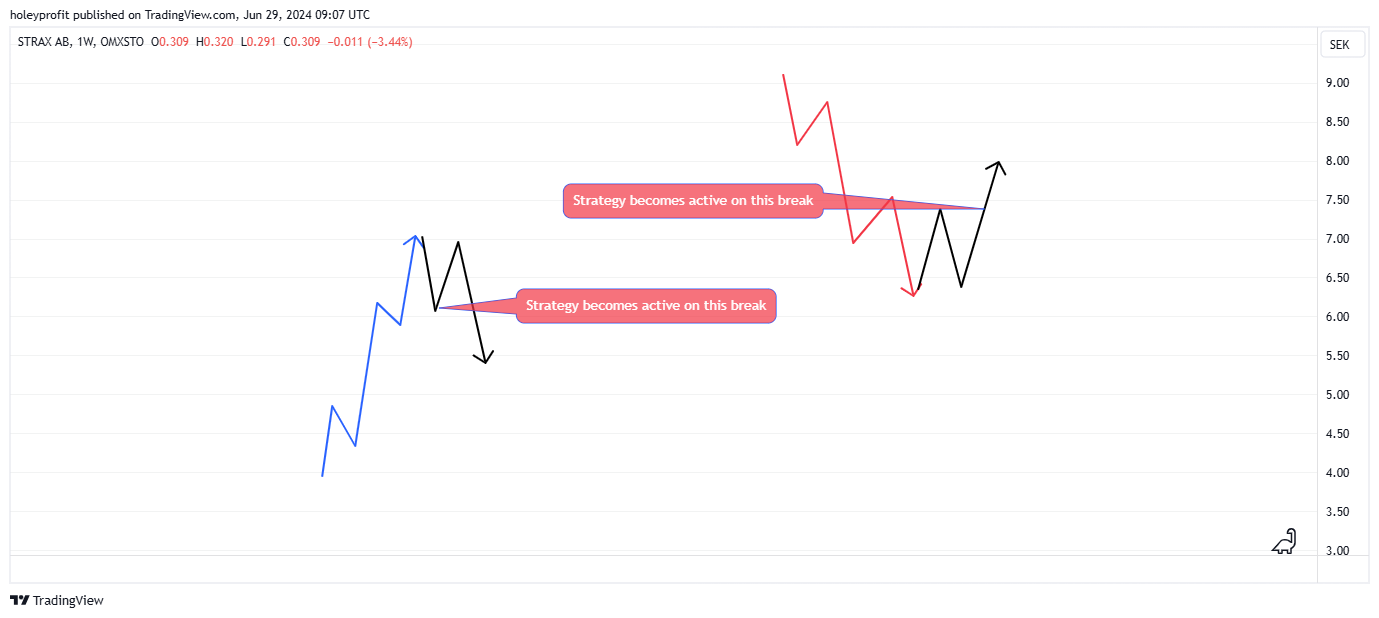
-There are multiple conditions for this strategy to fire. First, we need to see a pullback against the trend. Then it starts to attempt to make a trend continuation. Usually, there will have been many successful versions of this trend continuation pattern recently and this will feel like “Business as usual” for the trend - but no new breakout is made.
-A sharp second corrective leg comes, spiking out the previous correction. This will have formed an “M” shape if we were uptrending and a “W” shape if we were downtrending.
-When these conditions are met, we can map out the potential harmonic pattern and plan our trades.

Planning Entries:
-Planning around this trade depends on how the strategy is being used. The strategy can be used proactively to plan for reversals. If for some reason you think something is going to make a big turn this strategy can be used to map out the important breakout levels where a correction becomes a reversal.
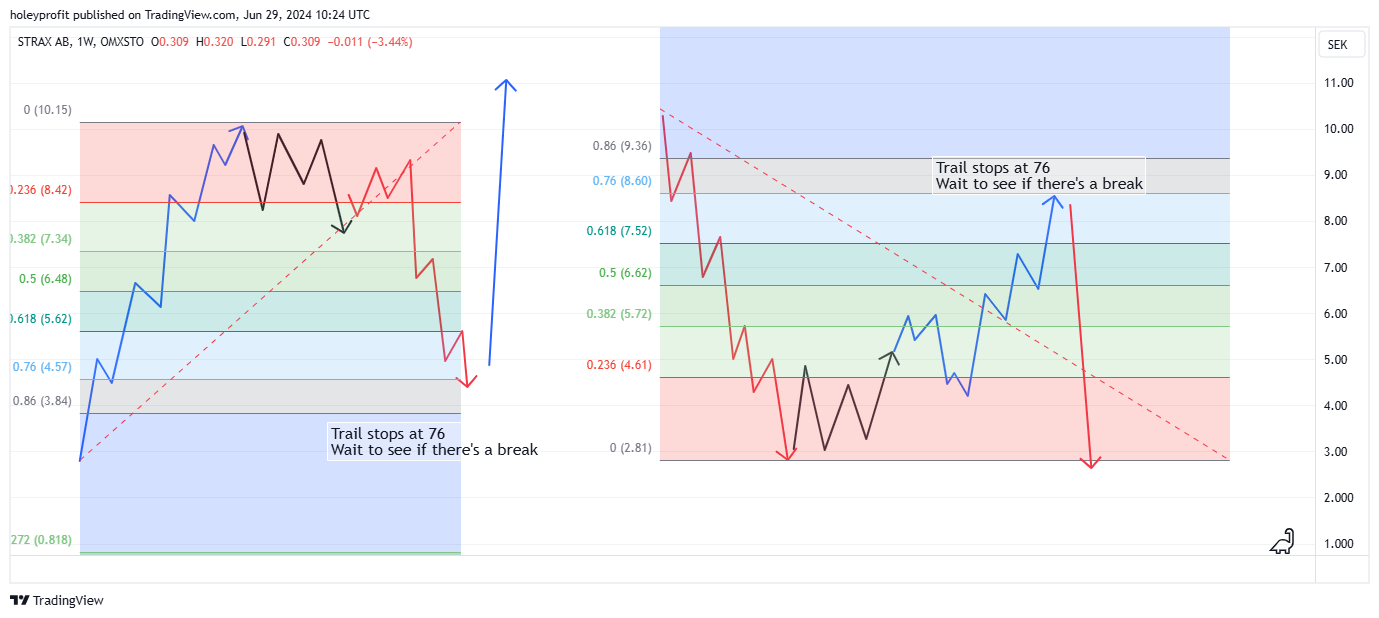
- Another way this can be used is reactively. Using it to warn you to stop trying to follow a trend and start to take more seriously the risk of a reversal. It’s also a good method of trailing stops - by planning where you think there’s a trend failure.
-If you’re following a trend and it is turning you’ll get a few points where you get big false signals. In the formation of the possible harmonic there will usually be what looks like a 76 Continuation Trade that fails to make the breakout.

-The next step as a trend follower would be to plan the Butterfly Trade.
-These two failures would give you the memo that it’s not worth betting on the trend resuming again until at least 76% of the last big swing was retraced (At which point we have the 76 Continuation or Failure setups.
-If we were trading this as a reversal strategy first we’d be looking for the failure of the 76 Continuation. The 76 Failure strategy takes us to the 1.27 and then from there we can use the 1.27 Retest and Continuation Strategy or the 1.27 Continuation Strategy.
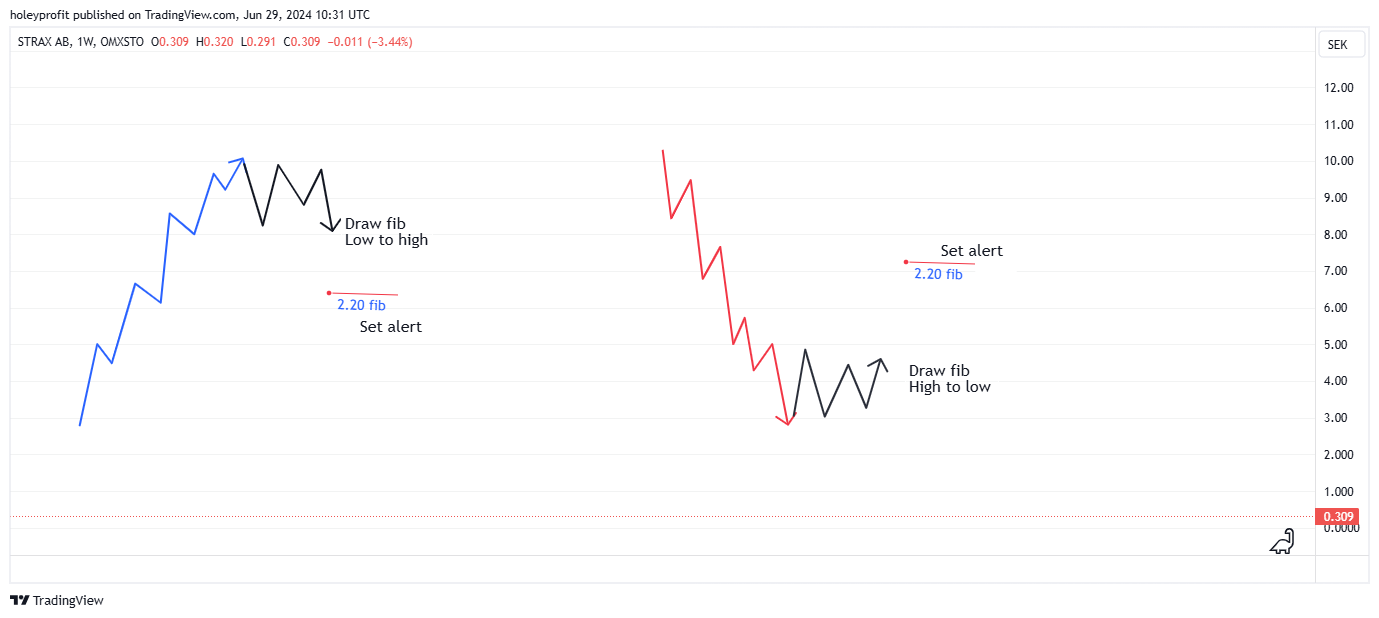
So depending on how we’re using this strategy the failure of the butterfly at the 2.20 level is either our big red flag warning us to stop following the trend or it’s a part of our road map of things we expect to see using a sequence of other strategies and it tells us there’s a lot of value to trailing stops and looking for a bigger move.
Planning Stops:
-When trading based on the butterfly break we’re trading based on momentum and we are best to use tight stops based on structure and candle patterns.
-Outside of the standard risk of just having the wrong direction, there can be false reversals to deal with. Here you’ll pick up losing entries looking for momentum.

Often the second breakout is much better and an easier trade. So you can also try a second breakout trade if you take small stops quickly.

Planning Targets:
-Minimum target for this move is the 2.61 Fibonacci extension of the CD leg of the harmonic pattern. Trailing stops can be used to manage the trade beyond this level.
-A good method of trade management is trailing stops as we get close to the extension fibs.
- Major trend decisions come if we retrace 76% of the previous trend.

-From here, our 76 Continuation or Failure setups take over.
Typical Win Path:
-When this trade comes, it is usually characterized by extreme momentum. The break of the 2.20 extension often signifies a significant trend failure.
-The move into the 2.61 area is typically strong and swift, with minimal deep pullbacks. Trailing stops behind local structures usually keep you in the trade.
-The move towards the 4.23 area, if it continues, will often be expressed as a parabolic jump or crash, depending on direction.
-Major decision come around the 76% fib. Often this move is not a full reversal, just a much bigger correction.
-Or we break the 86 and continue to the 1.27. Triggering our 1.27 Continuation Strategy.

Typical Lose Path:
-The loss path for this setup is also characterized by extreme momentum, but against the trade. When this signal fails as a reversal pattern, it often marks a trend continuation.
-In such cases, use the original Butterfly Continuation Pattern strategy to recover losses.
-The propensity for big harmonics like to mark major trend decisions is very high. Most often when we have a harmonic setup we’ll enter into a series of swings that we have strategies for that will do well. However, if it gets excessively choppy it’s good to just sit out for a while and wait for some clean swings to make new plans.
Why Strategy is Expected to be Successful:
-The strategy leverages the failure of the harmonic butterfly pattern as a signal for trend reversal, capturing significant reversal moves.
-Provides clear entry and exit points based on Fibonacci extensions, allowing for precise risk management and favorable risk-reward ratios.
-When the trade works, it often results in substantial gains due to the extreme momentum involved in trend reversals.
-This signal appears early in most significant trend reversals.
Known Risks and Weaknesses:
-The obvious weakness of this strategy is it requires you to enter into moves that are already massively extended and still against the prevailing trend. That’s how high's are bought and lows are shorted. The risks of this can be negated with good stop losses since the strategy is specifically betting on sustained momentum.
Trade Plan Execution:
Bullish Execution Plan:
Step 1: Market Analysis
Identify a developing uptrend with clear directional movements and recent successful trend continuation patterns.
Confirm the trend direction by analyzing higher highs and higher lows.
Look for a pullback against the trend followed by an attempted trend continuation that fails to make a new breakout.
Step 2: Identify Entry Points
Identify a sharp second corrective leg forming an "M" shape in an uptrend.
Confirm the formation of a double bottom and a breakout.
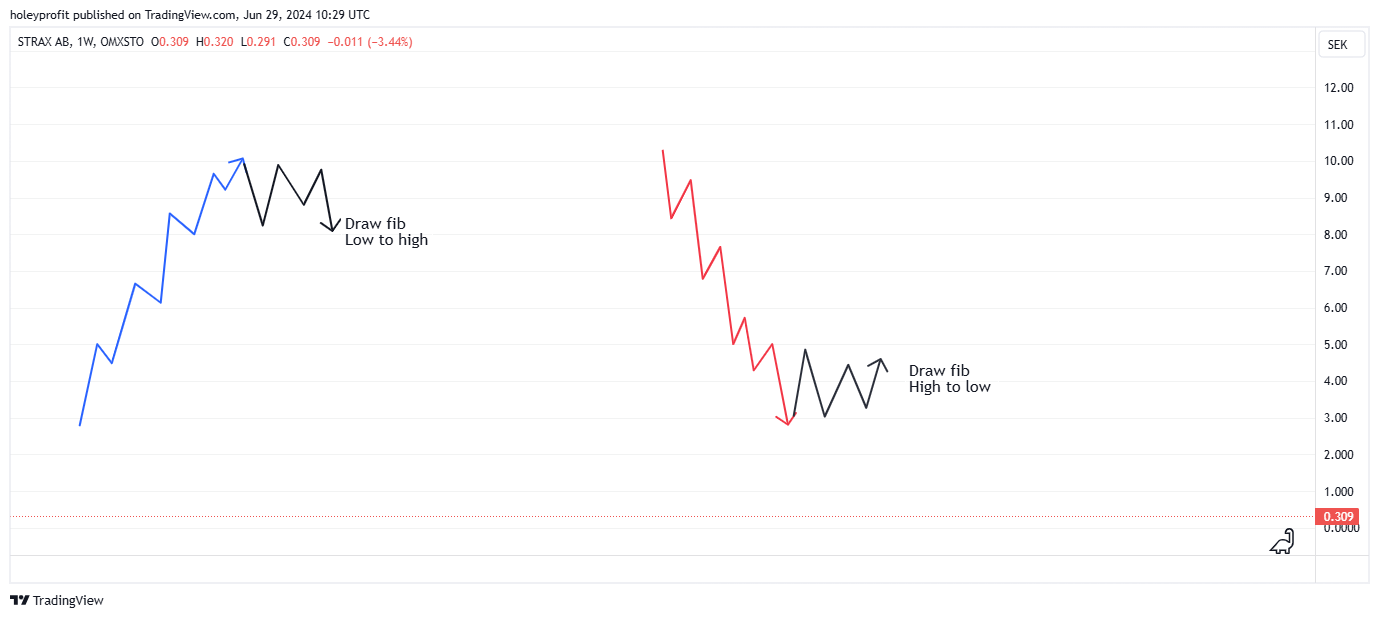
Draw Fibonacci extension levels on the BC leg of the harmonic pattern.
Step 3: Draw Fibonacci Extensions
Draw Fibonacci extension levels from the B to C leg of the harmonic pattern.
Identify the break of the 2.20 Fibonacci extension level as the signal for trend failure.
Step 4: Set Alert
Set an alert slightly past the 2.20 Fibonacci extension level to notify you when the price approaches this key level.
Step 5: Confirmation and Entry
Monitor price action for shallow retracements and signs of extreme momentum.
Enter a long trade by placing a limit order at the shallow retracement level.
Use tight stops based on local price structure and candlestick patterns.
Step 6: Place Stop Loss
Set a tight stop loss below the local price structure and recent swing low.
Alternatively, use candlestick patterns to determine the precise stop loss level.
Step 7: Manage Trade
Actively trail stops if things are going well - the bet is momentum.
Expect minimal deep pullbacks and trail stops aggressively behind local structures to stay in the trade.
Step 8: Set Targets
Minimum target is the 2.61 Fibonacci extension level.
A good bigger passive target is just before the 76% of the swing that the reversal is happening on.
If the 86 fib breaks, use the collection of strategies to deal with that;
Bearish Execution Plan:
Step 1: Market Analysis
Identify a developing downtrend with clear directional movements and recent successful trend continuation patterns.
Confirm the trend direction by analyzing lower lows and lower highs.
Look for a pullback against the trend followed by an attempted trend continuation that fails to make a new breakdown.
Step 2: Identify Entry Points
Identify a sharp second corrective leg forming a "W" shape in a downtrend.
Confirm the formation of a double top and a breakout.
Draw Fibonacci extension levels on the BC leg of the harmonic pattern.
Step 3: Draw Fibonacci Extensions
Draw Fibonacci extension levels from the B to C leg of the harmonic pattern.
Identify the break of the 2.20 Fibonacci extension level as the signal for trend failure.
Step 4: Set Alert
Set an alert slightly past the 2.20 Fibonacci extension level to notify you when the price approaches this key level.
Step 5: Confirmation and Entry
Monitor price action for shallow retracements and signs of extreme momentum.
Enter a short trade by placing a limit order at the shallow retracement level.
Use tight stops based on local price structure and candlestick patterns.
Step 6: Place Stop Loss
Set a tight stop loss above the local price structure and recent swing high.
Alternatively, use candlestick patterns to determine the precise stop loss level.
Step 7: Manage Trade
Actively trail stops if things are going well - the bet is momentum.
Expect minimal deep pullbacks and trail stops aggressively behind local structures to stay in the trade.
Step 8: Set Targets
Minimum target is the 2.61 Fibonacci extension level.
A good bigger passive target is just before the 76% of the swing that the reversal is happening on.
If the 86 fib breaks, use the collection of strategies to deal with that.
HoleyProfit’s Strategies is a reader-supported publication. To receive new posts and support my work, consider becoming a free or paid subscriber.