

Case for a Dramatic Drop in the Coming Weeks

In this post we’re going to make the case for the exceptionally uncommon thing of it being profitable to buy short term deep OTM puts.
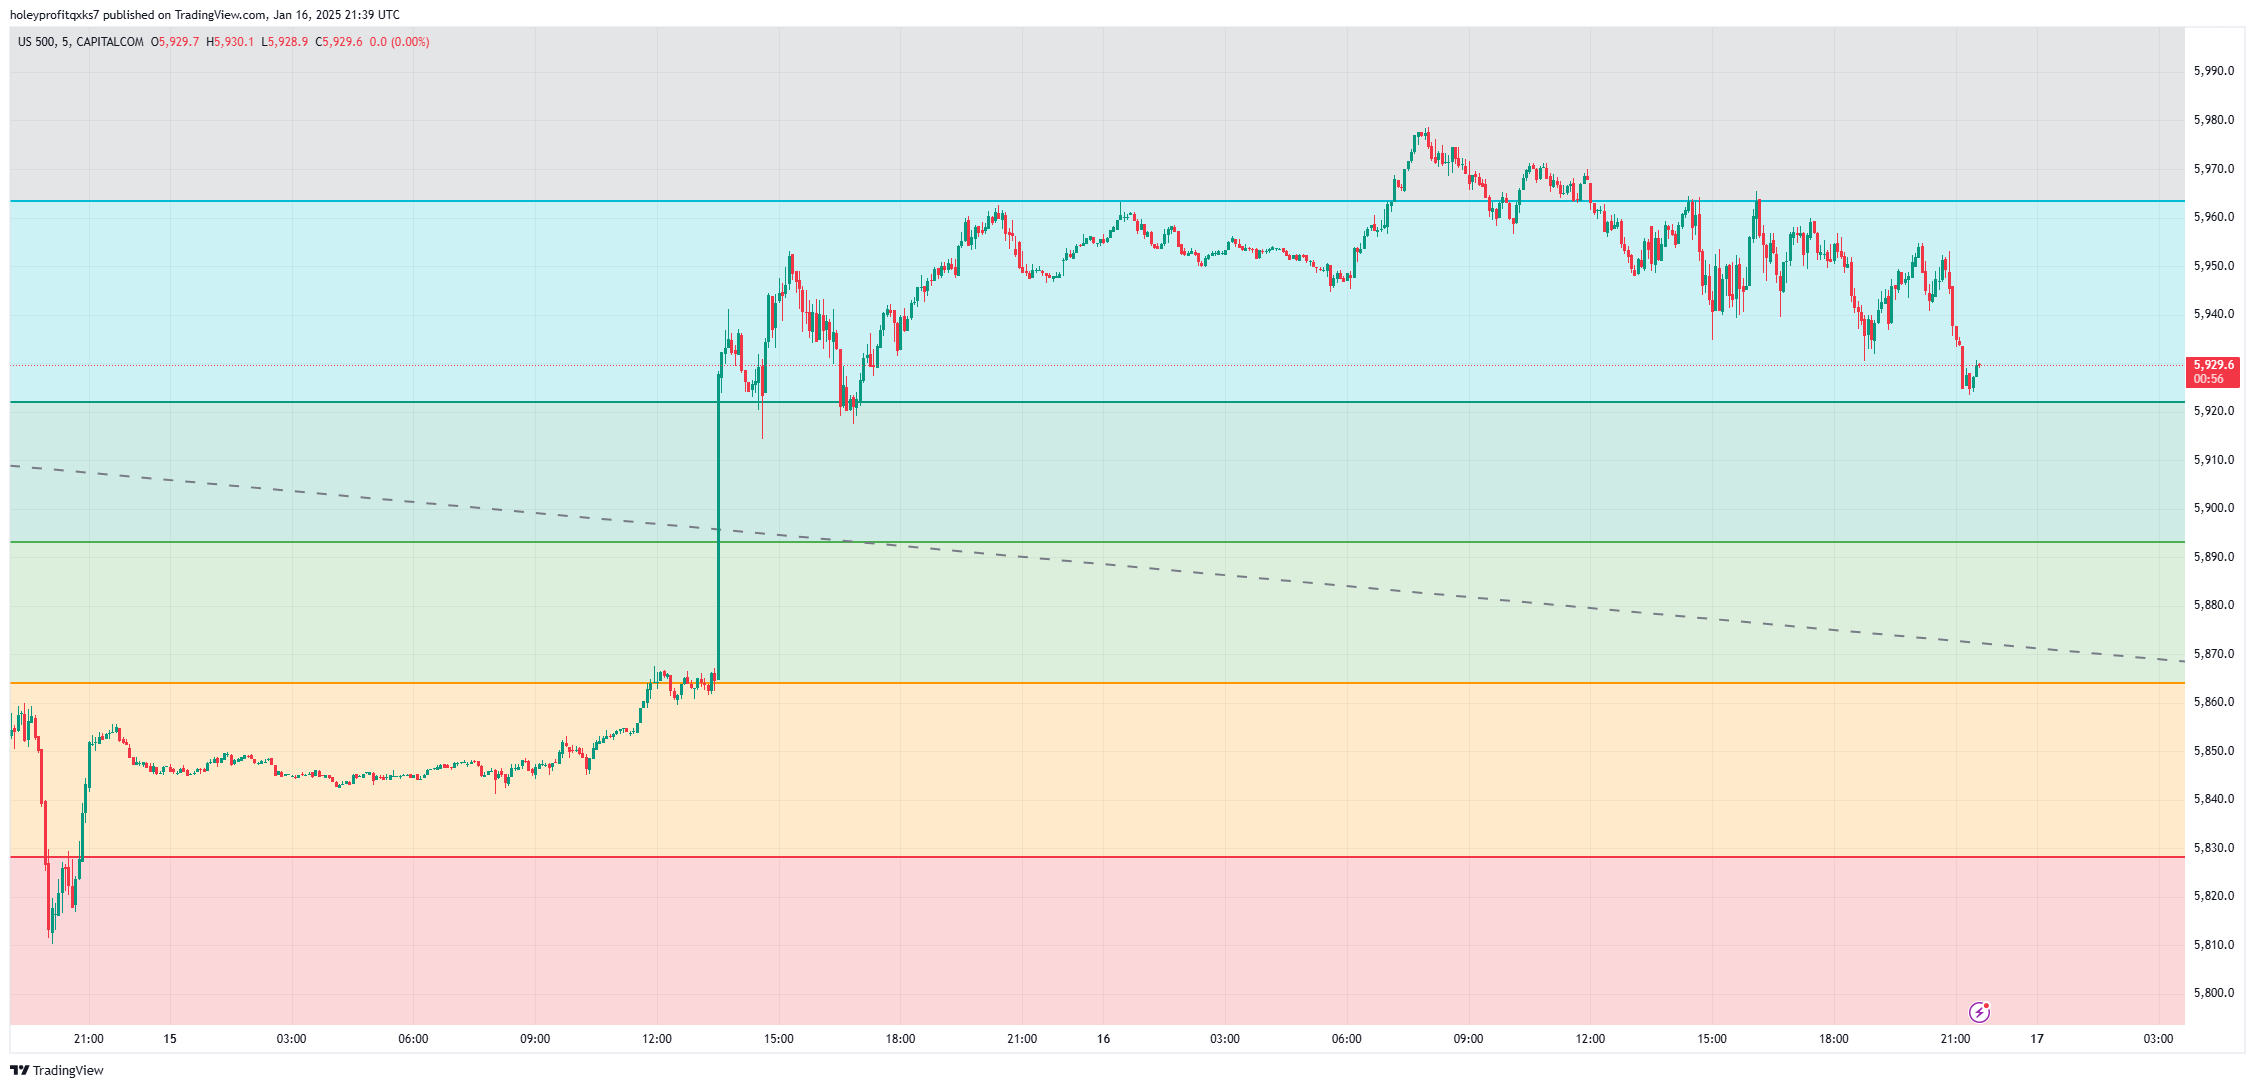
Today we got the characteristic spike into the big 76 fib spoken of yesterday

Which came with a head and shoulders pattern with the head heading a small spike out of the 76.

I’m always worried about this move here.

I’ve so many sad stories about that move.
But today we might have really seen the breaking of the head and shoulders. Relatively flat shoulders right on the 76 with the head fake.
The spike is important to worry about if you like to trade big, because it moves a lot fast - but even with the spike, the general forecast of a big move in the next couple weeks would be valid. A spike and rejection would be over within days - if not hours.
The case here the reasons to support 560 SPY puts having a greatly above average chance of printing sometime fairly soon. Based on a concurrence of different signals.
The levels for this are going to pretty much take care of themselves. It’s wild how everything converges around 5500 - 5000. Instead I want to focus on the case why IF this move was to happen it’d be rational to believe it will be a fast move and logical to deduce it’d be likely to come within a couple weeks.
First I’d like to note how any of my estimates of timing work. Since I am only interested in things that are repeatable and scalable over different markets how I make estimates of timing is trying to estimate how many candles it “Should take” to complete the pattern.
This is far from a science and ranges really screw things up - but throughout this I’ll try to show you how it makes logical sense we could expect these to happen inside a short timeframe.
When you’re talking about reasons for capitulation off a high and there’s a head and shoulders in the room, it’s polite to mention that first. Sure, it’s over rated and loses 65% of the time - but it’s an OG.

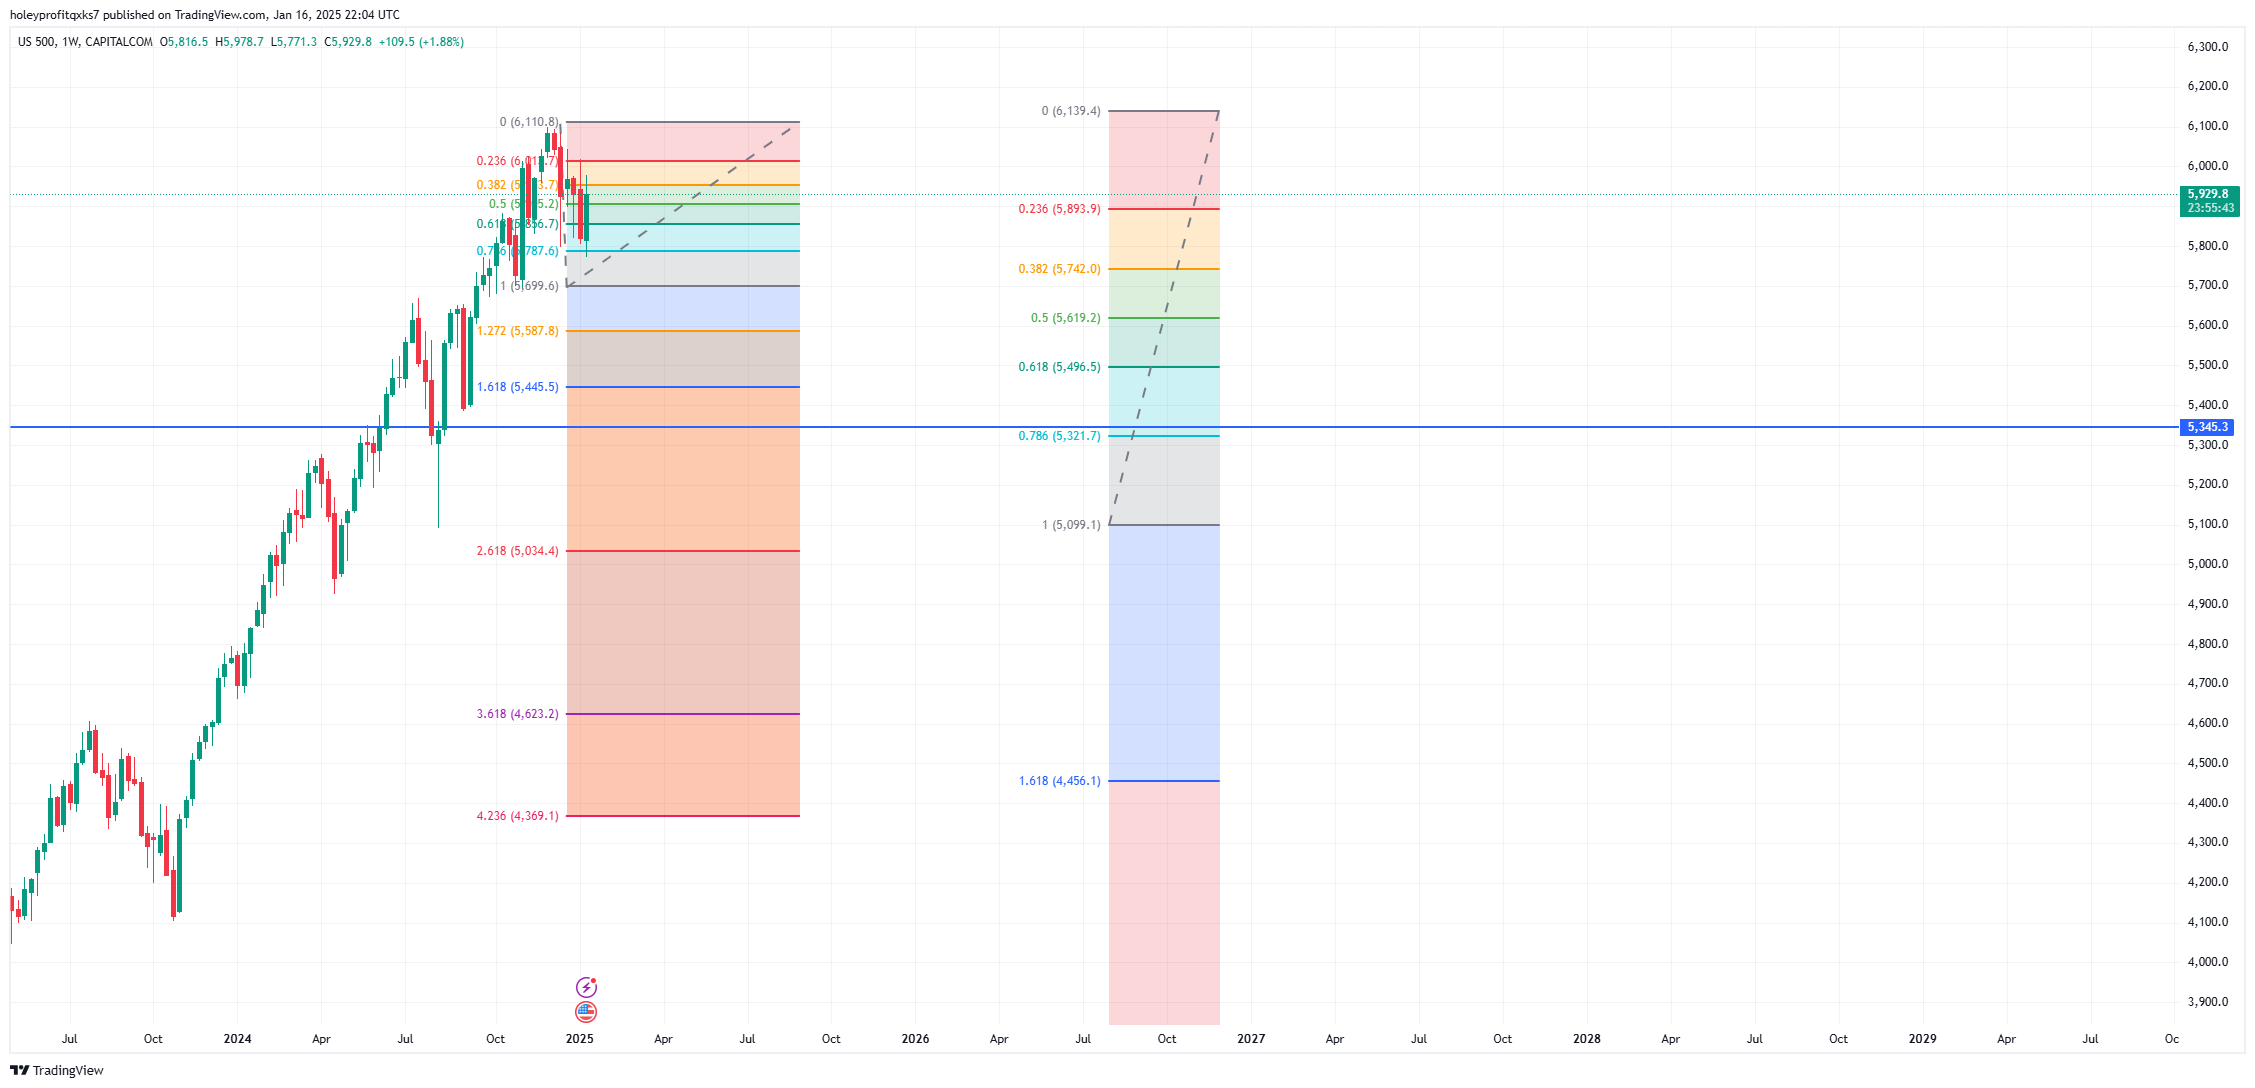
We can fully support the case the market “Should” capitulate to at least the 1.61 from the head and shoulders. Then 2.61 if this breaks.
If we extend this out to look for the final fib it’s 4700. 4.23’s usually spike out a little.

We know our default little map for a run through these fibs. Doesn’t always happen, but it’s a decent starting point for a plan.

4.23 spike out forecasts a correction to 1.27. Which would fully agree with the norms of a breakout to run a little and then correct enough to punish breakout traders.
In the times we trend nicely through the fibs like that, it’s usually Elliot wave.

Matching the idea we should bounce here but more importantly because we’d be heading into the strong wave 3 this support the style of sharp move.
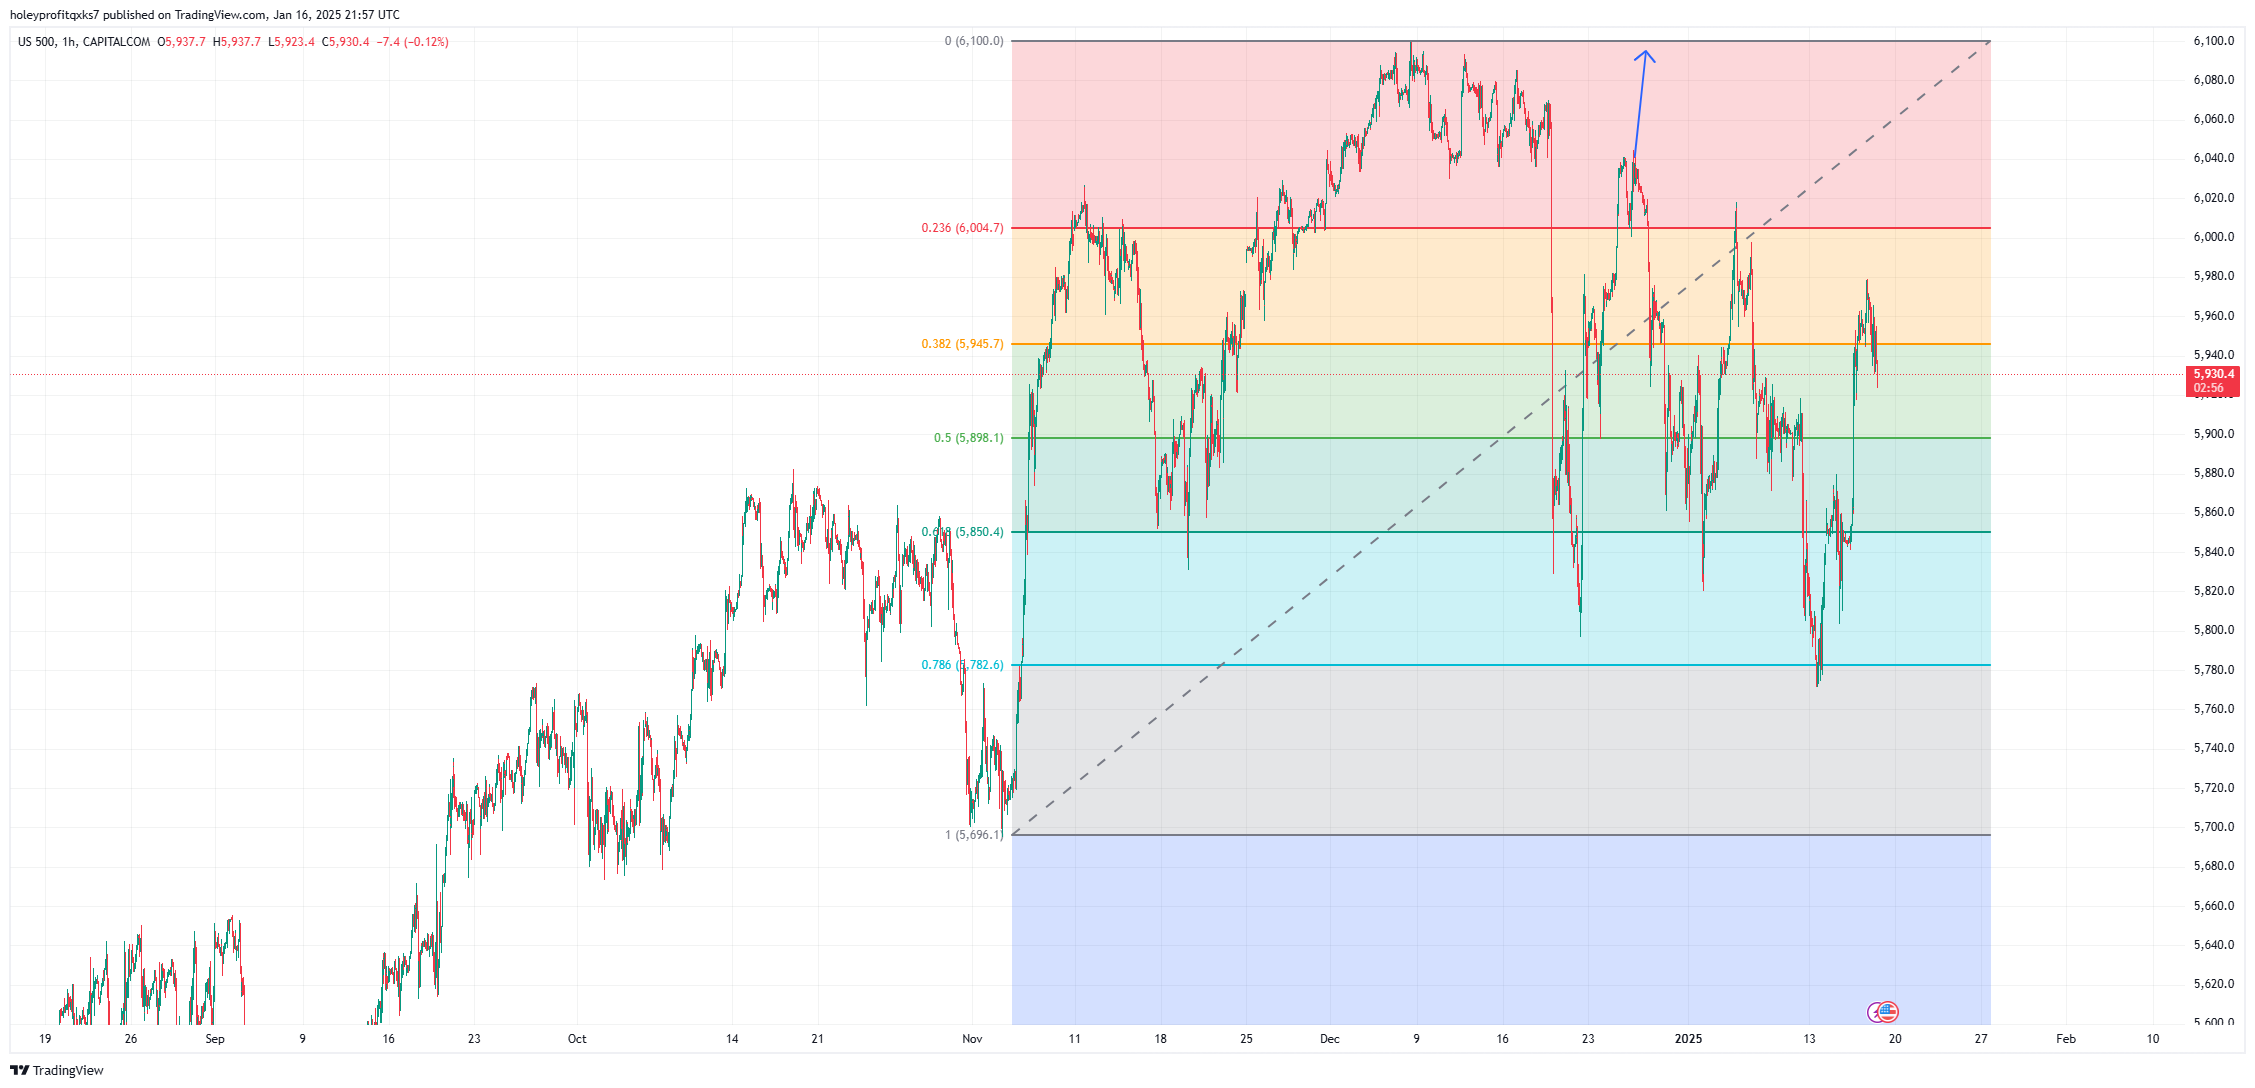
It took 43 hours for the up move to form.

We have candles 23 hours a day so let’s call it two trading days.
The drop should in theory be faster than the rally. “Stairs up, elevator down”. So if the drop comes, it’s reasonable to say we might be at the low quickly and that’s very far away from here.
Let’s Zoom Out a Bit
By purest rules (and my use of purest rules against SPX has been kicked out of me!) SPX has made a very loud and clear top here.

There was a drop then a big rally into a new high. Bit of a stuttering top and then a drop to the 76. Big bounce out of the 76 and it should have been time to repeat the cycle. That never happened. The SPX bull trend technically failed when this didn’t make a new high.
A dip might have been okay.

But instead we’ve went into a sequence of persistent lower highs.

Most of the time when I see this, it’s topped. Once the 76 is broken, it’s going to get really bad (can chop a lot first).
We could make a bullish pattern case for an impending C leg crash to the 76 here.

Matches with the style and levels we’ve defined previously.
All of this is kinda like a head and shoulders - which capitulates to the 1.61.

The confluence of a 1.61 spike out and 76 retracement comes right in the middle of our target zone.
So for the move to happen we don’t need it to be a real bear move, it’d all fit inside of the scope of a correction also.

So … if it is the case that there’s a meaningful top or even if we’re just making a retracement from the big extended previous high breakout - both of these predict crash like moves to at least 5500.
When we look at the different ratios of how long previous moves took to fit inside of the norms of those ratios we’d probably be looking at 10 - 15 trading days. Big caveat is ranges ruin things. Or “W”s! It takes a long time to build a tiny little W and can throw off timing estimates significantly.
There are a real concurrence of things to support that is a further break down is made, it’s likely to set up a capitulation to under 5600. Giving the optimistic 560 puts a real chance.