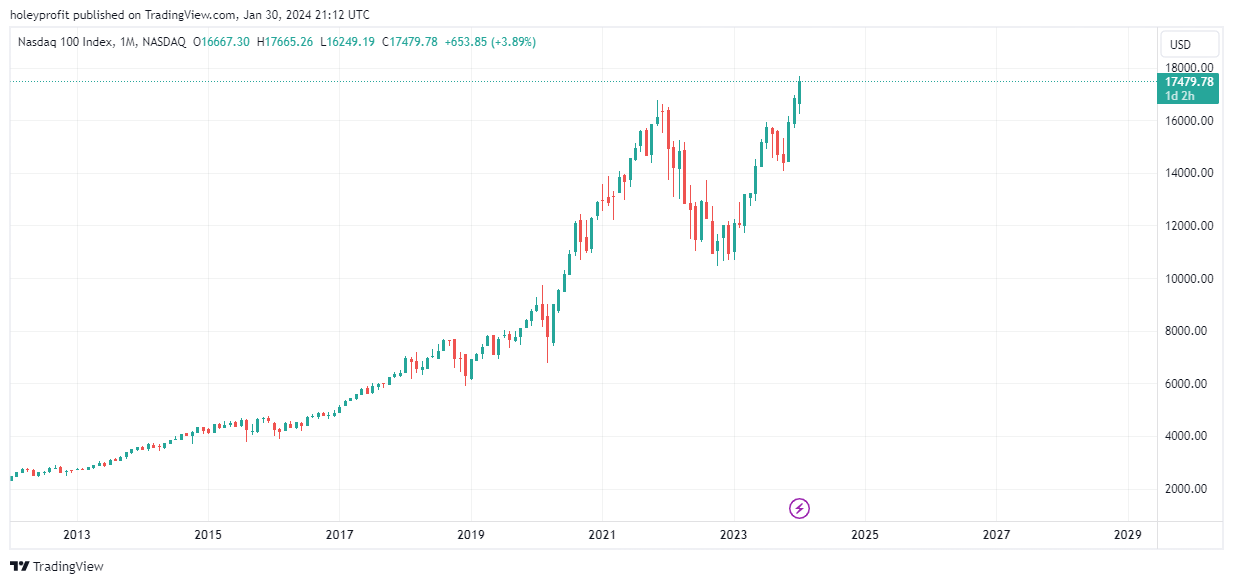
Comparing Nasdaq to Previous Spike Out Highs.
BB, Bitcoin and Nasdaq of 1999.

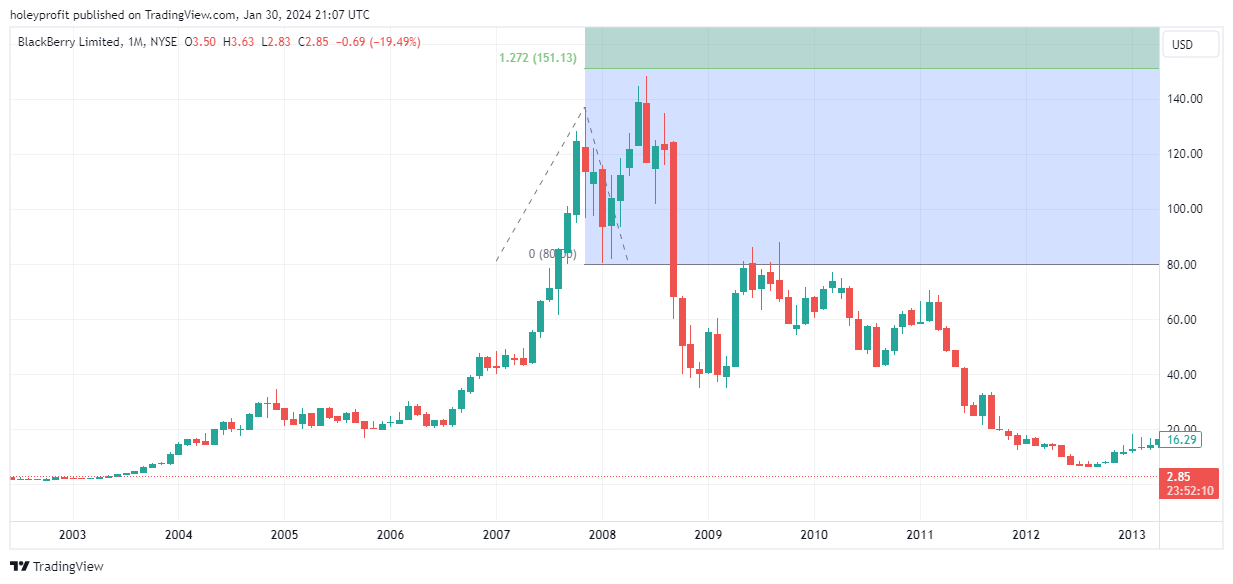
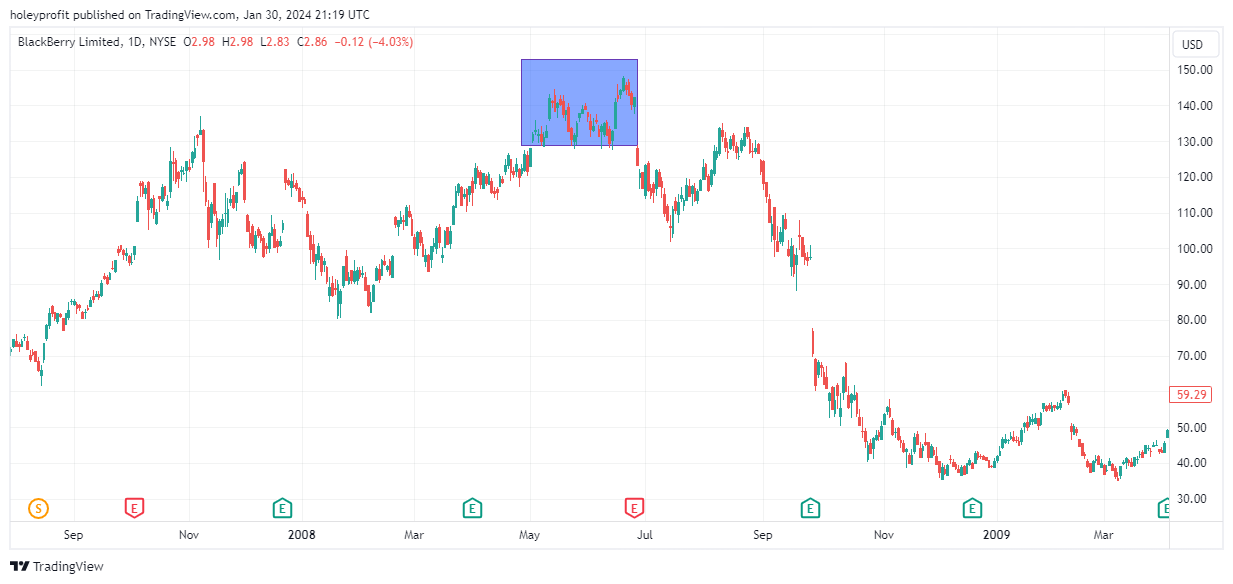
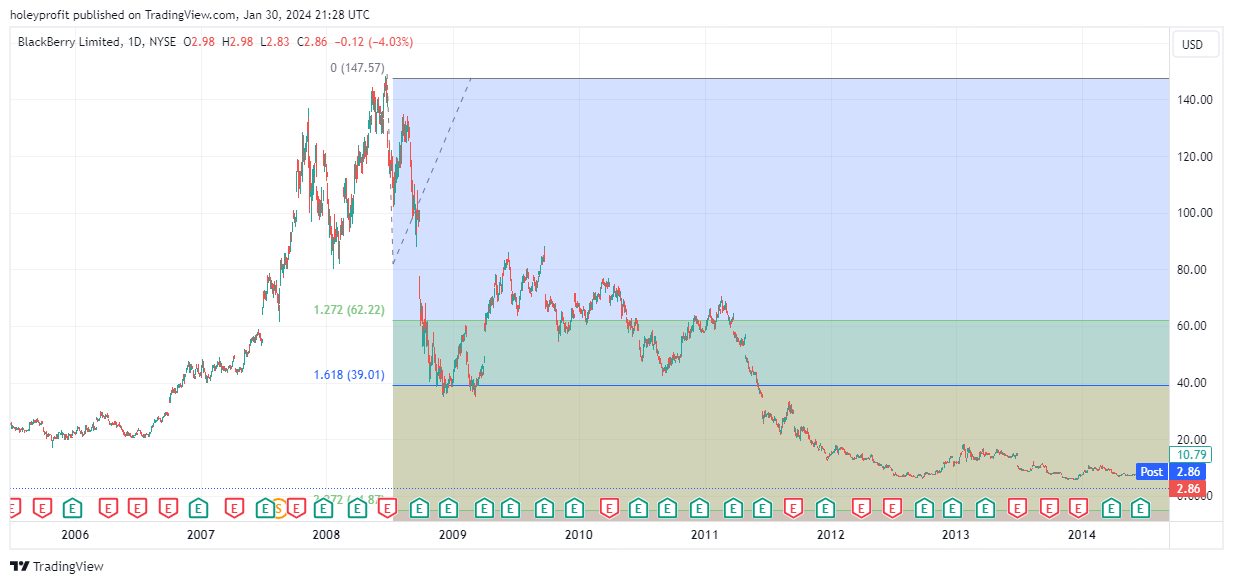
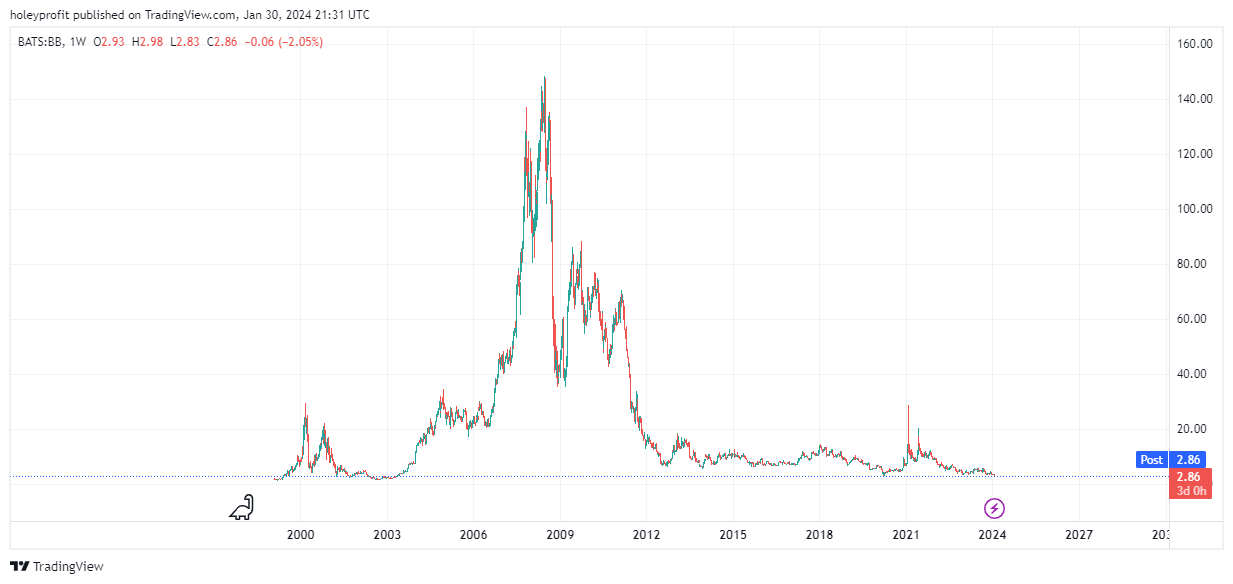
The BB high of 2008 I think gives us one of the best models for full bubble pops featuring spike out highs.
BB’s fake high, spike out high and then classic bull trap sell off is a very good representation of what everything we tend to see in the stages of this style of reversal.
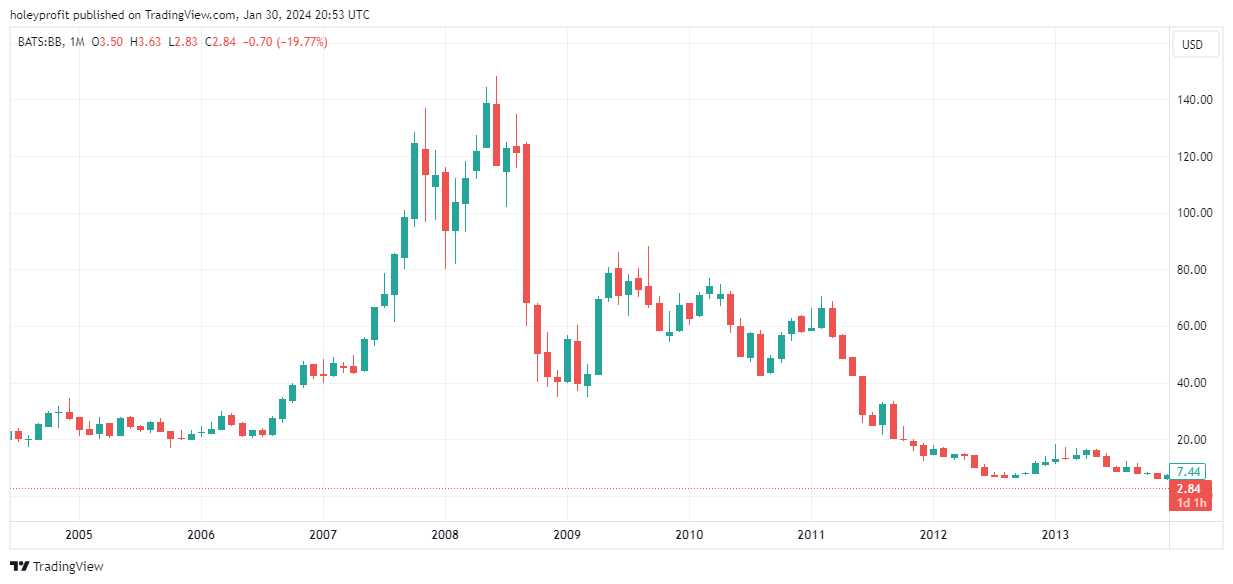
Notice after the first flash crash event we get some wicks out of the lows and then a steady run of bull candles into a new high. Notice also how the big red candle that marks the reversal has the wick on top. This tells us there was an initial sell off and then aggressive spike high into a real rejection.
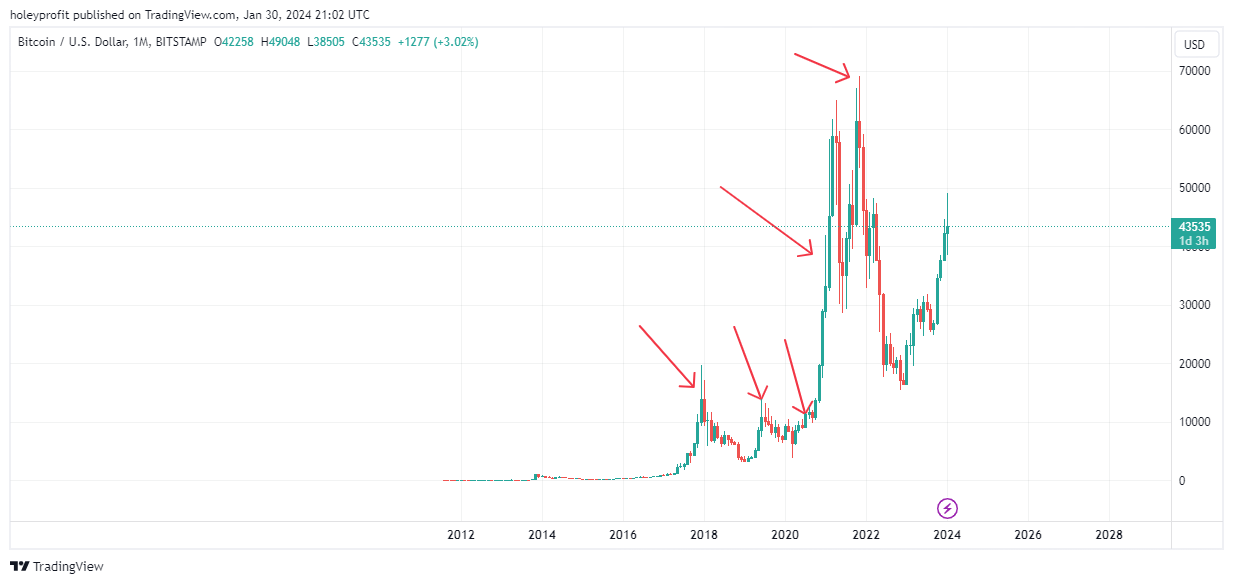
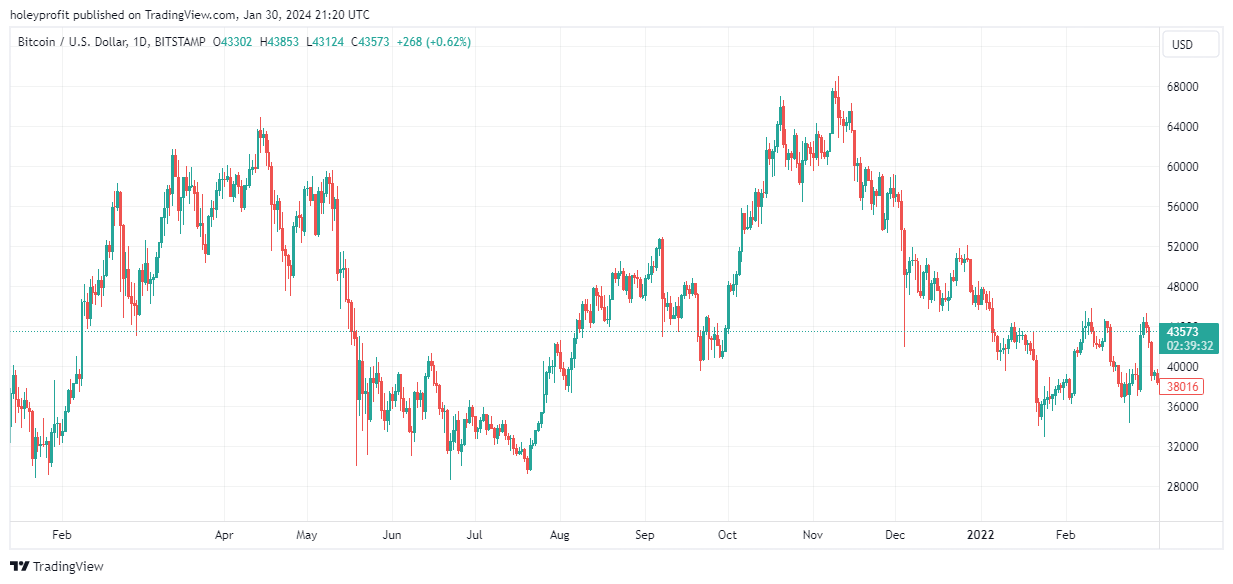
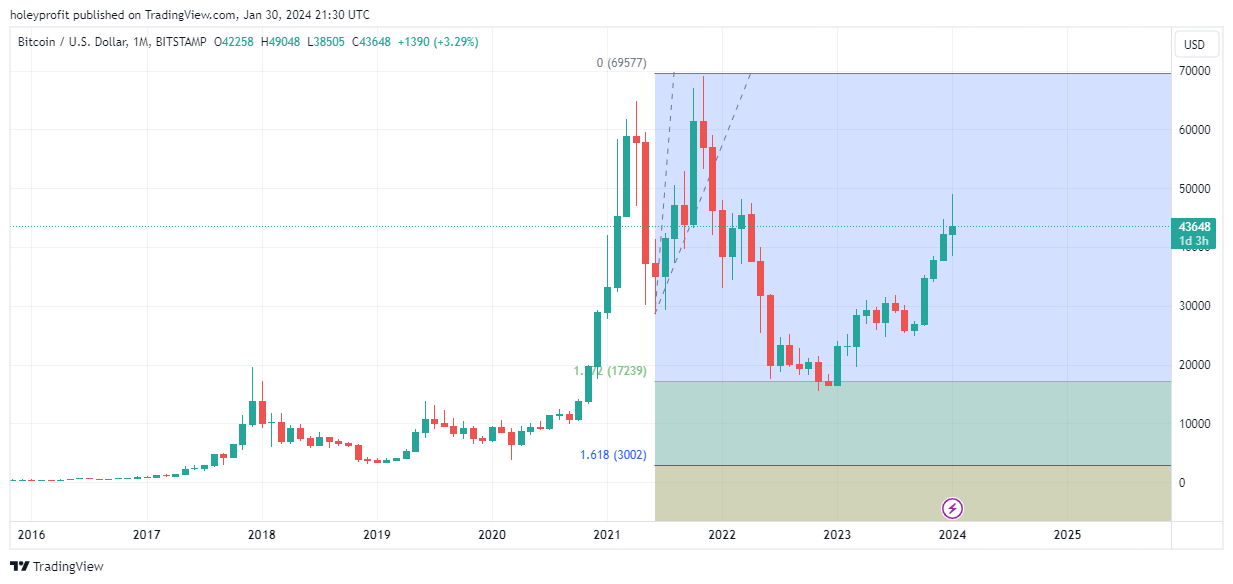
Here’s the BTC high.
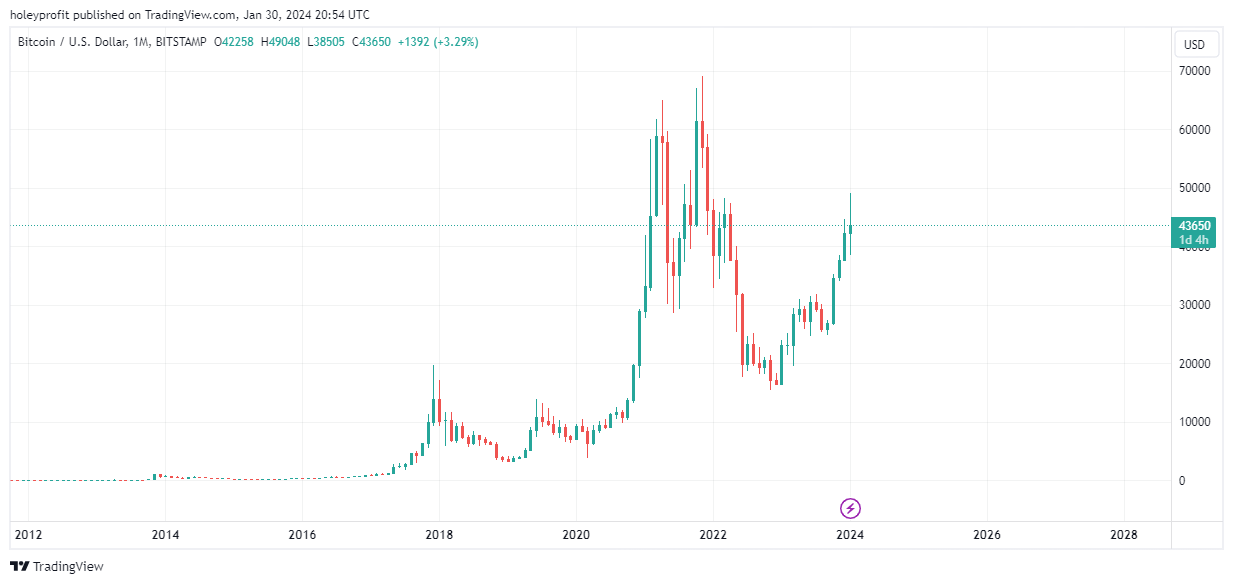
Can you see how these are identical in the spike lows and the bear candle featuring the spike over the last high? Both then enter into a crash. They both trade a bit below the last big low and then both go into rallies. I’ve taken a few attempts at fading the BTC rally (And plan to do so again) based on this model.
I hope the extent to which this BTC and BB model sync up helps to lend weight as to why it’s reasonable to use this model in current times.
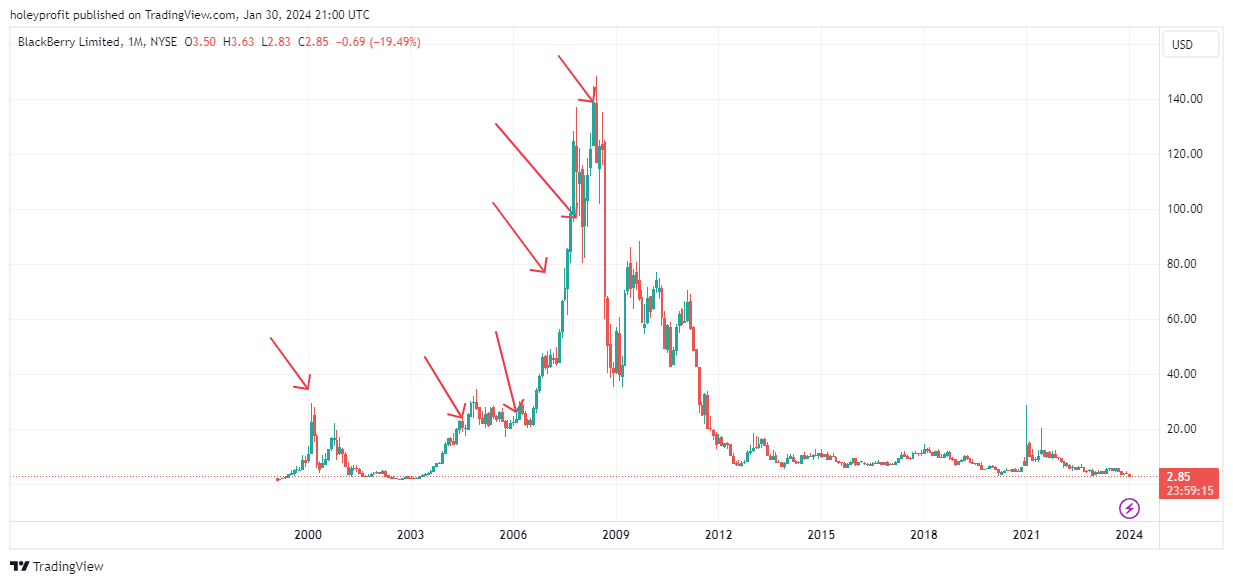
Nasdaq Vrs BB
When we zoom out and look at the full BB bubble we can break it into six main sections;
The initial big crash.
Initial recovery.
Ranging period with bear traps.
The massive bull run.
Initial crash event.
Final spike out.

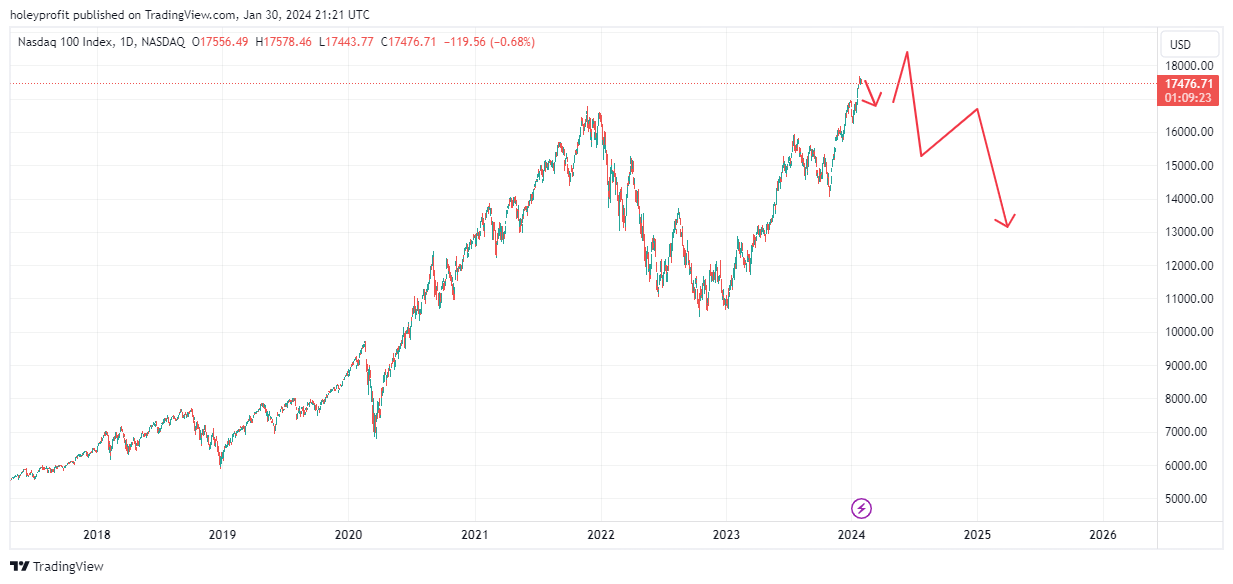
We can do the same for BTC.
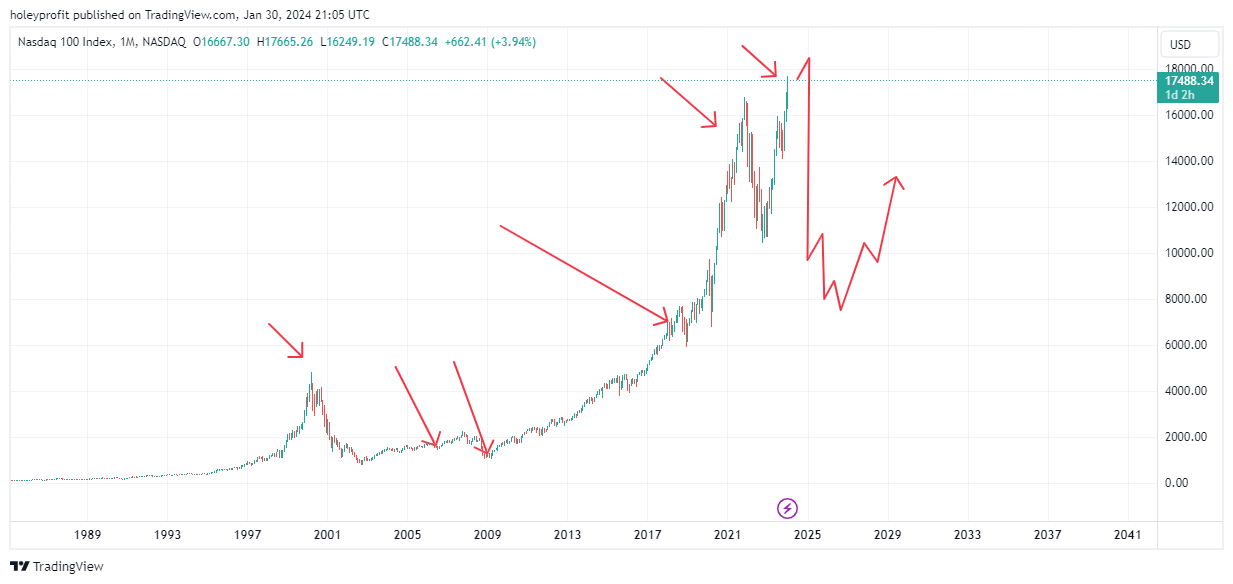
The model implying a horrific future for BTC is it plays out, but I digress. This is to a Nasdaq doom post.
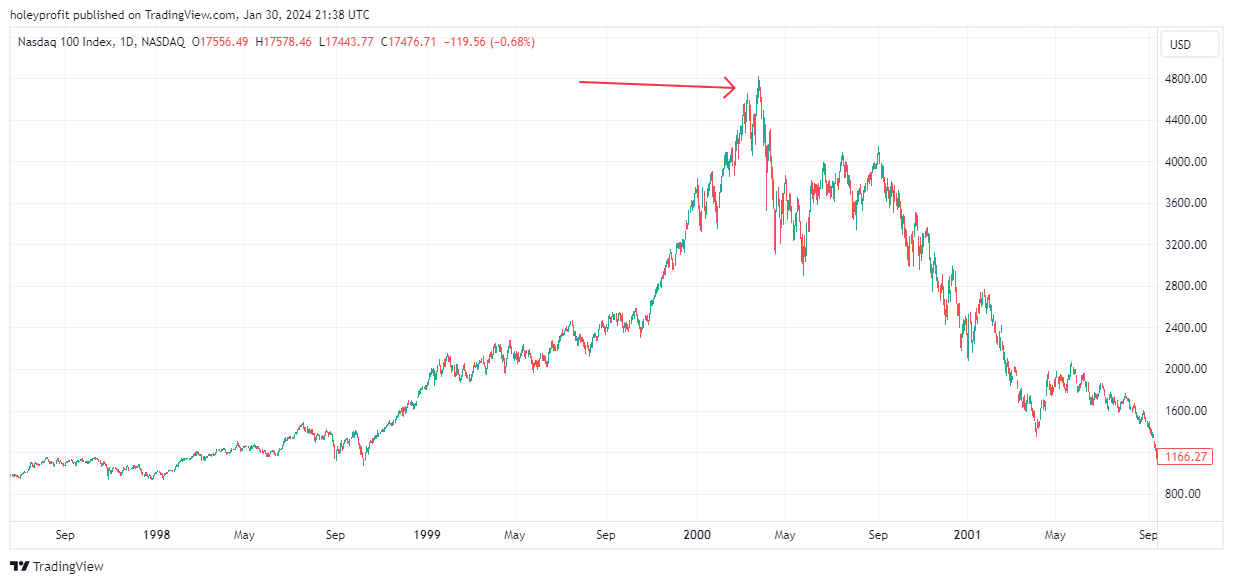
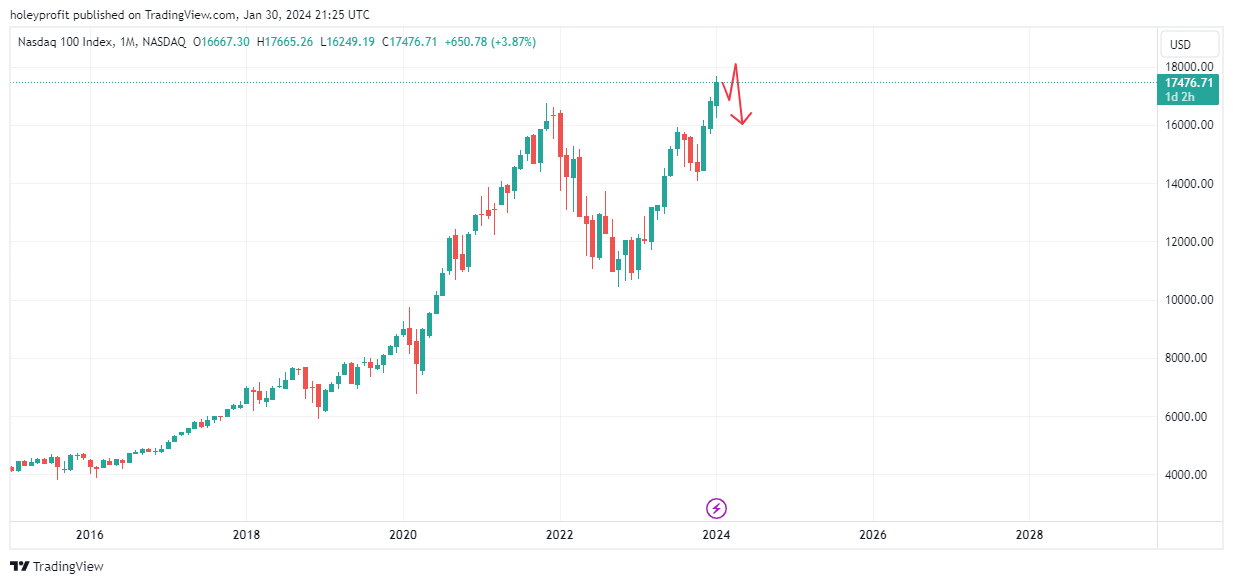
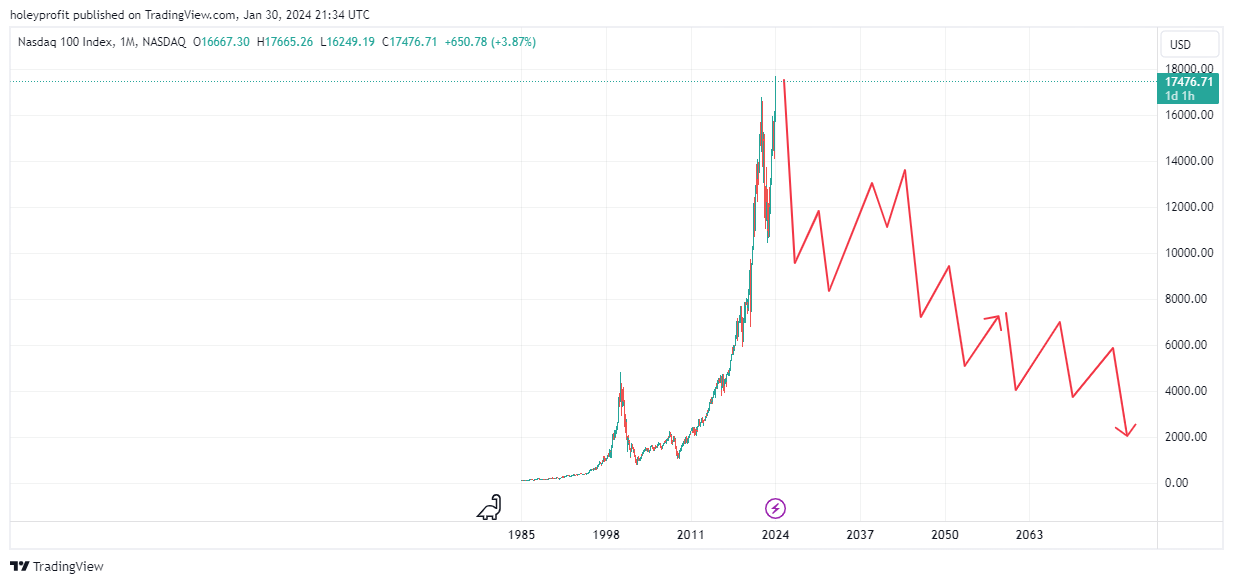
So here are some arrows drawn on the Nasdaq chart
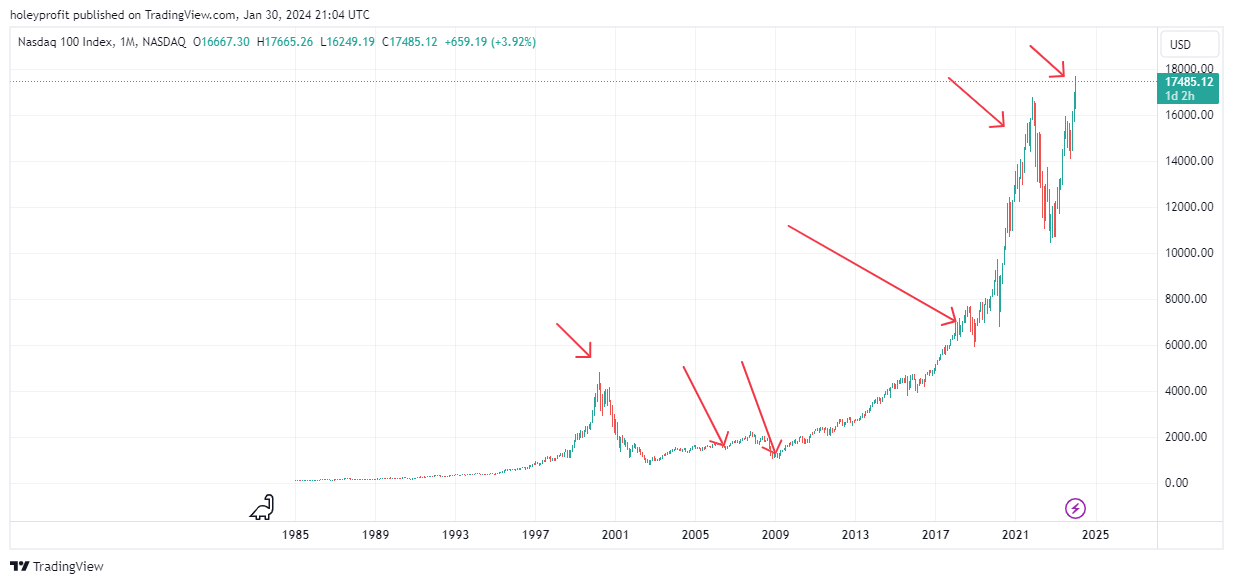
Remarkably similar.
This would have a grim implication, with these two swings coming before the main crash.
From a trading perspective, if this was to happen - History leaves clues. Let’s look closer at the top in BB. Using a fib from the high to the low of the fake crash, we can see the first wick comes in a bit under 1.27 and then the second wick(High) is around 1.27.
We have the big green candle with a tiny little wick in top. Telling us the month was strong but ended with some weakness. In the next month we have the spike high and the next month closes with a big bear candle.
Here’s the Nasdaq:
This section about the green candle and stuff basically writes itself. Our obvious extrapolated. If we see a spike high at some point next month, then we know this would be a particularly risky one to be long into and one where attempts at big shorts had a really good case.
We can look at the spike out in BB in more detail on the daily chart. The main features to note are the new high. Complex bear trap. Strong final false breakout.
Same thing is easy to see in BTC high.
And this is why if there’s to be a spike out top pattern in Nasdaq, it makes a lot of sense to expect a bear trap before the real high in this area.
There is a case for this being in. We could say this is the bear trap section.
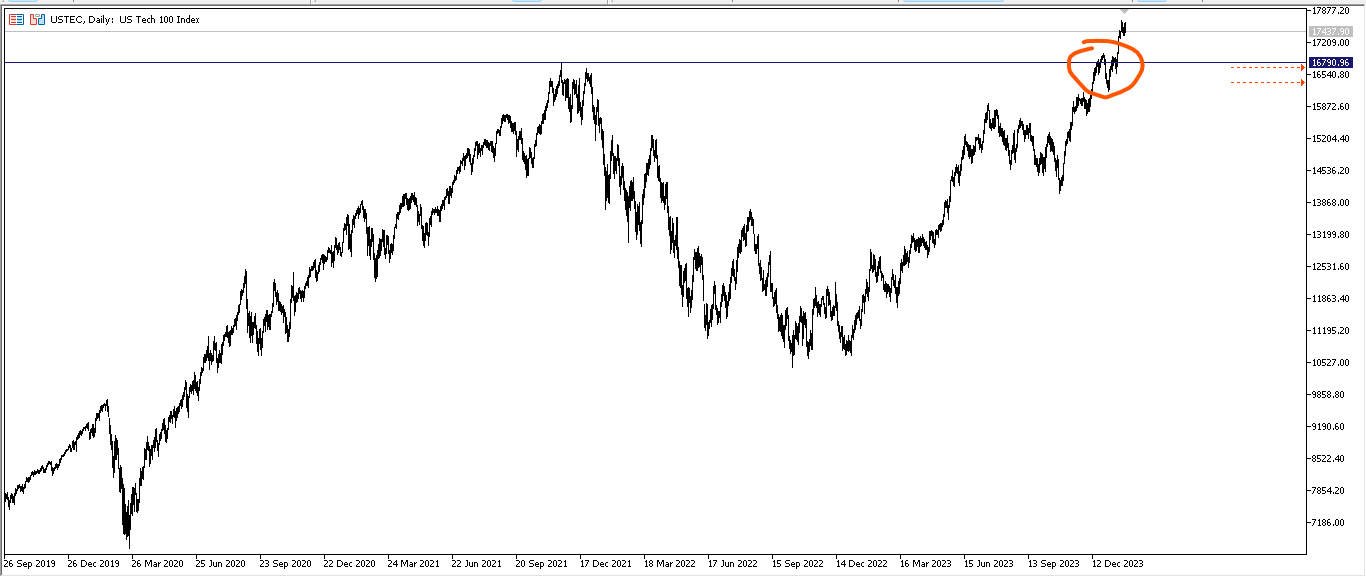
Which would imply we’re actually in the high swing now. As I’ve mentioned before the easy way to deal with this is building swing short positions and then taking high RR longs on big support levels. If the high was indeed in, we’d see the next drop become a sharp break.
But it would be much more pleasing to the big chart norms to see perhaps some sort of early month bear trap and then a final spike high next month.
And maybe even next month opening and just spiking. The idea of another bear trap may prove incorrect. In either event, a failed spike candle and next month closing strong down would be a big early tell for a possible big spike out top having formed.
I don’t want to get too much into the downswing and targeting stuff for a bear yet, but needless to say it’d be simple stuff using fibs we’ve covered various times. The BB bounce levels were very easy to determine.
BTC dropped right the 1.27.
If and when we know a topping swing is in, it' should be easy enough to determine the next important downside levels based on that topping swing.
The BB chart and Nasdaq chart look very similar. When we add in BTC looking almost identical and further along the pattern these are … well, statistically unlikely things to see randomly. They’re interesting. Hopefully they do not come to pass, because they imply horrific things for Nasdaq.
A full pop of BB has taken it easily back to the levels of the first crash.
Such a thing happening in the Nasdaq would be an entire paradigm shift from how we currently have gotten used to markets acting.
Which has happened before.