

Could be Major High Made.

Much sketchiness into the end of the week. Here’s the case for a significant drop in the coming month if we open weak in the week ahead.
Crash plan special.
This is going to be lengthy.
First let’s start with an overview as to why we’re in an area we expect a big decision to be made.
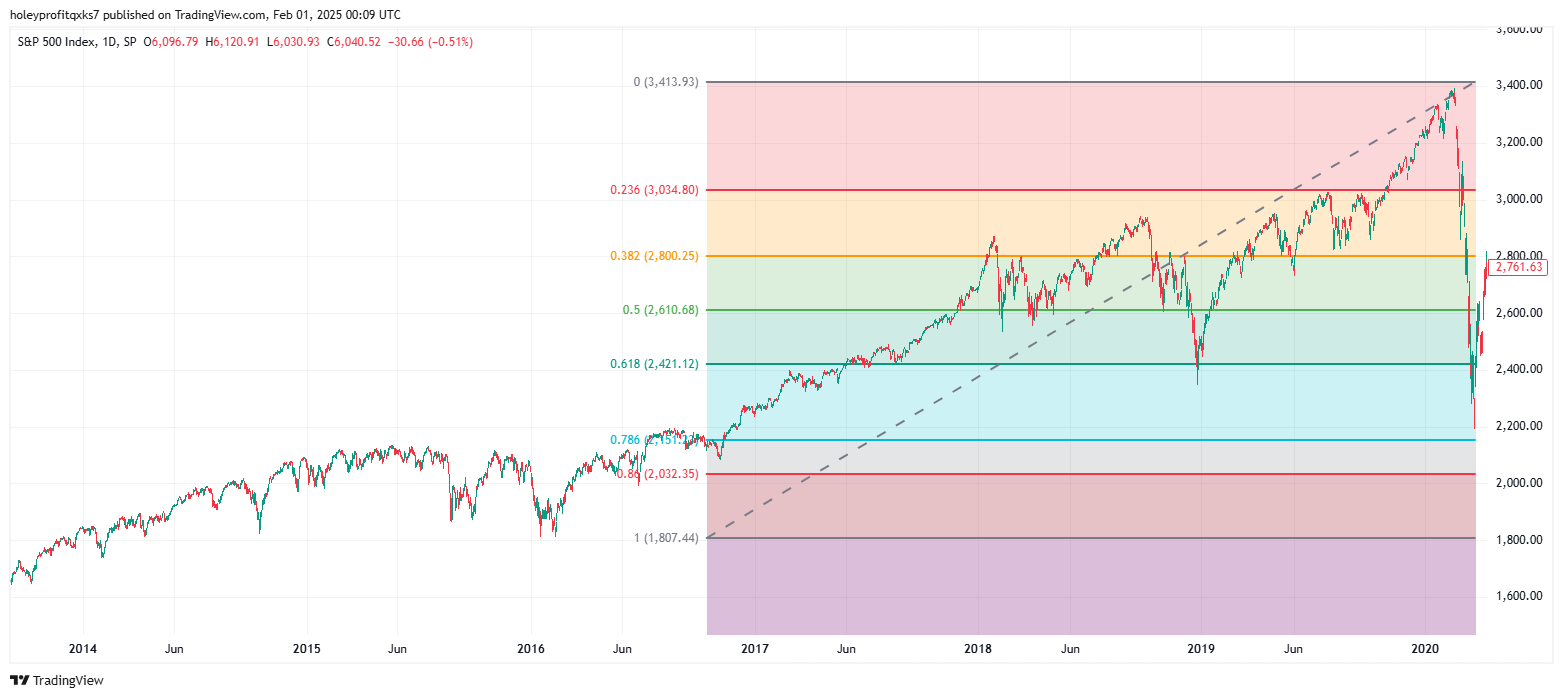
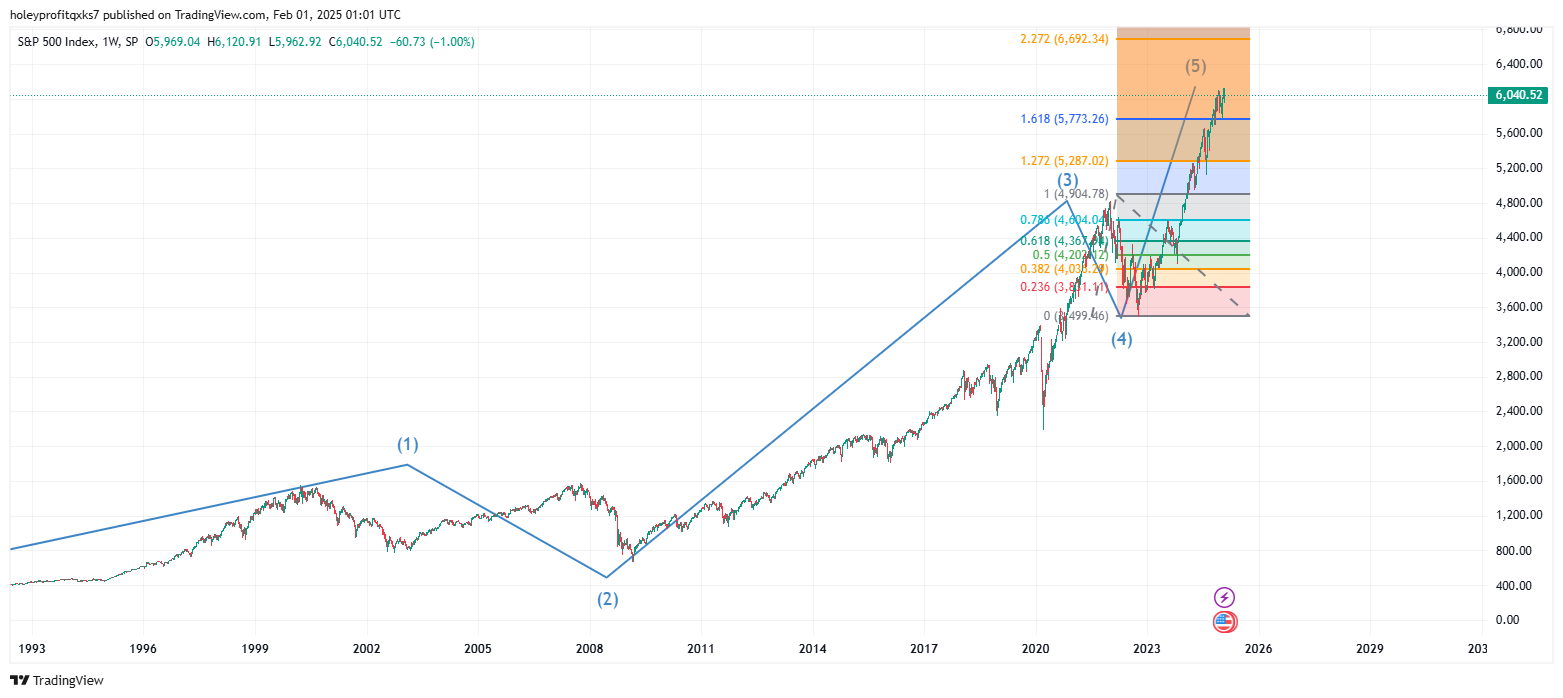
For the last couple months we’ve traded inside of the 1.27 - 1.61 zone. It’s highly likely the breakout to either side of this causes a strong trend move. Probably a big monthly candle.
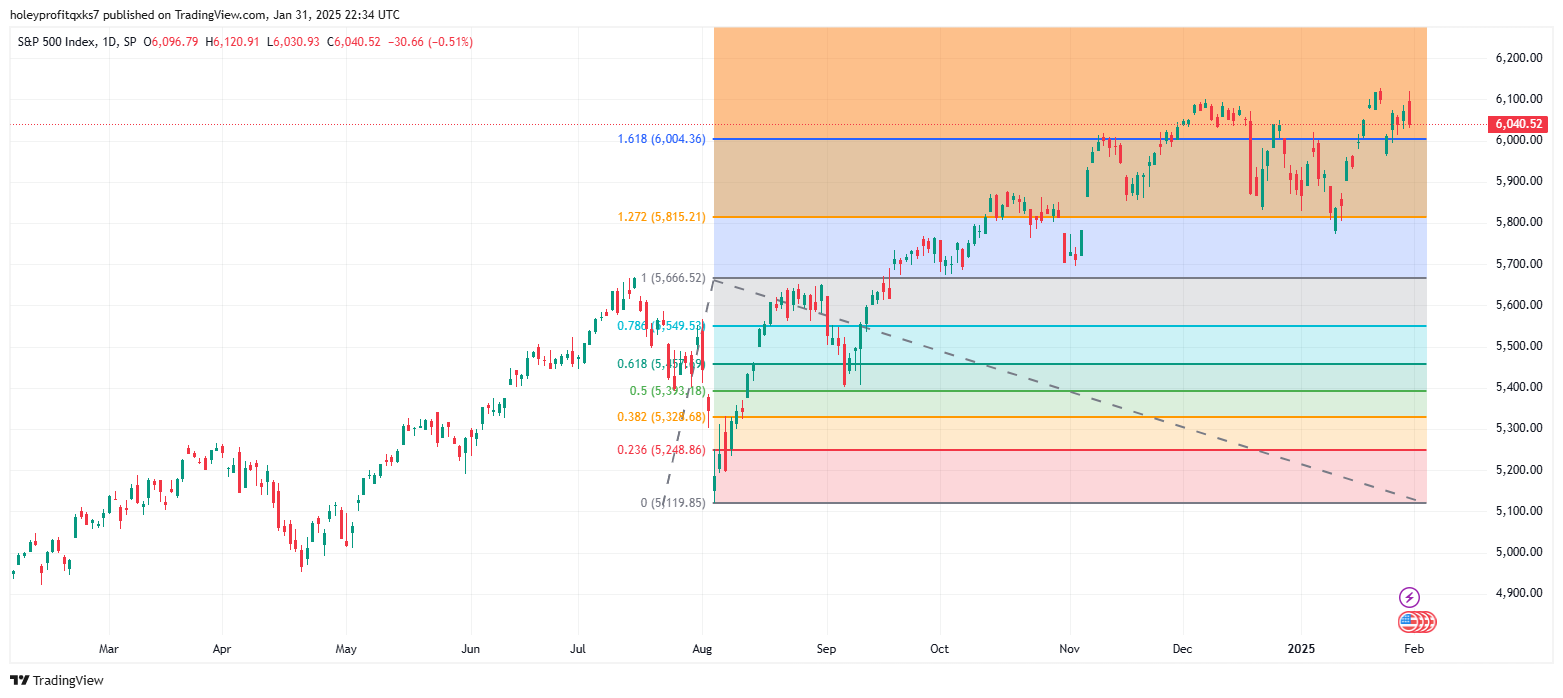
The question has always been which way that will be and the bias on positioning fluctuating based on which seem like the smarter bet at the time.
Ultimately the decision has always been what will happen at this 1.61. Given we’ve retested the 1.27 and got back above the 1.27 I always start to skew towards the 2.20 rally. Even if I am still bearish, I start to think about prepping for higher. Most of the time, that’s a great idea.
Unless it’s a 1.61 head fake. I can think of a 1.61 head fake extremely similar to this.

The pullback isn’t as deep but it pulls back from the 1.61. Looks like it is running again and then sells off. In the up-move there are two main legs and it sells off all of the first one. We close a bit above the 1.61. For additional context, this was a Friday close and we had been up strong earlier in the day.

Fairly similar looks.
And the reason I remember that one so well is that was this one.

It felt like we’d broken out. Price came back really sharp but it ended up closing on support. There was a strong confluence of local support setups and the big 1.61. Then there was the news at the weekend and it opened down. Broke the 1.27. Retested it and then went into the larger decline.
Which is typical of the 1.61 top.
I thought this would be a two leg crash at the high. First leg would dump to about a 1.61 of the topping swing. We’d bull trap there. Then there’d be a second leg. So this was the forecast in the DJI.
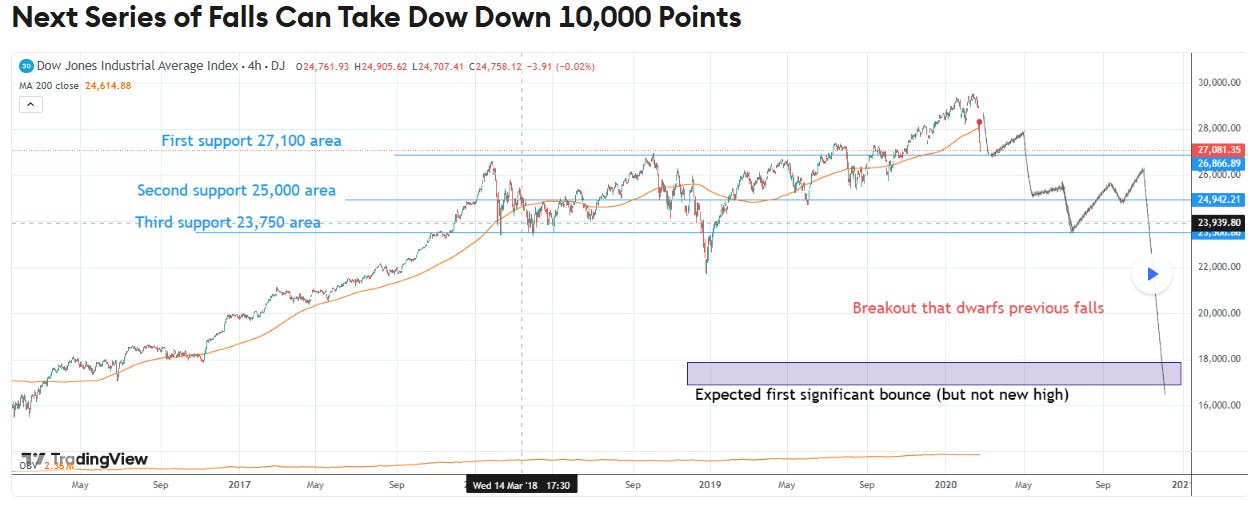
And it fell 10,000 points to the 2.20 and that was the low.

Which is the best outcome for a 1.61 rejection. In the event there’s the 1.61 bull trap and break, a bigger downtrend comes.
Based on TA the 2020 drop was both predictable and typical. Granted, in real time it was very hard to not think and feel like the move higher was coming, but so long as you conceptually know about the 1.61 inflection zone you’d know this was a big binary decision point.
The news was unexpected but the idea that it would take news to make the big move isn’t. That happens all the time.
2020 crash was technically simple in terms of foreseeing the important levels. Low came off the 2.20 of one swing or 1.27 of the bigger one.

The 1.27 bounce really got me! Because I think 1.27’s are more often pullbacks. I really thought this was a massive short off the retracement levels at the time.
If we were to make a 1.61 rejection here and it was like the 2020 one (Which was not atypical) then we’d have a very clear indication of it when the 1.27 was not support and then was resistance.
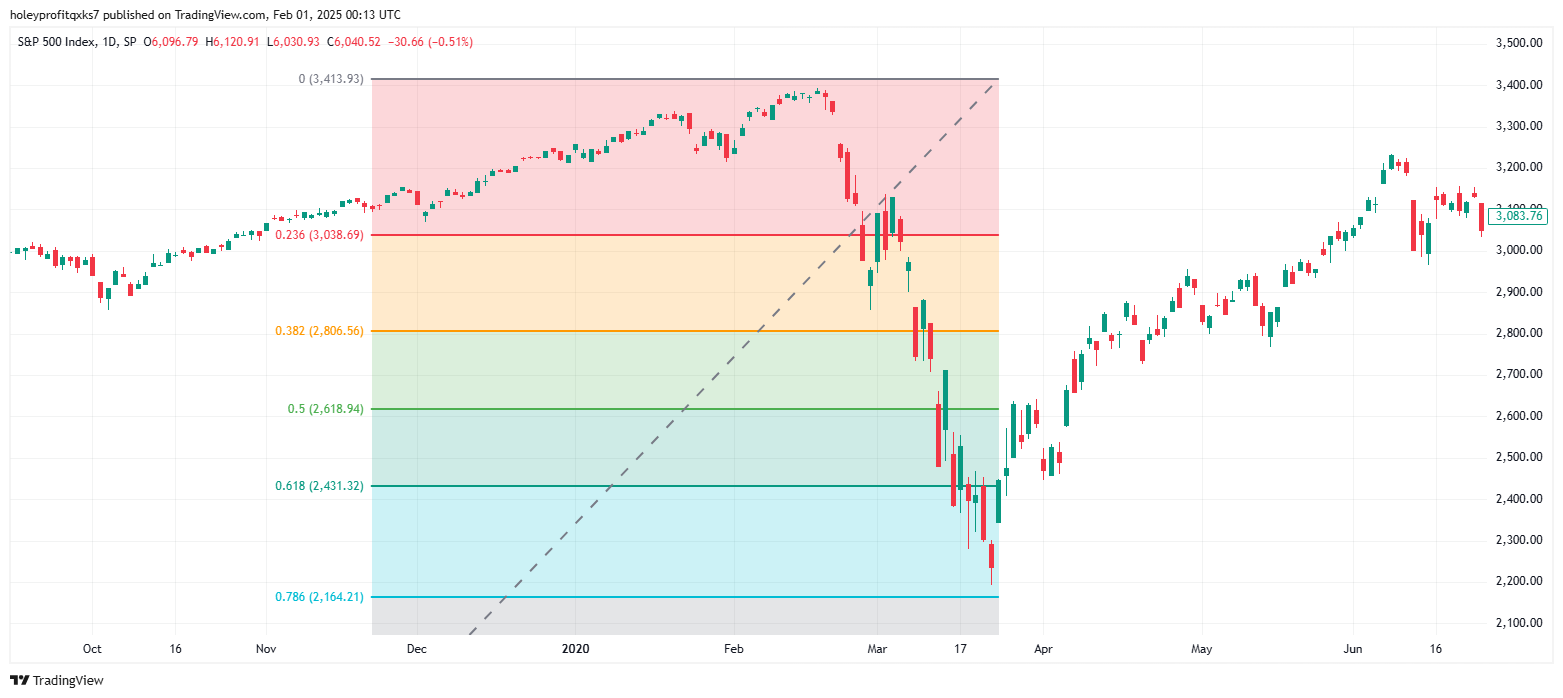
Look at it in 2020.
Simple stuff.
A rejection like this would typically have to be news driven. Rare to see big things like that happen unexplained. I’m not saying this to forecast news, rather as to flag it as an obvious “Marker” for a break. If there was a similar scenario where bad news dropped at the weekend and markets opened down, it’d be something to take note of.
Like for like move with 2020 would be a crash to 4700.

Then a strong persistent recovery that gains in momentum as it goes.
Which actually makes a whole lot of sense in an uptrend.

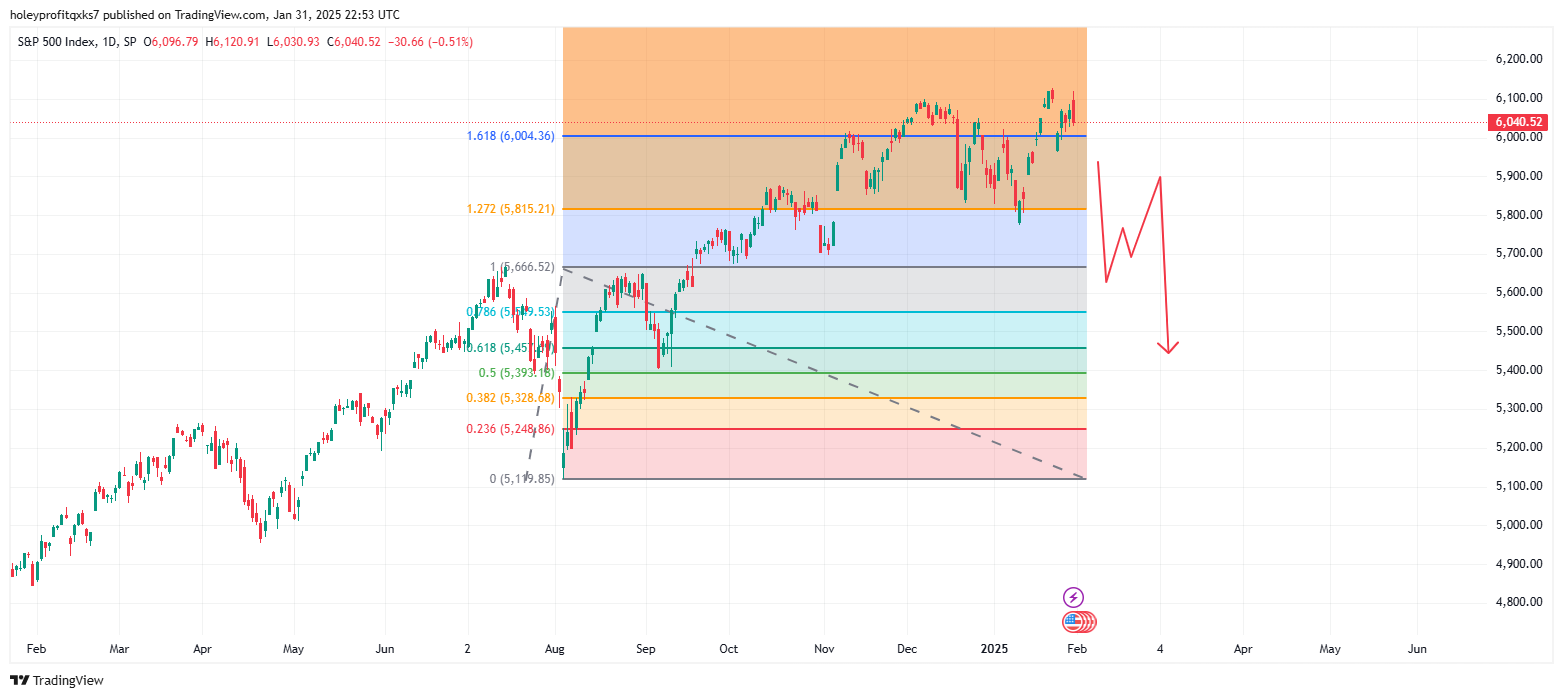
Dropping back to the 76 retracement would be expected to be a move quite similar to 2020 if we were heading into an ABC.
A leg would be the rejection of the new high. Started today. Progresses next week with the 1.27 break.
B leg would be the retesting of the 1.27.
C leg is the crash to the 76.
Dramatic stuff, but all very standard.

All makes a lot of sense inside of a bullish correction.
Further bearishness could have it as something like this.

But that’s neither here nor there at this point. Both of our bearish break and bullish C leg correction would have the same implied outcome of a crash to the 76 and then there being a trend decision to be made. We could speculate this way or that on what that will be but it’s more useful to actionably plan the decision levels on the way down.
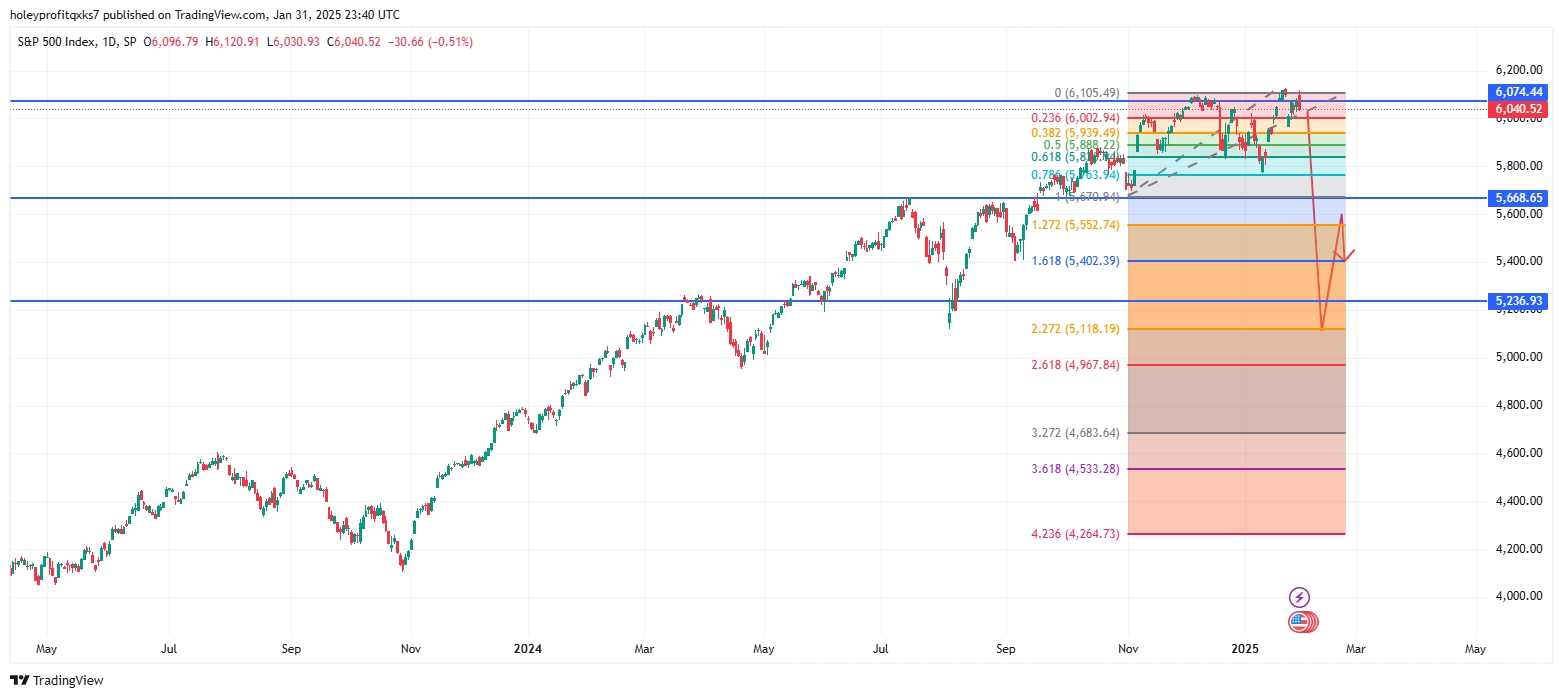
Looking on the daily chart zoomed out it looks like 2020 just went right down, but it wasn’t that simple.

During this move outside of the couple crash zones bullish and bearish days were close to equal. Bluffing one way then the other and ultimately breaking lower to do it again. Trading 1.61 to 1.61 would have been a great trade, but being able to catch those intra day lows and reload would have been epic.
Which was totally doable. If you drew a fib on the topping swing when the first break happened the bounces came 2.61, 3.60 and the retesting of 4.23 signalled a further drop.

Once all the fibs were broken the move would be to draw a fib on the last pullback.

Which then gave all the major turn levels all the way down. Bottoming on a 3.20 (Which is somewhat rarer I find, but there it is).
So at this point we can map out everything that would happen in a 1.61 rejection that traded through the fibs. And let’s overlook the news thing and just focus on that - because that it clearly what happened. For whatever reason, like usual, the market traded from fib decision to fib decision.
We know ways we can use the current swings to forecast approximate highs/lows and by inferring where some of the bounce lows/highs would be we can then do the new set of fibs to get the latter end of the move. If we’re heading into an Elliot C wave flash crash - we can easily map out the recurring norms of that now.
I guess this becomes an actionable forecast if the big break of the 1.61 and the 1.27 is made, but we’ll put some effort into mapping out the full swings in this type of move just for the purpose of education. These things are big events when they happen on big charts but small versions of them happen all the time.
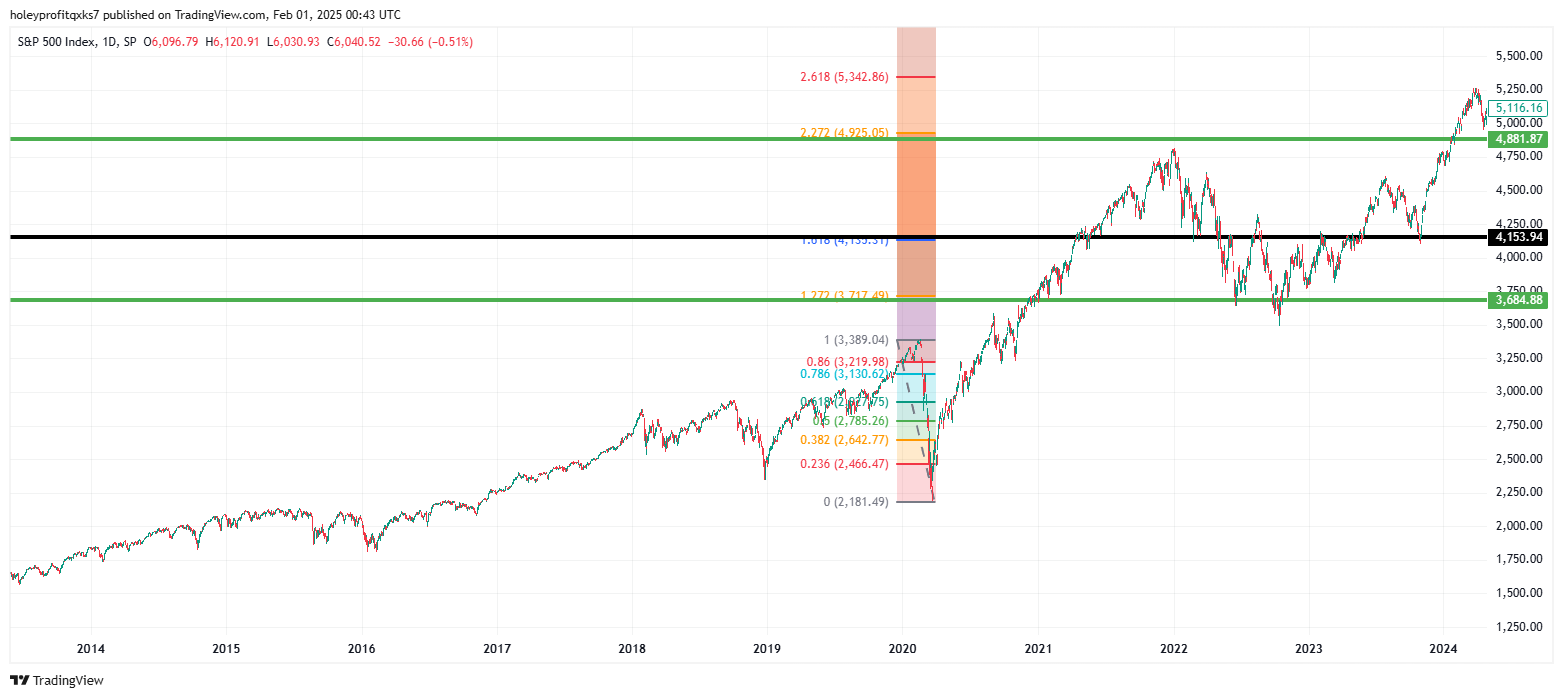
Here’s how we can map out the likely levels and swings of a C leg correction.
First things first, if you think we’re heading into a C leg correction you know ultimately where we’re going. It’s going to keep going to the 76. Then it’s going to stop in that area and there’s going to be the resumption of the trend in another 5 waves.
In theory if you have you count right here and Elliot prevails in the future, you can now map out the full bull swing and next top. Since you know where the C point is.
So if we’re taking the hypothesis we’re heading into a C leg we know where we think the low will be. Roughly. That’s a good place to start because then we can see if the other things we use also agree with that.

Flash crash to 4,200. That’s the C leg implied move.
At this stage in the move we want to focus on the 1.61 resistance.
“What if there’s not a 1.61 resistance”.
You’re probably not doing it right. When looking for wave 5 endings, generally want to be looking for false reversals/chops and 1.61 false breakouts.
Here we always have to be ready to give up on the short quick if the 1.61 holds. It’s best to assume if it breaks we head to the 2.20 in one big candle. It’s not usually that quick, but it does happen. In terms of risk, it’s best to just assume terrible things are liable to happen if you incorrectly fade a 1.61.
Also if we sell off from the 1.61, we should always be very cautious when the 1.27 is met. 1.61 pullback to 1.27 is common in trend continuation. So at this point we can fully plan a C leg but we should be aware of 1.61 > 2.20 risk. It’s a big mistake to think selling off the 1.61 always means a full rejection.

The 1.27 helps to give us the line in the sand for a break and also it gives us the level we have tolerance to in a bull trap. 1.27 is an important break. We can retest it but we can’t break above it. Very solid start to making a bearish breakout plan. We’ve determined a good level and approximated our tight stop conditions.
Most reversals will first fake a perfect trend continuation.

Back to the retest and then bouncing - but this time the bounce is the retest.

That’s the bit that gets people hurt. Or the place you can really benefit if you’re well prepared.
The 2020 move was a simple retest of the high then retest of the 1.27. Which was typical. These are things to look for early in a 1.61 rejection.
Once we have our break made, the next thing we’d want to do is draw or swing from the low to the high of the topping swing.

Interestingly enough, the first parts of the 1.27 - 1.61 breakout strategy already agree with the analysis from the previous swings. If we’re forecasting a breaking of the uptrend (forgetting the big target for now), we are forecasting a breaking of the 1.61. Hitting the 1.61 is really just a bigger pullback.
1.61s are big decision points for a trend. Pullbacks can end there and when they break we usually head quickly to 2.20. 2.20 - 2.61 we often pullback to retest the 1.27 - 1.61 zone before continuing the trend. In 2020 we broke the 1.61, retested it and then headed lower.

If we adjust our fib so it’s the full topping swing we’d also fit inside of the same implied zones.

And fit the condition of appearing to have a perfect retest.
And that gives us our first big break swing low target. We want to see it breaking the 1.61 and starting to sell off aggressively and we long near 2.20.
Let’s start to neaten this up and make a real plan with the levels.

During the rejection from the 1.61 there should be a capitulation zone. We’re slamming to the 1.61 and then there’s a washout under the 1.61. After that we expect there to be some sort of bounce back to retest 1.61 - 1.27.
Once we know what this swing is, we can then use it to forecast the further levels.

So being able to establish before the fact where this might form and know if it breaks then we can trade through the fibs of that swing is what allows us to have insight into where the intra-swing activity is going to be. We’re inside of big one C leg, but that C leg has multiple little sections.
Keeping with the swing we have for now, though - here’s what happened next in the 2020 break. 2.61 bounce. 3.20 bounce.

Then we spiked out 4.23. Retested 3.60. Went into a big head fake under 4.23 to make the low.


And the we have “Some kinda spike out” under there. But we want better than that and we’ve already established a couple ways to do that.
First let’s revisit the first broad idea that we know we’re crashing to the 76. Well, in the 76 reversal I find we often fake a reversal at the 61. The 61 fib is popularly known as the reversal level but if you trade a lot of them you’ll notice we usually wick to the 76. Entering at 61 is early - and it’s bad with a tight stop.

Weirdly enough - all that stuff we just did there takes us to the 61.
This isn’t a carefully scripted post. I’m just freestyling it here. This is how things should come together. Don’t ask me why, but that’s what happens.
So we could use that just to shortcut to the end of the forecast. Easy stuff from here. Our spike “Somewhere under the 4.23” is our “Spike out of 61”.

But we can do more.
Back to our inferred pullback. To complete the low in 2020 we made a pullback on the 2.20 of this. Into the 1.27 - 1.61 zone and then we spiked out 2.61. Got close to 3.20.
And that was the low.

Exactly where it was always going to be, in retrospect.
If I’d looked at this from a different perspective I’d have nailed the 2020 recovery. It was actually all very obvious. And I seen these things, I just thought it was a dead cat.
The first section of the rally I did awesome … I did not consider it was a simple correction or I’d have nailed it all. We’ll cover how next - but first lets update our chart.
Adding in these fibs as a sort of check give us very close to the same levels. Bit more past the 2.61 implied but these are not big differences relative to everything that matches up.

Which is all pretty cool.
…. But we can do more!
Now we’re full circle and we’re back to using the big 76 swing. The recovery from 2020 with the correct bias and context was laughably easy TA.
I don’t feel I even have to mark up the chart. 76 low. 50 pullback. 61 retest (Near miss of it, which is actually common). 38 chop. Breakout.

We don’t have to do more.

We don’t really have to check if the implied recovery move also agrees with the same norms of the topping swing.

But it does.

Still freestyling here.
We don’t really have to check if the bearish retracement zones of the full swing would also agree. With us having reactions between the zones and the downtrend failing entirely over the 76/86.

But they are. So that’s kinda nice.

Tidied up a bit.

It’s bordering on trying to show off to more, but wouldn’t it be odd let’s say in 2020 we correctly drew the big 76 swing and assumed the correct recovery … wouldn’t it be odd if that same swing then gave us the next major swing high and low?
That would be really easy to add to our plan.

Which with the full benefit hindsight was just this.

The Elliot C correction and then the five wave expansion would have forecast this.
At the start of the C leg.

And this general template is going to serve you were every time there’s a C leg correction in an uptrend. Will always tend to look like this.
1.61 Head Fake
Topping Swing 1.61 breaks / holds retest
Crash to 4.23
4.23 spike out is 76
61 holds retest
Pullback from bearish 76/86.
Expansion to at least 2.20
Question really is if we’re inside a 1.61 head fake heading into a C leg right now. If we are, we’re going to have an insanely profitable 2025.
And if not, I’d encourage you to test out these ideas on smaller timeframe trend formation and breaks anyway - this is helpful.
I’m sure if you’re reading this I’ve made my case for the 76 to you already, this is a way to enhance it by detailed mapping of the C leg and expected recovery shape.
Now we’ve been through all that, let me show you something cool.


Hmm. That’s quite interesting.
But would be really weird if all the stuff we’ve done in this post which is not even entirely related to the 2008 crash also happened to agree with these- right?

What would border on bizarre would be if this general Elliot framework applied to the entire move of SPX over the last 50 years.
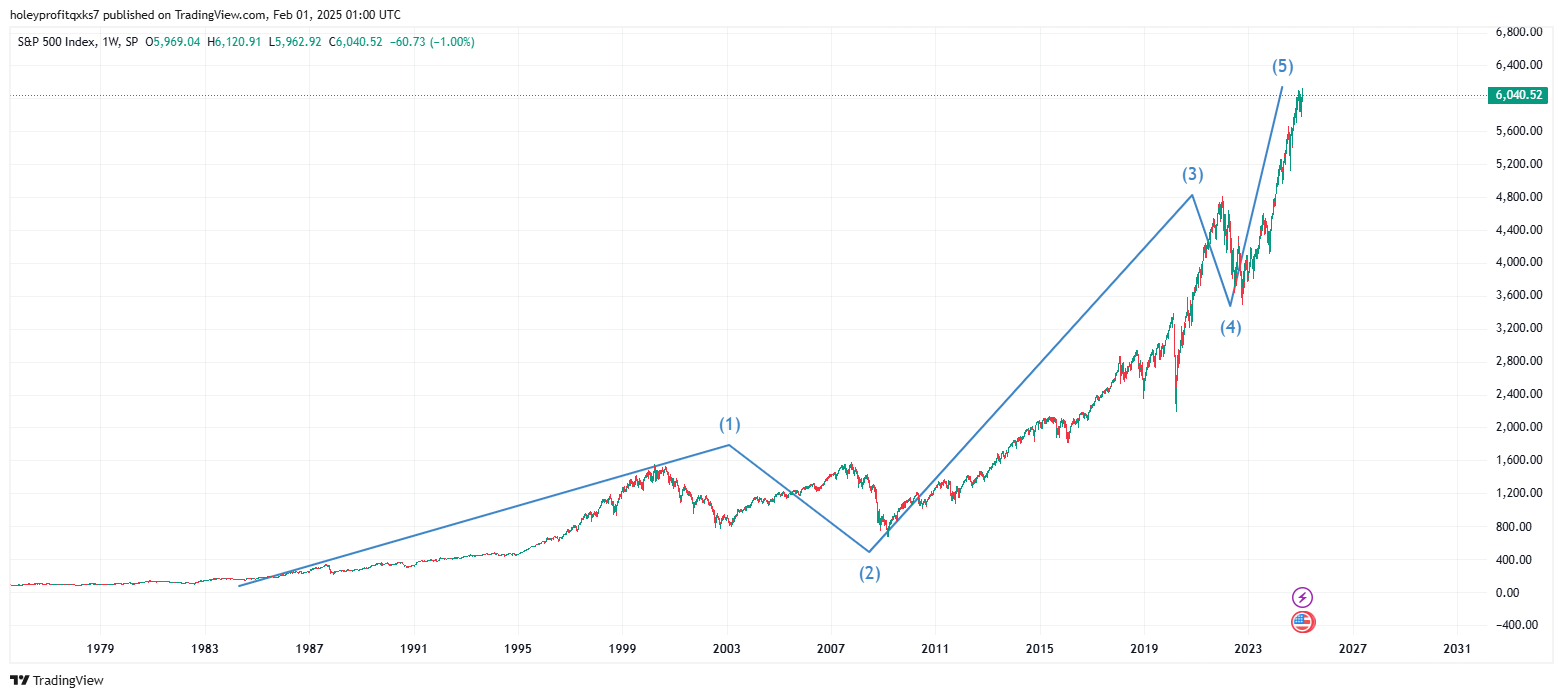
…Eeeek!!!
But it’s okay. Remember, the only time we really have to worry about wave 5’s is when we have a parabolic spike out to the 1.61.
Oh wait …
A big market top like this conceptually hard to get your head around with things being as they are …
But if there was to be one, we’d know where it’s going.

And we’d know what to do.
And if the crash was anything like every previous crash in history - we’d make a lot of great decisions at critical levels; because as I’ve mapped out this C leg plan here, it’d be equally possible to map out swing by swing a Great Depression forecast - since it’s only a C leg. Big C leg.
But here today, that would be too much!
Like I said at the start, if gap break comes then I guess this plan becomes actionable. We know our break areas etc and if the market acts like that, we’ll follow this plan.
Otherwise, I hope at least showing you how these ideals have worked in previous corrections and giving you specifics in such a way you can test it in real charts in real time is helpful.
Will help you a lot to be on the right side of C legs.