
Detailed look at breaking of bull traps.
Detailed look at breaking of bull traps.
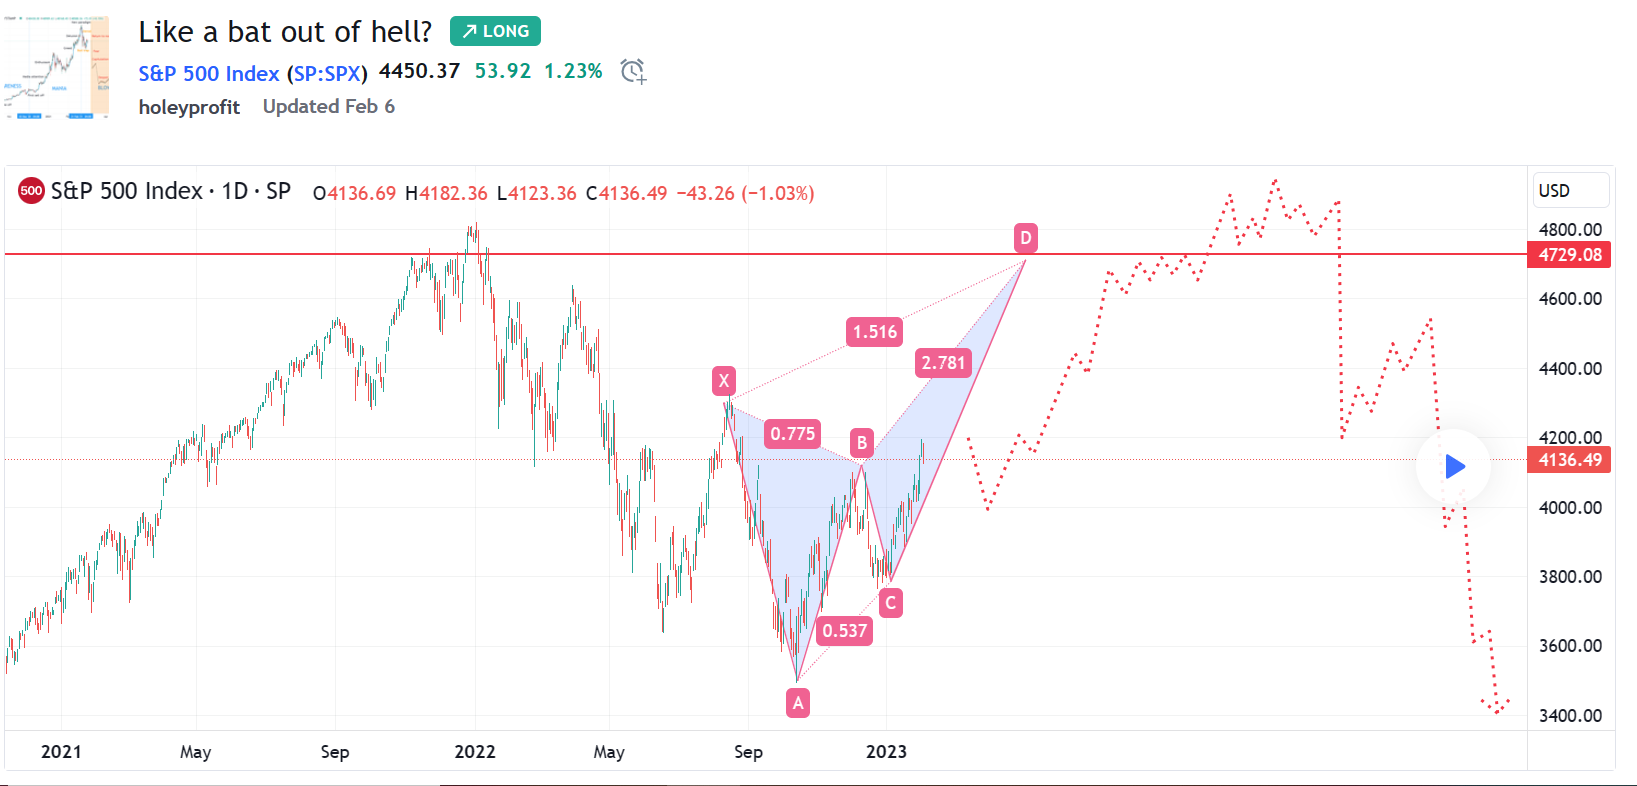
What we'd see if we had a typical bull trap failure.

In a previous post we showed how in typical bull trap style our last sell off is more likely to be a bear trap into a stop hunt that a true top:
Let's look at bull traps. - by HoleyProfit (substack.com)
We’ve now made a secondary spike out inside of the typical reversal zones. The style of the move was much in the style of a stop run (Consistent and makes most people think this surely has to be going at least a bit higher) and we now trade at a confluence of resistance levels.
Let’s take a more detailed look at how bulls traps have historically failed. Where we get our first big hints of the failure, stops where we can short rips into retests of breaks to take high RR positions and aim to determine the levels under which we’re most likely to have a free-fall drop.
This will be a macro bear trade plan, but bears should remain aware of the risk we could be wrong on the big bear forecast, or we could be right but still inside of a D leg that will spike out the high. Action to now is consistent with the bat forecast - if we’re in a bat, the momentum will be strong up on breakouts. Not conditions to hold shorts!
In this analysis, we’ll look at failures of various bull traps through the ages. Look to see where the common themes are. Where the high RR entries would have been. How we’d be able to determine if the setups traded had failed. We’ll then extrapolate these commonalities to modern charts to model a typical bull trap breaking and formulate trade plans.
Keep reading with a 7-day free trial
Subscribe to Market Forecasts and Trade Plans to keep reading this post and get 7 days of free access to the full post archives.