
Effective Trading Strategies for Bear Markets
Effective Trading Strategies for Bear Markets
Trading highs, middles and lows.

Effective Trading Strategies for Bear Markets
Bear markets are notoriously difficult to make forecasts and trades in. Mostly due to the fact that strong bear moves do not happen often or last long (So there’s not as many people well versed on how to deal with them), markets are faster and more volatile and there’s a lot of times the market will make fierce counter-trend rally in a downtrend which will crush shorts who do not know how to effectively lock in their profits.
Bulls can lose the same trade many times in a bear market because the up/down nature of it presents multiple trap scenarios where the market will appear to have made a bullish break, entice people to buy and they’ll end up buying in the upper fifth of the bull move. This repeats over and over and becomes frustrating for bulls.
Bear markets present a big problem for investors and also for most traders who do not have experience in trading bear moves. For investors, it’s counter-intuitive to the strategy to try to attempt to “Time” bear moves and they’re more afraid of the risk of losing gains than the risk of losing capital (Conditioned by friendly markets over the last decade, I’d suggest). People trading stocks and equities, tend to only know how to trade a bull move (Hammers see nails).
Luckily, bear markets are not actually as random and chaotic as they seem (At least historically). There are various norms that appear in a bear trend. These norms can be observed in the big historic crashes and also can be traded day to day in markets that go down as often as they go up (For example, the Forex markets).
This guide is designed to give you some practical tips on how to deal with a bear market. There are four mains skills you need:
Be able to determine bearish breakout levels
Be able to define high value to spots to sell rips
Be able to define points at which bear moves have failed.
Be able to work out spots to target and stop/pause shorting until a bounce comes.
These are the practical things you need to do well in a bear move. All the stuff about knowing the news and keeping on top of all the (Whatever is important today) updates are a distraction. As I write this now, the SPX has rallied for basically 6 months while the FED interest rates have increased at a record level.
Pow keeps saying bearish things and the market keeps rocketing. And honestly, this is not actually a surprise if you drop the context of what this “Should mean” and you examine what actually happened in the market the last time the same types of events took place. Historically, the market has ALWAYS rallied while interest rates rose.
Although this does not make sense logically, it’s a historical fact. If you backtest the result on an index when the central bank begins to raise interest rates, you’ll see they’ve always rallied. This even stands true of unknown or unexpected events. When the Brexit vote went through, the GBP would crash 30% in a few hours. BUT AFTER IT RALLIED. If you look at the overall move the rally is hard to spot, but I traded it in real time. I promise, it rallied really hard. When stocks collapsed on the 9/11 news during the Dotcom bear market, the market first rallied. A paradoxical outcome of 9/11 and all it implied for financial markets was the market first shot up.
I could go on all day citing examples of when there’s been some sort of event that has led to an asset collapsing ultimately but only after a vicious rally. Using these types of things as an indicator for market entries is fraught with dangers. Not only do events that move markets often come without warning (So you can’t track it anyway), but they usually have paradoxical reactions which make it very hard to make trades and profit from the knowledge.
As far as I am aware, the news is effectively useless in a bear market. In the times the news makes the market move down it will usually do it too quickly to capitalize on. If you try to work around this by betting the market falls before the news event, you’ll often just get whipped on the trade even if it turns out you’re entirely right. If this is countered by using no stop losses or wider stops, you turn it into something where you have to be right or lose a lot.
In all historic bear markets (And so far all of 2022 bear and the 2023 rally) there have been obvious and repeatable charting conditions. Understanding these charting conditions and using them to build strategies around will give you a far better chance of doing well in bear market conditions than reading whatever the recent headline is.
In this guide, we’ll cover the highest probability, easiest to follow and most useful recurring themes of a bear market and how to build strategies around them.
Prerequisite Knowledge
I’ll present these concepts in the easiest to follow format possible, but there are some concepts you need to understand before going further. If you already have a good grasp of these concepts you can skip to the next section. Covering basics is outside of the scope of this guide but we’ll give overall definitions and provide links to sources to learn more.
1. Bullish/Bearish Breakout: A bullish breakout refers to a situation where the price of an asset breaks above a significant resistance level, signaling a potential upward trend. On the other hand, a bearish breakout occurs when the price breaks below a crucial support level, indicating a potential downward trend.
2. False Breakout: A false breakout happens when the price briefly moves above a resistance level (in a bullish breakout) or below a support level (in a bearish breakout), only to quickly reverse and move back into its previous range. It deceives traders who entered positions based on the breakout, resulting in losses or stop-outs.
3. Retracement: A retracement refers to a temporary reversal in the price of an asset within an overall trend. It is a short-term pullback or correction against the dominant trend before the price resumes its original direction.
4. Correction: A correction is a more significant price reversal against the prevailing trend. It involves a more prolonged period of price decline in a bullish trend or price increase in a bearish trend. Corrections often aim to adjust overextended price moves and bring the market back into alignment with fundamental factors.
5. Fibonacci Retracements: Fibonacci retracements are technical analysis tools used to identify potential levels of support or resistance during a price retracement. They are based on the Fibonacci sequence, a mathematical pattern where each number is the sum of the two preceding numbers. Traders use Fibonacci retracement levels (e.g., 38.2%, 50%, and 61.8%) to identify areas where the price is likely to reverse or find support/resistance before continuing in the original direction.
6. Fibonacci Extensions: Fibonacci extensions are also derived from the Fibonacci sequence and are used to project potential price targets beyond the previous price swing. Traders use Fibonacci extension levels (e.g., 127.2%, 161.8%, and 261.8%) to identify areas where the price may encounter significant resistance or support as it extends beyond the initial move.
Please note: Fibonacci (Fibs) is a critical component to the strategies covered. Having a conceptual understanding of what fibs are is essential to understanding the strategies and having a functional understand of how to draw them is essential to following them. Please take time to learn about these if you do not know already (There’s tonnes of free resources online).
Bullish/Bearish Breakout: Investopedia
False Breakout: Investopedia
Retracement: Investopedia
Correction: Investopedia
Fibonacci Retracements: Investopedia
Fibonacci Extensions: Investopedia
The Four Big Skills
Be able to determine bearish breakout levels
Be able to define high value to spots to sell rips
Be able to define points at which bear moves have failed.
Be able to work out spots to target and stop/pause shorting until a bounce comes.
These are the only things you need to know. Absolutely everything pertaining to “Why” the market is moving is unessential to know. What you need to know is:
Be able to determine bearish breakout levels
We need to be able to tell when the market has pushed down through an important level which indicates the odds of it heading lower (And not heading higher first to stop us out) are favorable. It’s important to predefine the critical levels for the trend so we can be prepared in advance to make our decisions there.
We must not be reactive - it’s imperative to be proactive in planning important levels.
Be able to define high value to spots to sell rips
Most of the best trades in a bear market will come off a rally. We want to bet against rallies. Shorting into them and looking for high risk:reward pay-offs if the market drops back to the low. However, blindly shorting rallies is deadly. Shorting a rally at the wrong time with no plan to get out can lead to a lot of pain (For example, SPX recently rallied about 10% without any big drops).
We must not be reactive - it’s imperative to be proactive in planning important levels.
Be able to define points at which bear moves have failed.
Today SPX trades around 4360 with a high of the year around 4440. While SPX was around 3900 we’d be very bearish on it but as soon as we saw warning signs of the bear move failing we were able to get out and wait for a better spot to short (Which we’re trying again now). Understanding the levels at which to do this has allowed us to skip 10% of pain short and 10% to our potential profit.
A bear market will not go right down. It’s essential to know where to lock in profits.
Be able to work out spots to target and stop/pause shorting until a bounce comes.
The nature of a drop is to speed up as it goes along and then be in freefall by the time it hits the level that will become the bottom or a big bounce spot. Often bounces come fast and hard and they can eat up 50 - 80% (Or more) of running bear profits. It’s essential to have target levels in mind so we can lock in our bear profits while we have them.
When it’s time to take profit, you won’t want to. So plan ahead.
These are the only things you really need (And the only things really benefiting you) in a bear market. Everything else is noise. If you can define the points at which the market will make important decisions and then construct good bets around that, you’ll do a million times better than someone who’s in the loop on every news event.
While understanding these important levels sounds idealistic, as we go through this we’ll show you various real examples in historic crashes of how we could have done and this how we can apply the same theories and strategies to the market of today to enable us to do well if the market is dropping and not get hurt shorting it if it is not.
The Scope of the Risk
If a bear market comes, the severity of it can obviously vary. As bears, we have to be very cautious of the bear market ending before we expect it to (So we know to stop shorting and buy) and we’ll build this into the strategies discussed but if there were to be a full extensive bear market, the risk would be far beyond that of the average expectation.
I’m not going to make the case for a macro bear market here but if you’d like to read some more about it we did a series of posts back in December of 2021 explaining the risk of a deep bear market.
Previous bear market of 2008 may not be a helpful guide for how deep a bear market starting now would go because the magnitude of the rally is so much more. To find such extended rallies in an index in history you have to look at DJI of 1929 and Niekki of 1990 (Both of these resulted in drop of 80% + and took decades to recover).
Suffice to say, SPX back under 2000 would not be an unrealistic outcome of a true bear market. A full extended bear market (Using norms of historic ones) could be over 70% off the high. We’d be very, very early in the bear market now if that was the case. Knowing how to deal with a bear market would be a critical skill for anyone involved with investing/speculation.
Timeframes Used for Analysis
All of the concepts covered here are fractal in nature, meaning they work on weekly charts and small intraday charts. The lower the timeframe the more variance there is and the more times you can end up in tricky to read spots. On large timeframes, these strategies have been incredibly useful in previous bear markets.
If you’re a trader, these concepts can be applied to shorter time frame charts where you can trade high risk:reward setups that I’d expect to produce a strong enough win rate to create a positive trading edge. I’ve used them for this for years in Forex markets and more recently in stocks since they weakened.
If you’re an investor and just looking for ways to help to protect your portfolio, it’s much better to stick to the daily, weekly and monthly charts where there’s a lot less noise, you have more time to watch things setup and things are generally less confusing. A wise move for investors may just be to leave the market, if you want my opinion.
We’re going to base the work on this on large timeframes. It’s easiest for us to show the historic examples in big crashes, it’s less confusing to follow if you’re not well versed in the methods used and in explaining the strategies we’ll also generate the real levels we expect to be important and actionable.
Determining Bearish Breakout Levels
With the power of hindsight it is easy to see if we’d exited long and shorted SPX in this zone in 2007 that would have been a really good decision. This is when the market made its critical bearish breakout.
Or getting out here in the Nasdaq in 2000.
Both of these were followed by drops of 0vre 40%.
Interestingly, if we were to draw a fib extension from the low to the high of the final move to the top in both of these, we find that both of these bearish breakouts came when price went though the 161 extension.
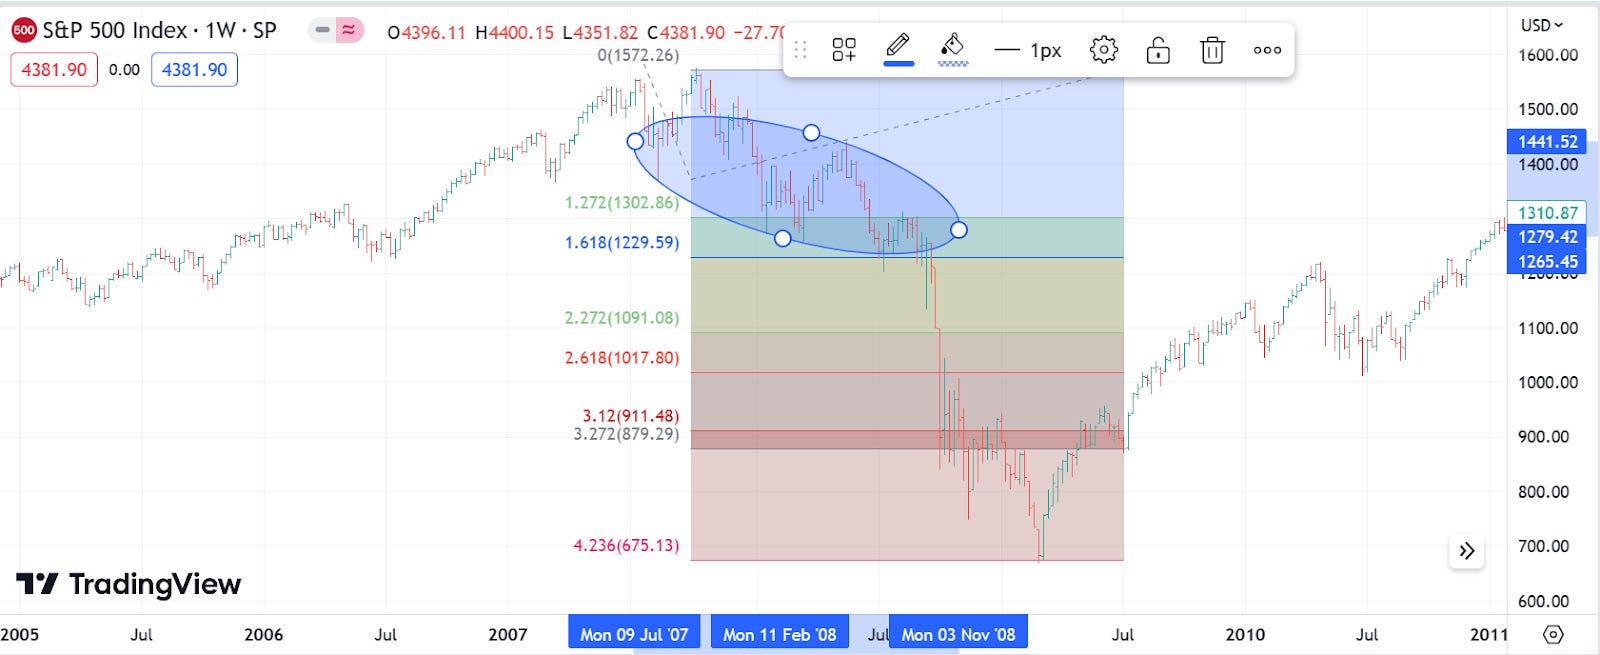
In both instances here the market was in a sharp fall. It hit the 161 area and then it bounced, once this bounce failed and a new low was made, the crash would come.
With the context of that, it’s rather interesting we’ve bounced on a 161 in the recent SPX move.
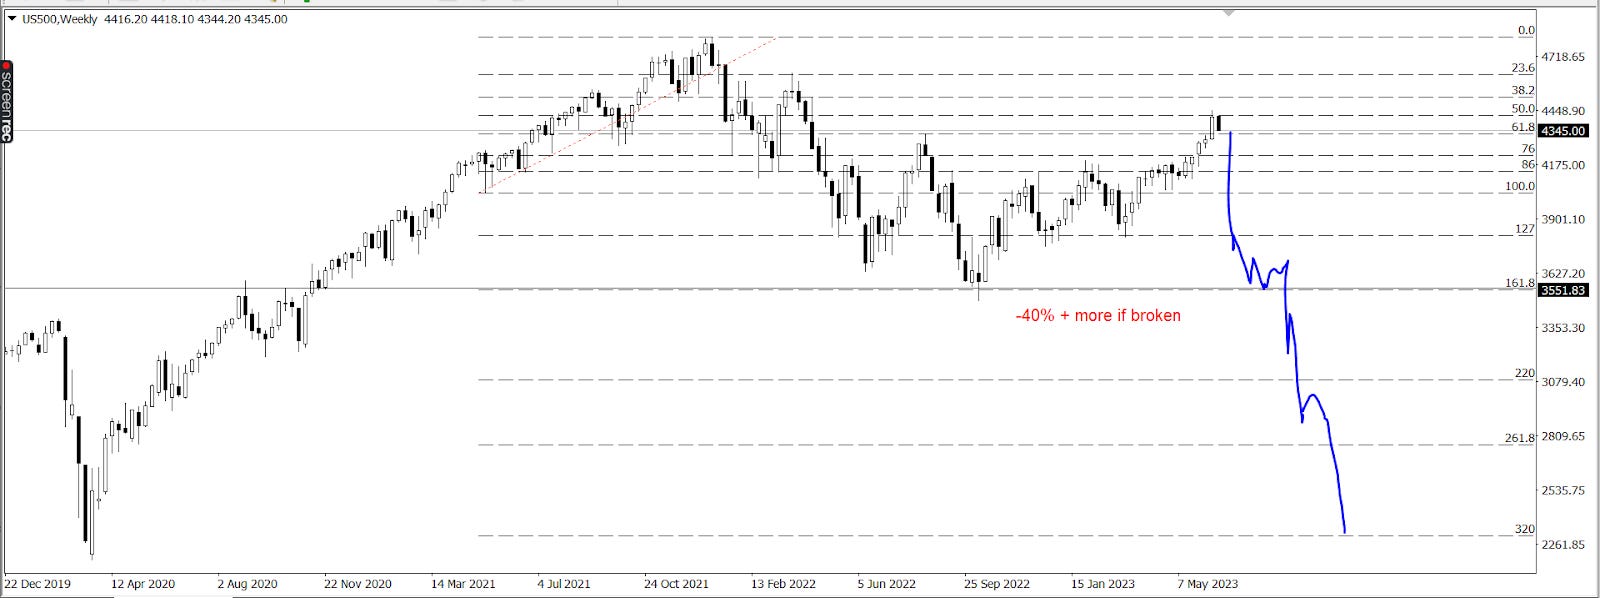
We can use this same strategy to give us forewarning that the market may enter into a freefall crash if it breaks under 3550.

To show how this theory can be adapted for day trading, SPX has a local spike high and 161 break happening here.
Chops around the 161 and then enters a stronger fall under it. This is the real time chart as I write this on the asset we are using for a charting example. It's as far from cherry picking as it can get - and this was effective. Helped to spot the intra-day break before it formed.
From this tendency we can define that if the market gets under 3500 there could be extreme weakness. We want to use simple bear breakout and retracement strategies and avoid buying. Buying will get tempting, it will feel cheap. Seems like the bear move is overextended - but the drop after the 161 break is bigger than the first. We should expect something more than 2022.
Where to sell rips
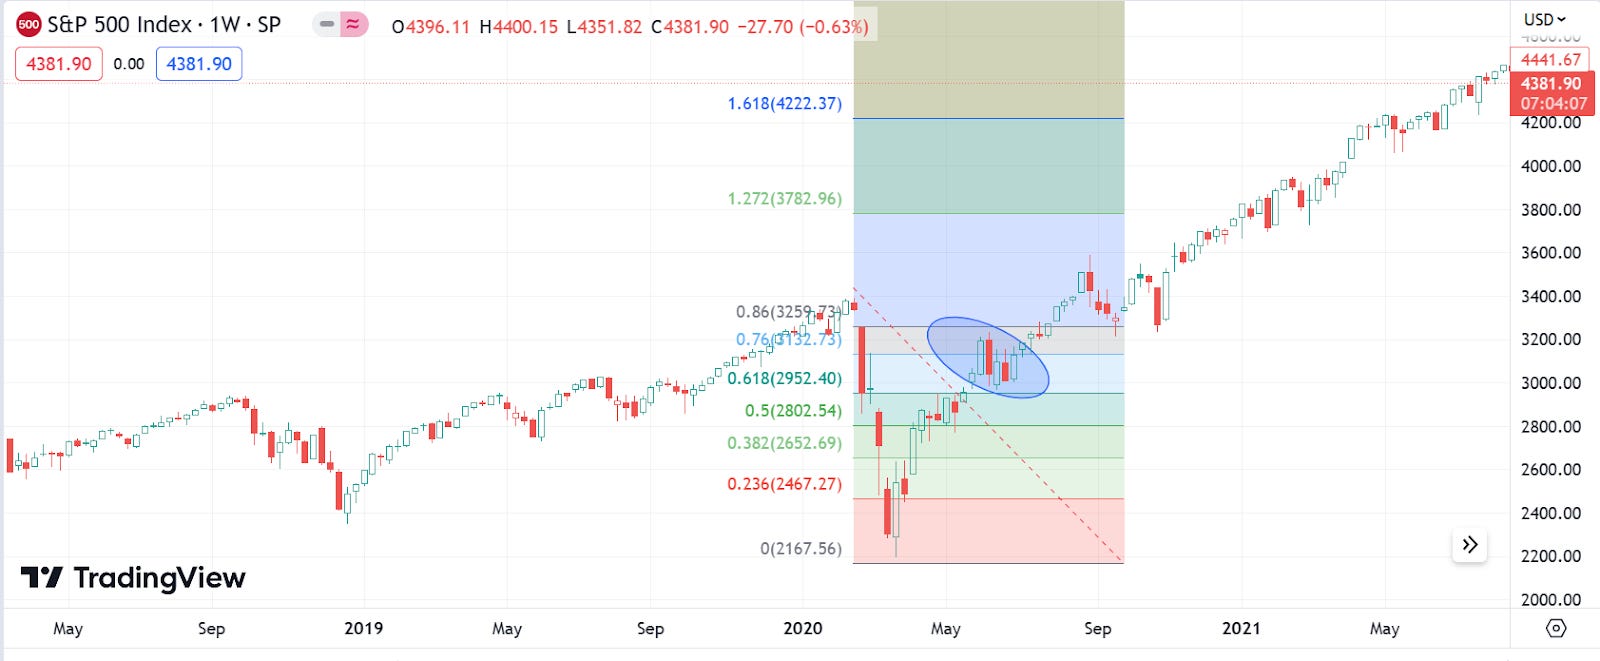
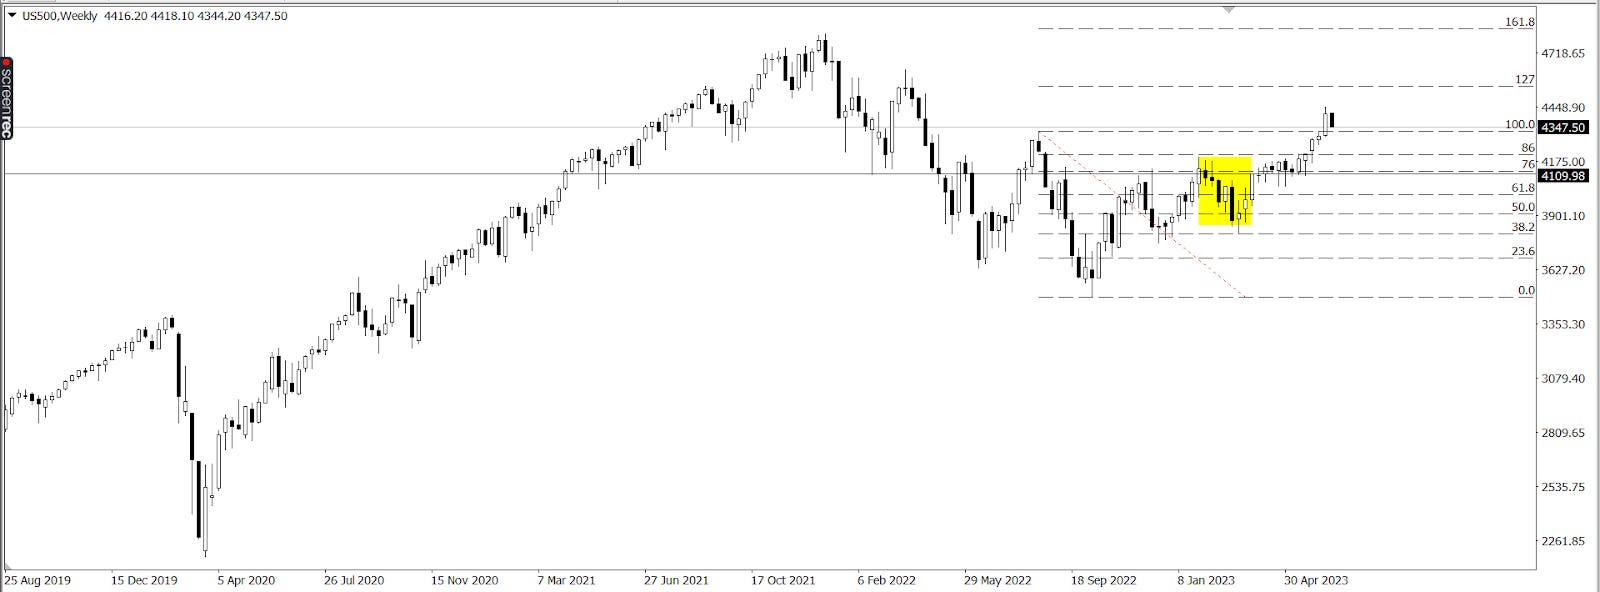
Historically in index crashes bull traps have tended to end around 61% (With a bit of a spike out) corrections.
I can tell you from real experience trading these patterns in bear moves over the last 5 years or so it’s much more common for these to actually go to about 76 fib these days. Usually there’s a bit of a trap around 61 fib and then we go into a strong blow-off top rally. This historic tendency held true in the 2022 bear. Obvious 61 - 76 retracements and highs.

When we use this common trait of market corrections in a downtrend, we can see we’re now trading right into what should be considered to be the big danger area. If a classic sell-off is coming, it should come from somewhere around this zone.
For another extrapolation of how this can be used in day trading, here’s a 76 correction in the current price action.
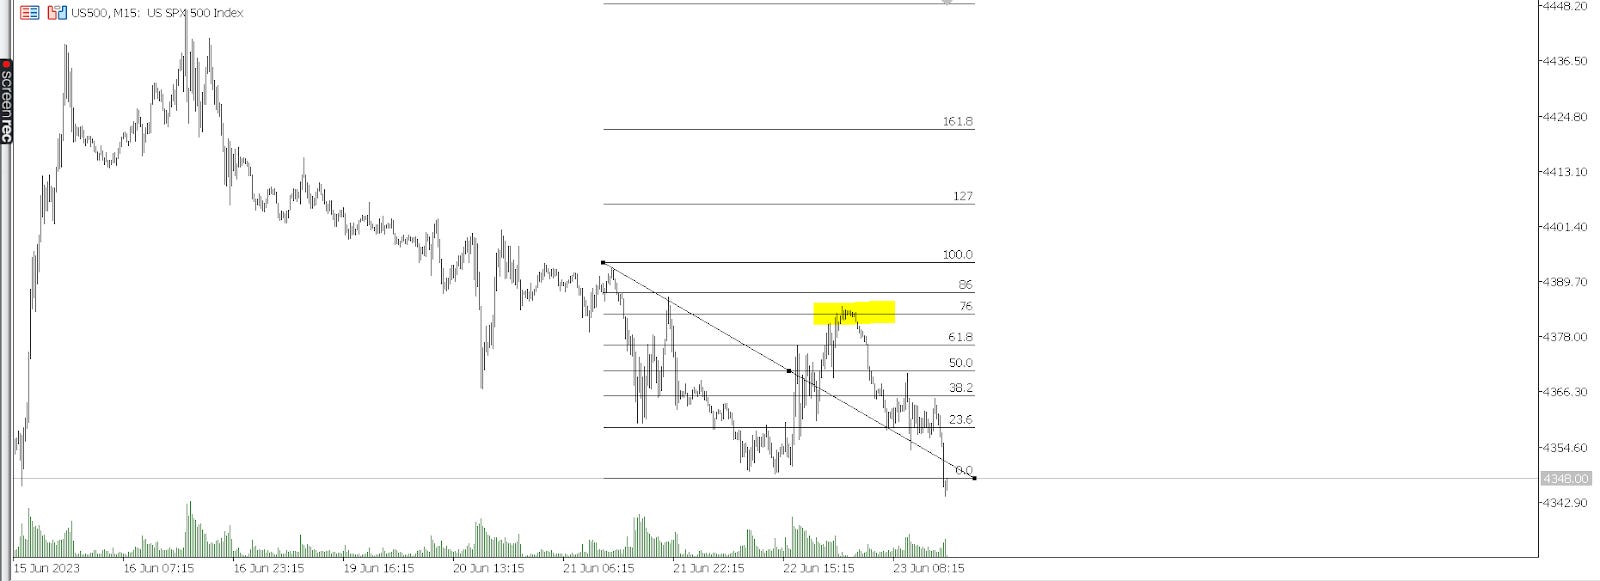
The market has a high at the 76 and then it went into a sharper fall under the 161.
Nasdaq, DJI and SPX are all sitting on these big 76 retracement levels right now. From this concept we can establish we’re at a maximum risk for bulls and a spot where bears have high risk:reward opportunities. This is at time of writing, 23rd June 2023 while we trade around 4350 in SPX.
Knowing where to stop out
The above 76 strategy is also very helpful in knowing when to stop out a position. Usually, if the 76 level fails and the 86 level hits the market will ultimately go higher overall. Usually there’s a bit of a trap reaction at the 76 fib but once it is broken the market is strong. Here’s an example of this signal failure flagging the start of the 2021 rally.
Here’s how the failure of this 76 high strategy warned us early the bear trend was breaking in 2023. Once the 86 fib had hit, we knew we had a better edge buying the dip than shorting.
Once it is broken, I know it’s better for me as a bear to wait for either a new low or the price to head to a higher 76 fib. Allowing me to miss being short during the bulk of this rally.
For day traders:
From this concept we can establish the market will most likely make a high under 4550 and if it does not, it will probably make a new high. Might even be a new full bull market (Or it might be a spike out trap, which are difficult to effectively model. It just has to be considered a known risk). If we bet on a high here we’re not trying to be “Right eventually”. We have a very small area of risk.
Where to target
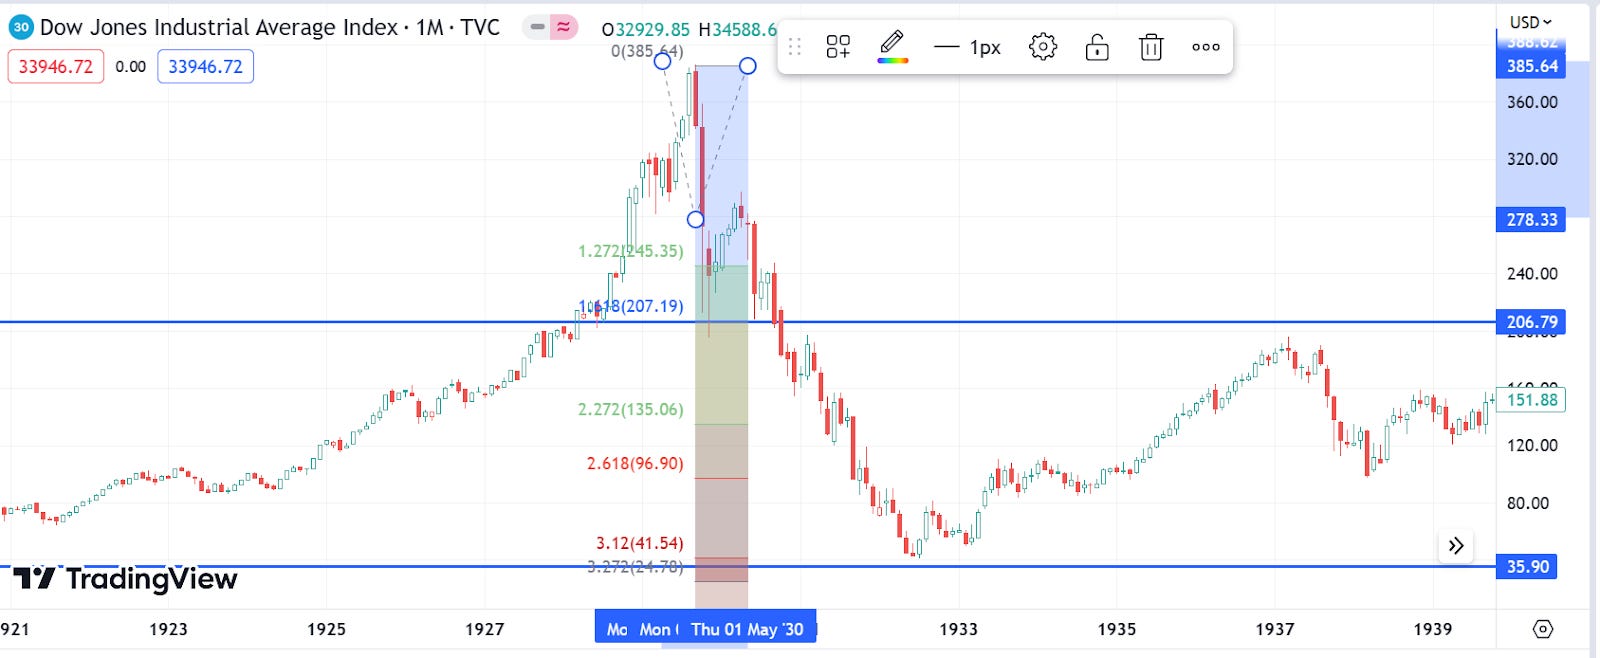
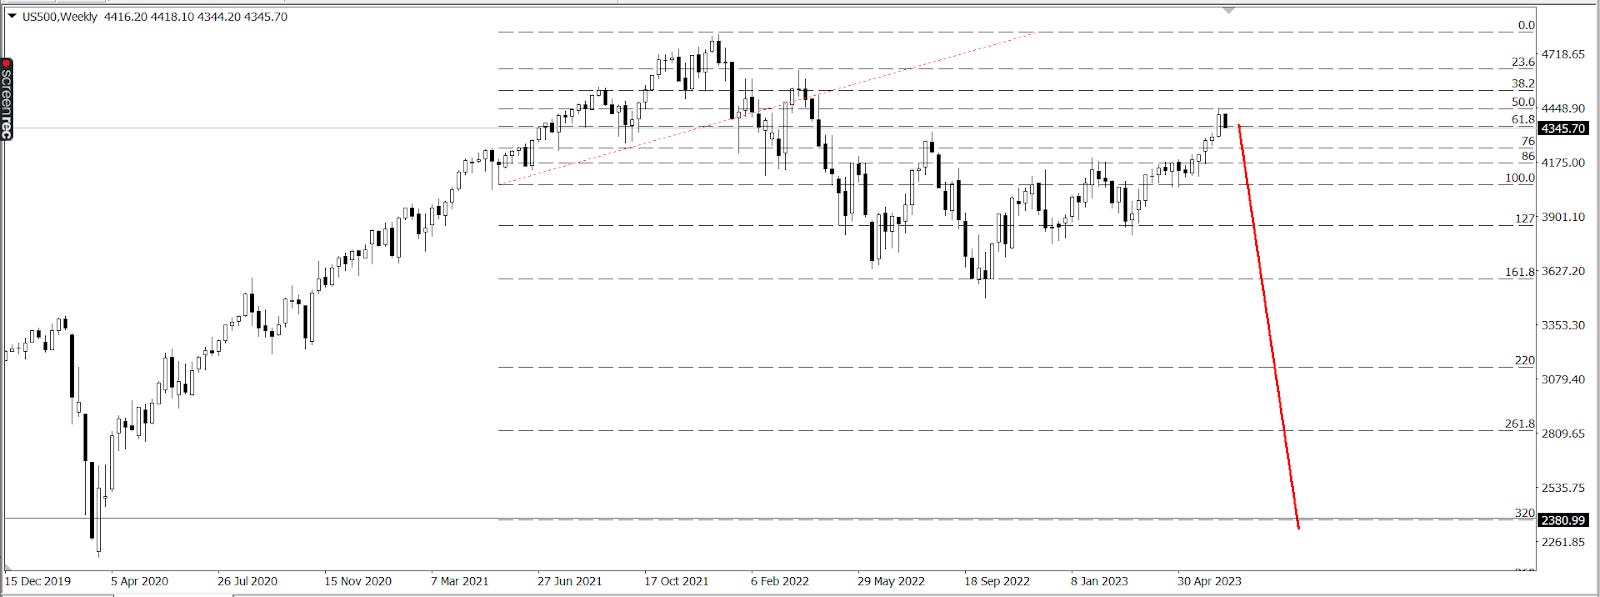
There’s a logical sounding rhetoric that it’s hard to determine where a market will bottom. While there’s certainly some nuances to it - this has been historically quite easy. Where the market has bottomed has always tended to relate to the fib extensions from the topping swing (The one we can use for the 161 break).
Revisiting the 2008 crash, we can see once the 161 broke the market went straight down to the 320 fib level. Chopped there. Made a low on the 423 level.
As was true of Nasdsq (Without the final 423 spike).
And this concept in markets is older than most of us. Here was the 161 break and the low of the 1929 Great Depression.
Which is exactly what would happen in Japan off the 1990 high.
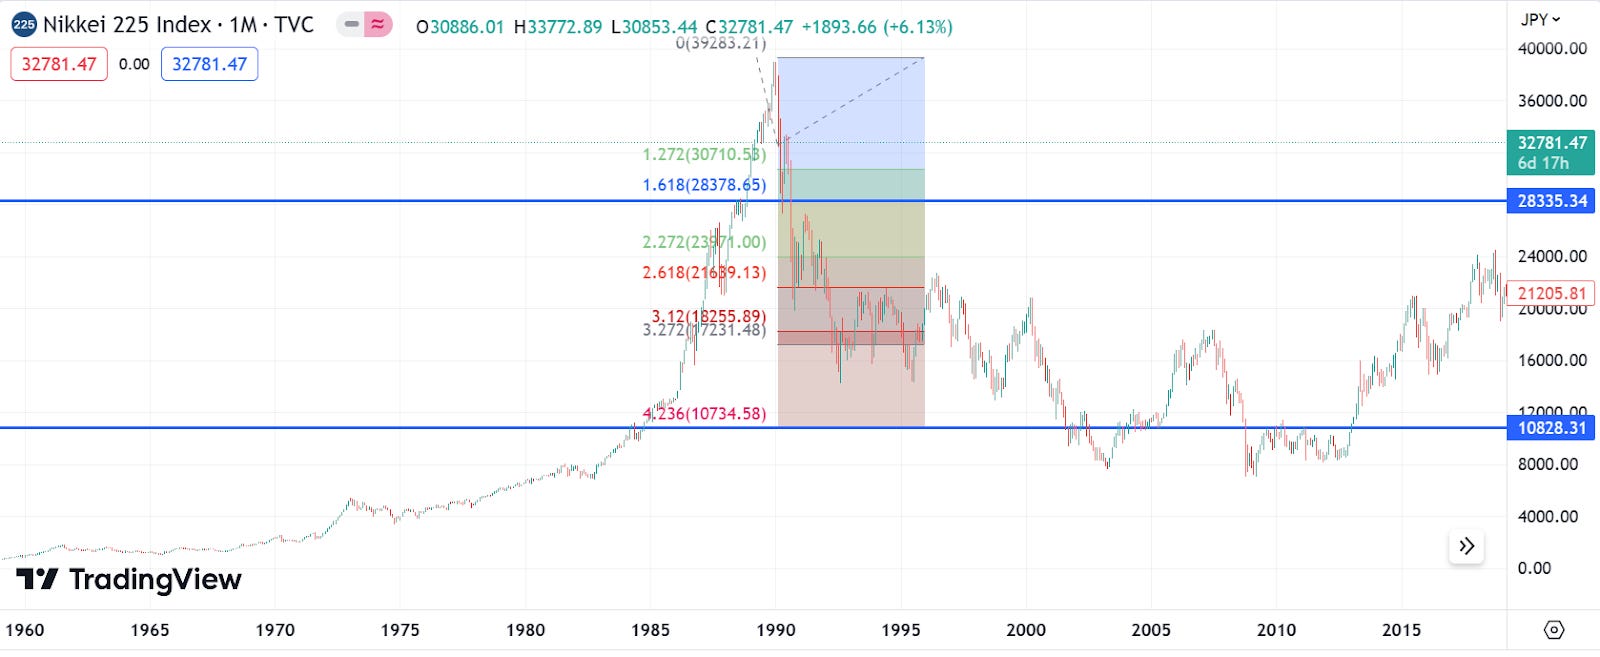
Do you believe in coincidences? This would seem highly improbable in a random market.
And please note, we’re always just using the top swing here. There is only one topping swing. So this is not curve fit by drawing the fib where I want it to be so it “Says what I want”. I encourage you to backtest this yourself to see.
From this concept we can understand that if the market breaks and goes into a strong downtrend, we’d be best to follow that trend (As long as it does not break retracement rules) until it gets to the 320 fib area. 2400 minimum target for a SPX break of 3500.
Join our newsletter to get real time updates as these strategies develop.