

Fib Norms in Trends: Why 4.23 extensions are critical.

In this post we’re going to discuss the norms of trend development and reversals (or deep corrections).
Through this piece I aim to prove to you that most big trends (This can be bubbles or busts) fit into an approximate model and when this model is in play the reversal usually comes around the 4.23 extension of the fib set that will give the actionable break levels along the way (More on that later, I know it sounds confusing).
First a few big current examples for relevancy. SPX currently trades a bit above the 4.23 of the 2008 drop.

In a sort of speed run example of this, MSTR has a similar looking chart.

By the end of this I hope to have shown you sufficient evidence for you to believe it’s reasonable to think there could be risk of a major reversal here (We’d be talking a drop of not less than 75%). To show you up to now these trends have followed “The norms” and this is a reasonable “Expected next step” (As extreme as the forecast are).
Here’s my models of what I typically see in a full trend to 4.23 and reversal.


4.23 Exhaustion Reversal Strategy - by HoleyProfit
In these templates I’ve not marked in the full reversals, but these 4.23 high/lows are major pivot points. Big reversals come in these patterns.
First thing I want to do is show you this model has worked up to now. That drawing fibs on the right swings has yielded the important levels so far in these major trends and the things that have happened are “Norms”. We can look at historic trends to a 4.23 fib and reversals from them and pick out key features - which have happened.
To do this I am going to show you that if you knew where to draw the fib you could have done a back-study on the 2008 crash and used that to create a trading model that would have told you all the important levels in the MSTR rally.
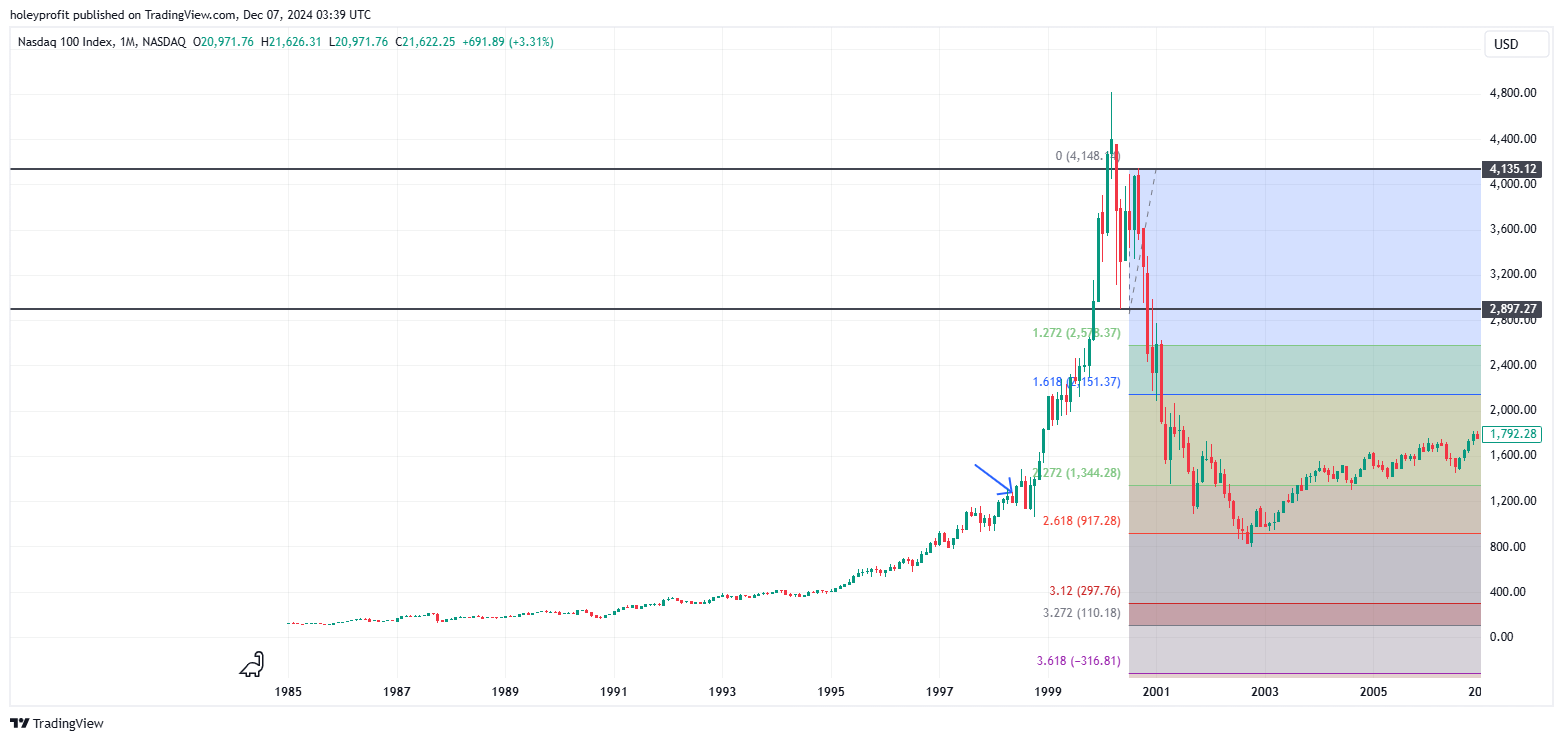
We’re going to take these important fib zones;
1.27 - 1.61.
2.20 - 2.61
4.23 - 4.23 spike out.
Everything I am going to show you is something you could have spotted in real time.
First observation we make is there is a pullback in the 1.27- 1.61 zone.

Next is when the 1.61 is broken there is a fast move to the 2.20.

From the 2.20 we bounce back to the 1.61. So if we were creating trading rules for this good rules would be something like look for spike outs above the 1.27 and aggressively protect profits as we get into the 2.20-2.61 fibs.
Model rule: There will be some sort of pullback 1.27 - 1.61 and then a strong trend to 2.20 when 1.61 is broken.
After this pullback off the original 1.61 break, there is a 2.61 break. This is a capitulation period to the 3.60 fib.

Model Rule: 2.20 - 2.61 zone can be a retracement but strong trend when broken. Target 3.20 - 3.60 and then protect profits aggressively.
Finally the 4.23 is hit. There is an initial short term low and a spike under it. After the spike under it there is a steady run of bullish candles to get back above.

And, in theory, that’s all you needed to know to see all the important levels in the 2008 crash in advance.

Model rule: 4.23 spike out and recovery is end of the trend.
Here are the rules we took;
1.27 - 1.61 usually a pullback.
1.61 break means strong trend to 2.20.
2.20 - 2.61 are risk areas for pullback.
2.61 break foreshadows strongest part of the trend.
By 4.23, the trend is getting exhausted.
Here’s the MSTR chart.

They are not exactly the same, but the general rules are effective.
How many times do we have to see this in major prolonged trends to consider it valid? Obviously more than two but realistically not more than ten if we’re able to match multiple parts. Clear zones in which traps occur, the style and tone of action on breaks and then the approximate target levels.
If we can get all of those data points right on both bull and bear trends that are built up over years and decades - that’s “Beyond what chance would predict”.
BB followed this sequence of events for a decade and then made the predicted pop.

In 2021 there was a mini version of this and it was the same.

Real time forecast of the 2021 BB high below.

BTC made its low on the 4.23 after following the norms of the zones.

It did that after making a 4.23 high.

Granted this one is a little displeasing to our model because we have no 1.27 - 1.61 pullback and the top is just before the 4.23. But the high could have been anywhere, right? And it’s … there.
Big reversals not only can happen at big 4.23s, they are more common than not. I’d put it somewhere in the 20% range there isn’t a big pullback off the 4.23 (And this is talking about trends that did continue, totally discounting reversals). Breaks are rare, mean reversion is common.
While slightly displeasing to our model in the boom move, BTC was very typical of the correction after a 4.23. Having its main bounces around the previous fib levels and then ending on a spike out of the 1.27.

This is always going to be essentially a round trip of the move and it’s usually going to be around 70 - 80%. That’s the trend continuation pattern.
Now that you have more of a feel for the overall expectations of the pattern, go test this. Zoom in on the 2015 - 2016 pullbacks. Draw the fib and then look at the reactions to the levels along the way.
BE AWARE … (in case you’ve somehow not spotted it yet), it is possible to literally be entirely sure that somewhere around the 4.23 extension there will be a crash (Or major low) be absolutely right about and still go bust betting on it the wrong way if it makes a big stop run.
What we’re talking about here is a great roadmap for the big important levels but 4.23 spike outs can be insane. True blow offs.
Case in point, it could turn out to be 100% true that the 4.23 is the major actionable reversal area for the SPX uptrend. That might be true, you could have easily seen us getting into that area and you could have even shorted the 2022 high …

Wouldn’t be doing your 1.27 target any favours today.
Now, hypothetically, if this happened - this would be perfectly fine inside of the expected 4.23 model.

Refer to the template. Spike above 4.23.
And in the grand scheme of things, the 4.23 reversal forecast would have been exceptional. Just wouldn’t have helped you betting on it. A lot of tactical nuance and caution is required to deal with the spikes (Readers from 2023 hopefully will remember me harping on about 4.23 spike out risk).
A Bullish Thing
People say I never say anything bullish, so here’s the bullish side of this.
I have one strong underlying belief (Which I think is a Truth of the market) and that is that trends will not slow down. They go faster and faster as they develop and then they reverse faster than they formed. In the overall view, a trend is ALWAYS picking up velocity.
I’m sure those who read all our work will know I’m being a little snarky when I say I never say anything bullish because I almost invariably have my bear plans as “Should drop here or probably goes parabolic to …” and while no matter what happens I believe we’re inside of major bubbles - I don’t see that as default bear thesis.
I did see it as a default bear thesis. In 2019. Worked for a little while. Lessons were learned. Now I know realistically my methods are good for forecasting the levels where decisions are made but if those level break - I need upside plans. Something being in a bubble means the mega short is wrong 99% of the time.
(If we class a topped bubble as no longer being in a bubble and instead in a bust).
So this means my assumption if resistances break is the only rational outcome to expect is that the trends will just get stronger. I actually think it’s entirely irrational to think if the trend does not turn it can do anything but get insanely strong. It has to surpass what has been, and this has been … a lot.
I am equally willing to accept we’re at the top of a mega bubble as we’re at the middle of one and the next breakout sets up SPX 10,000. When it comes to betting, I’ll bet on the resistances and reverse if these are broken. Inside of this thesis, SPX would have to double extremely quickly - to comply with the “Truth” of stronger trends.

Base three might have 2020. And the doubling might have happened. Or we might be at it.
Indices look like they hyper crazy right now and can’t get substantially stronger, but when you look at mid points in bubbles (Or even early) you can see similar things.
And I think it has to be one or the other. We’re either late in a bubble or we’re still inside a developing bubble and it’s the Law of the trend that it can only get stronger.
The failure of the 4.23 to act as resistance would convince me that the more rational thing to expect is for there to be a hyper boom. Nothing I use for trading trends would tell me to expect anything else. Trends only get more spectacular when breaking big pending reversal patterns.
A Dramatic Change of Tone
I really can’t think of any time I’ve seen price getting to a major 4.23 and become less exciting than the previous trend was. Either there’s a spectacular reversal or spectacular breakout. I can’t think of ever seeing anything boring. Dull. Limping through the 4.23 or steadily pulling back.
It always kicks off.
We are at an extremely long term 4.23 now and the action preceding it has been wild. Everything I know about fibs tells me it should only get wilder from here.
Whether it’s a bull or break move, there is likely to be a dramatic change of tone in markets when the 4.23 decision is made. We’re either around an extremely important high or we head into a period where markets begin to go close to literally vertical.
Most of the time when we have the 1.27 - 1.61 thing, then the 2.20 - 2.61 thing and then the 4.23 thing … the 4.23 spike out is terminal to the trend. We’re in the area of max for that now.
This isn’t a “Said that before thing”. In all of the action since the 2009 low there has only been one instance where we touched the 4.23 extension. That was the 2022 high. This is the only instance of us spiking out that. Being either in the head fake or the failure of 4.23 as resistance.
It’s a moment 15 years in the making. I wonder what will happen.
Whatever it is, won’t be boring (in theory).