
Full Bull / Bear Plans.
Full Bull / Bear Plans.
And why I am still bearish.

Let’s do a complete round up of indices.
We’ll do bullish and bearish analysis for completeness but I should say early on I am firmly skewed towards bear. I can write up a really nice TA case for the bull now but I find it hard to be bullish after such a run while we trade at critical fibs resis. I’ll elaborate on this more later.
I have, unfortunately, gotten myself into the predicament I warned of so many times when it comes to shorting rallies. I missed the easy spots to reverse and we moved so quickly from one resis level to the next I find myself perpetually wanting to short. I find it really hard to go long something that isn’t pulling back.
Personally, I feel more bearish now than I have all through 2023. But the nature of the move to this point and implied risks for bears if we follow through on this would make it irresponsible to not put out bull paths also. I feel I really dropped the ball over the last month. Was the worst period in the whole time we’ve ran this newsletter.
SPX
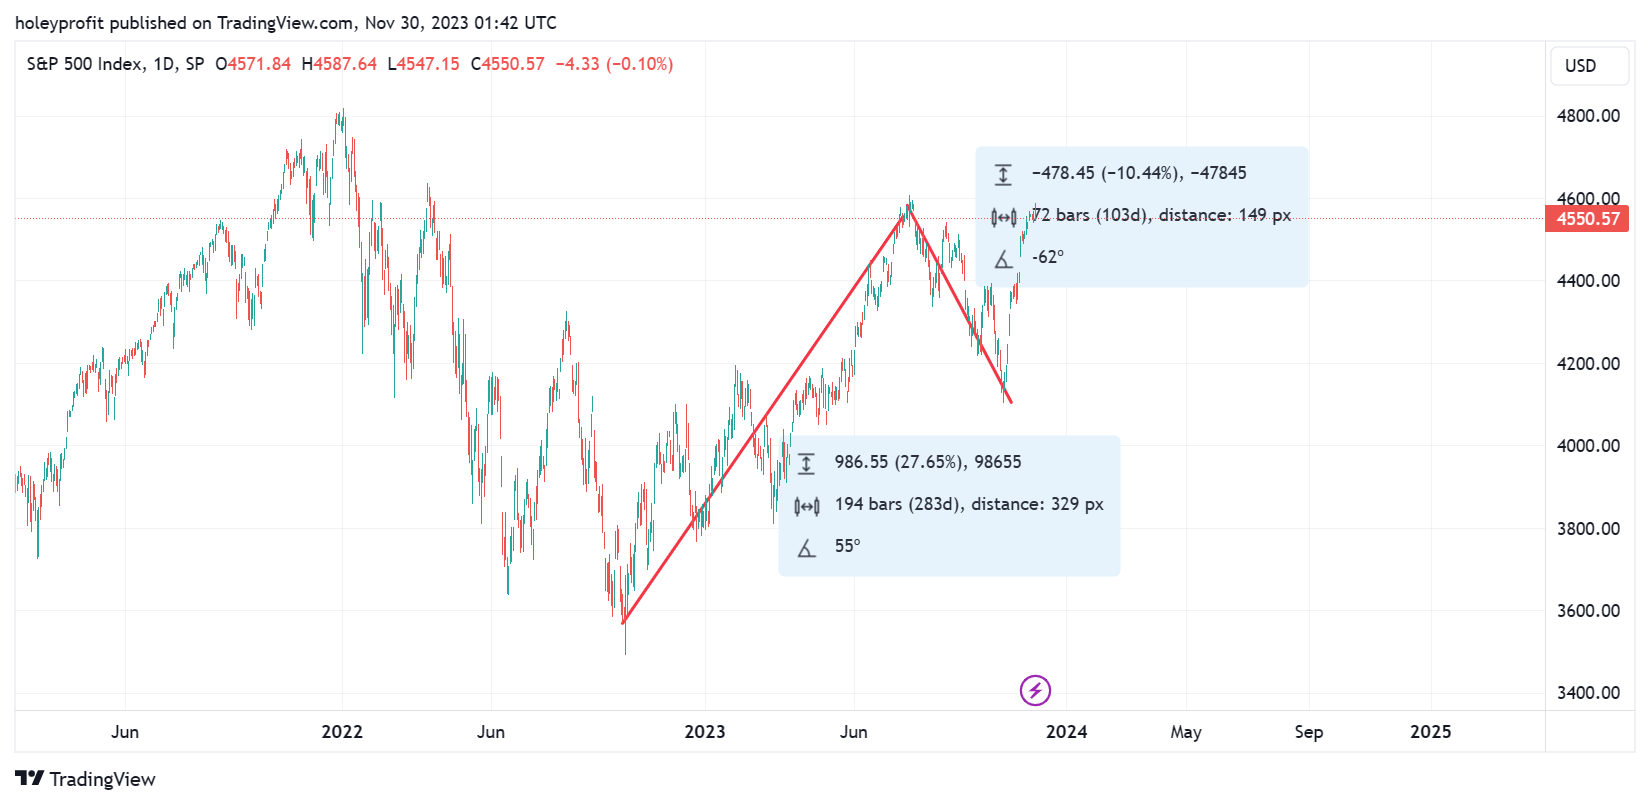
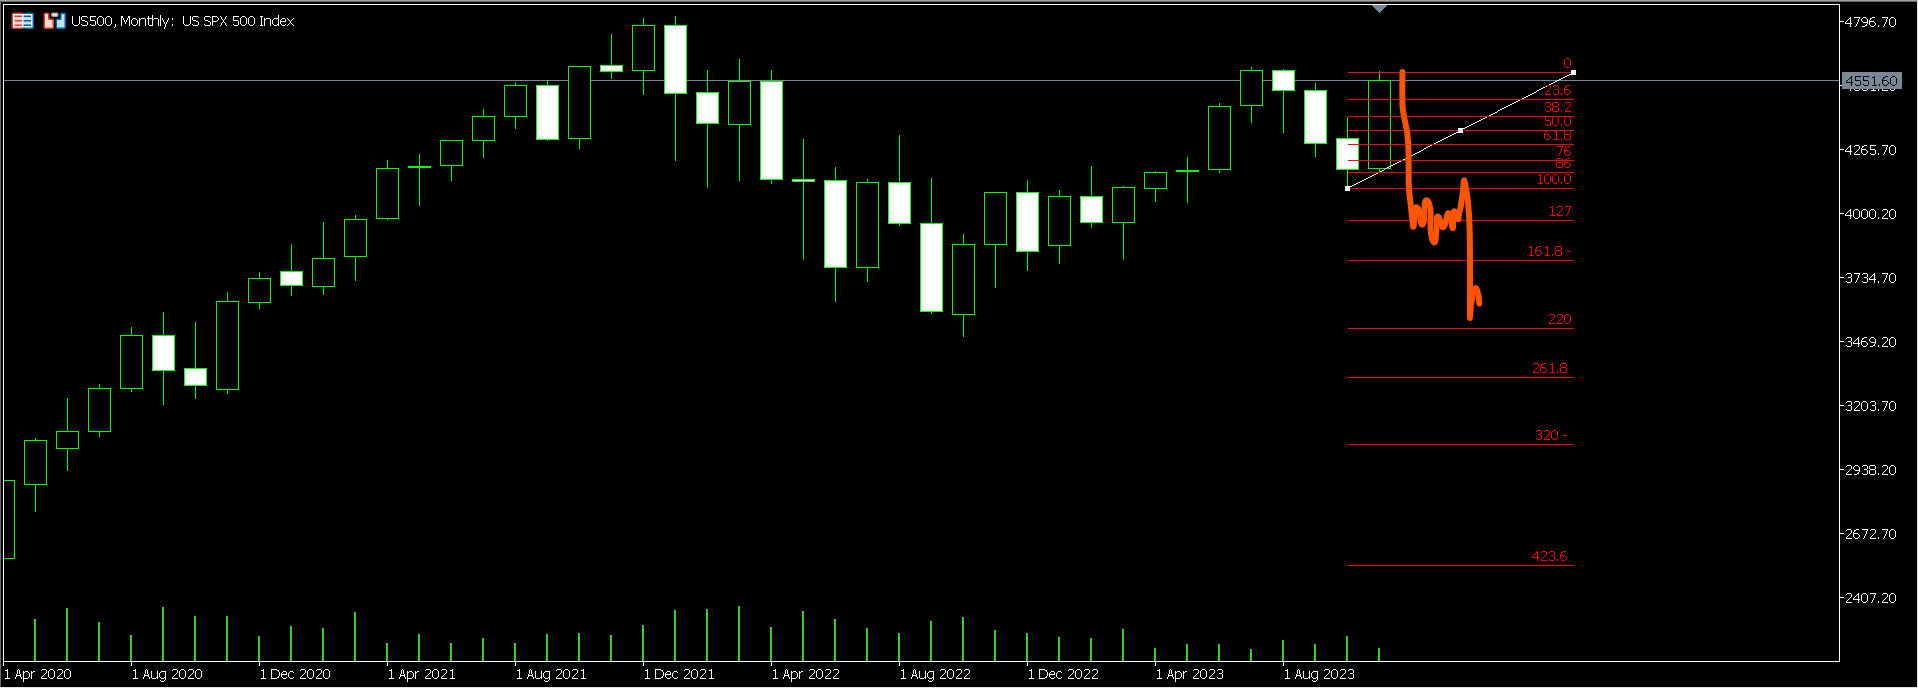
The easiest way for us to plan SPX upside levels here is using the W structure from early 2022.
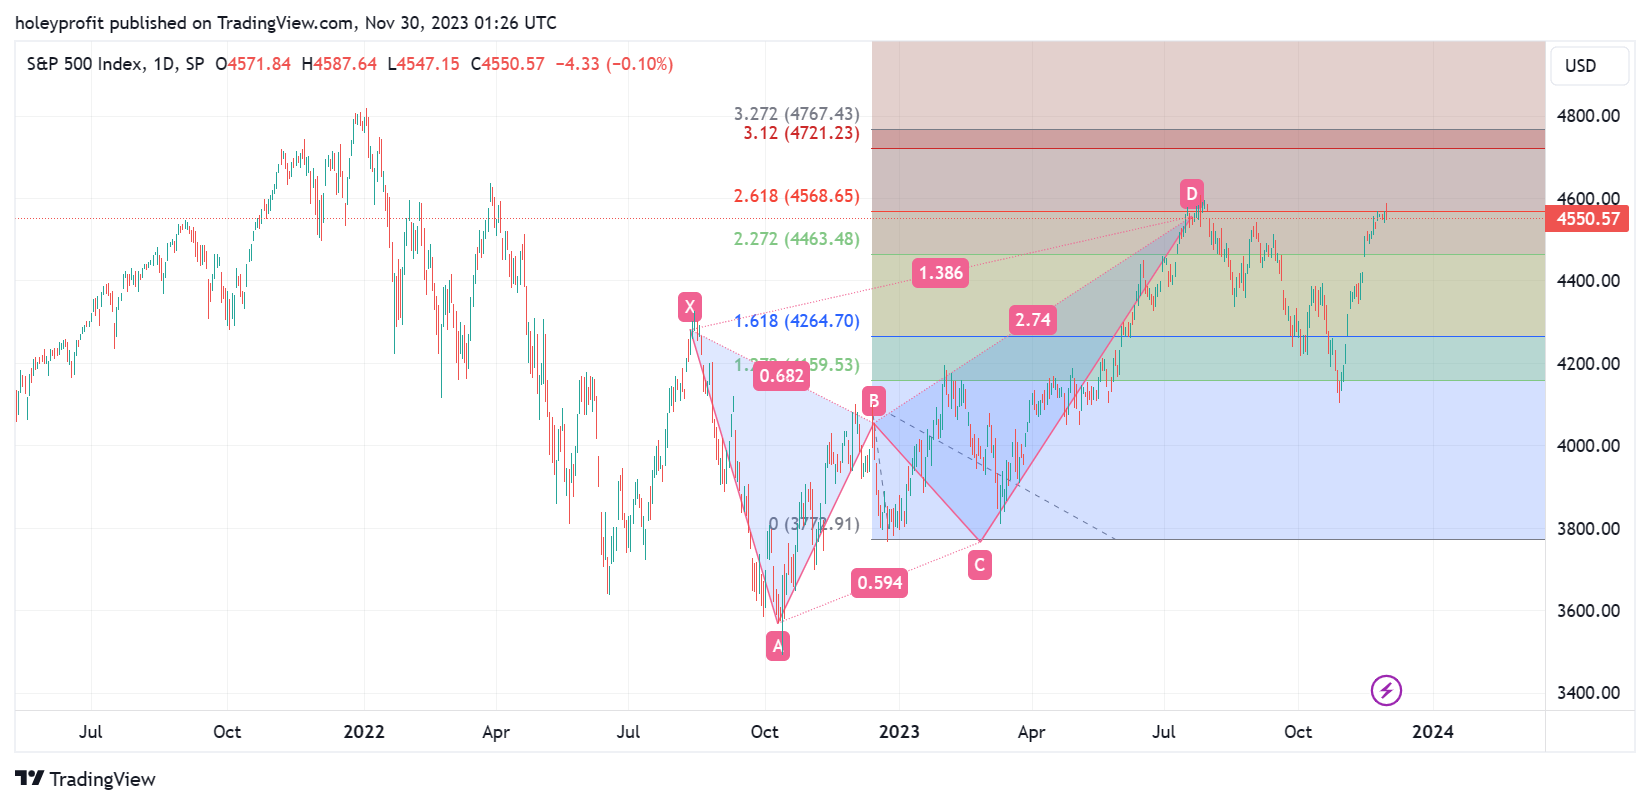
We currently top on he 2.61. This is a bat pattern. If the bat fails we get a crab pattern which terminates somewhere 3.20 - 4.23 (Really big range, unfortunately). The move from 2.61 to 3.xx is always a parabolic move in this setup since we’d be trading near the end of a D leg - the most impressive of moves happen in these.
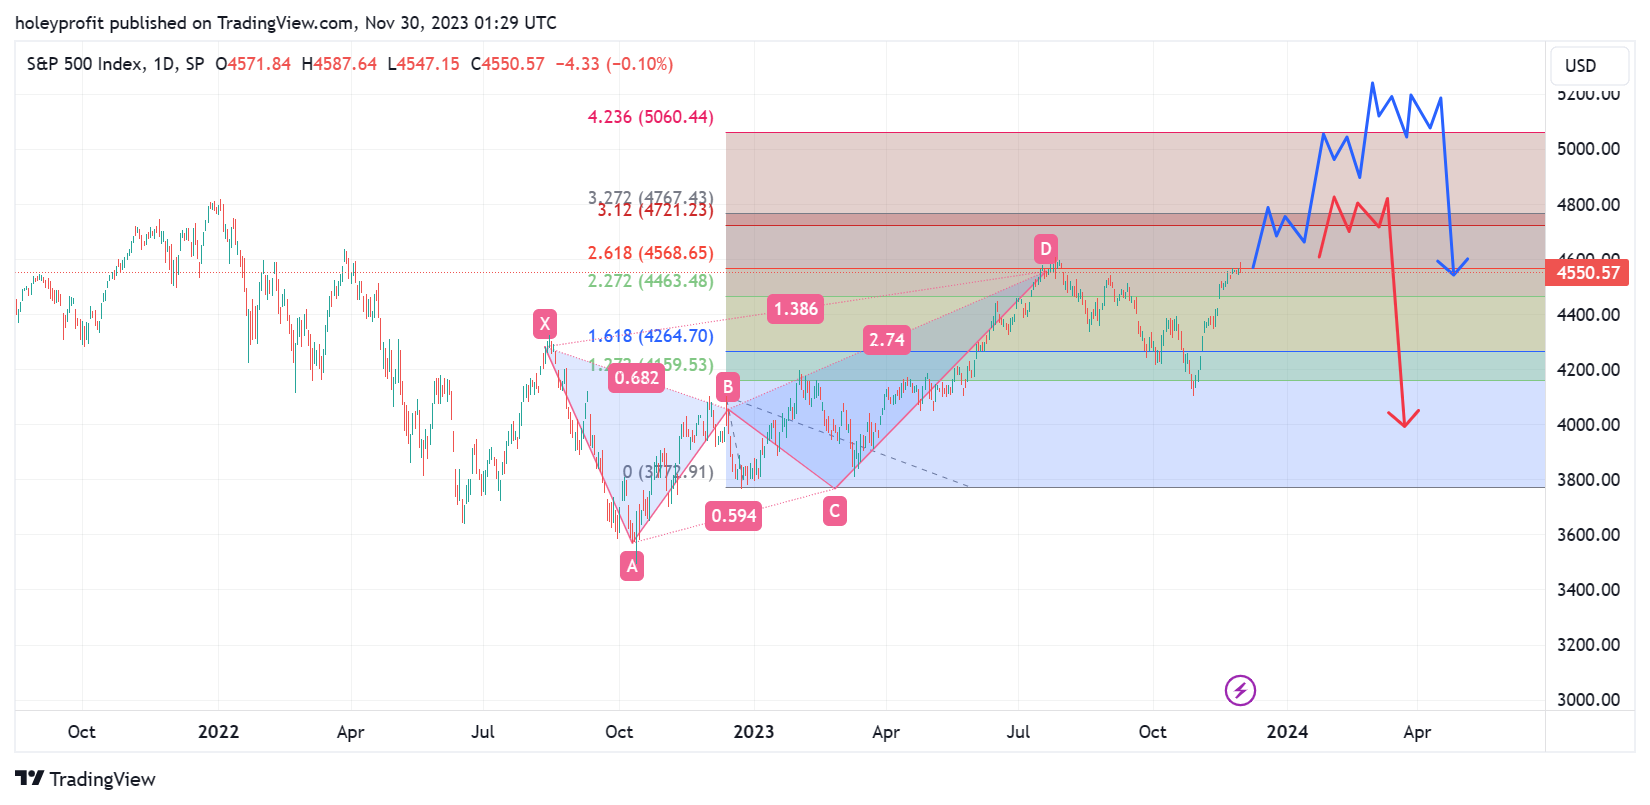
Here would be our levels for a crab and a full extension and 4.23 spike out.
As has always been my premise when it comes to bull trades, if betting on the bull side the bet that makes most sense is aggressive OTM calls. Because if we go up it is likely to be in blistering style and if aggressive trades do not work conservative ones would probably bank a net loss also.
So if you’re getting the same type of risk exposure on both bets, the aggressive one makes more sense if it pays off much more.
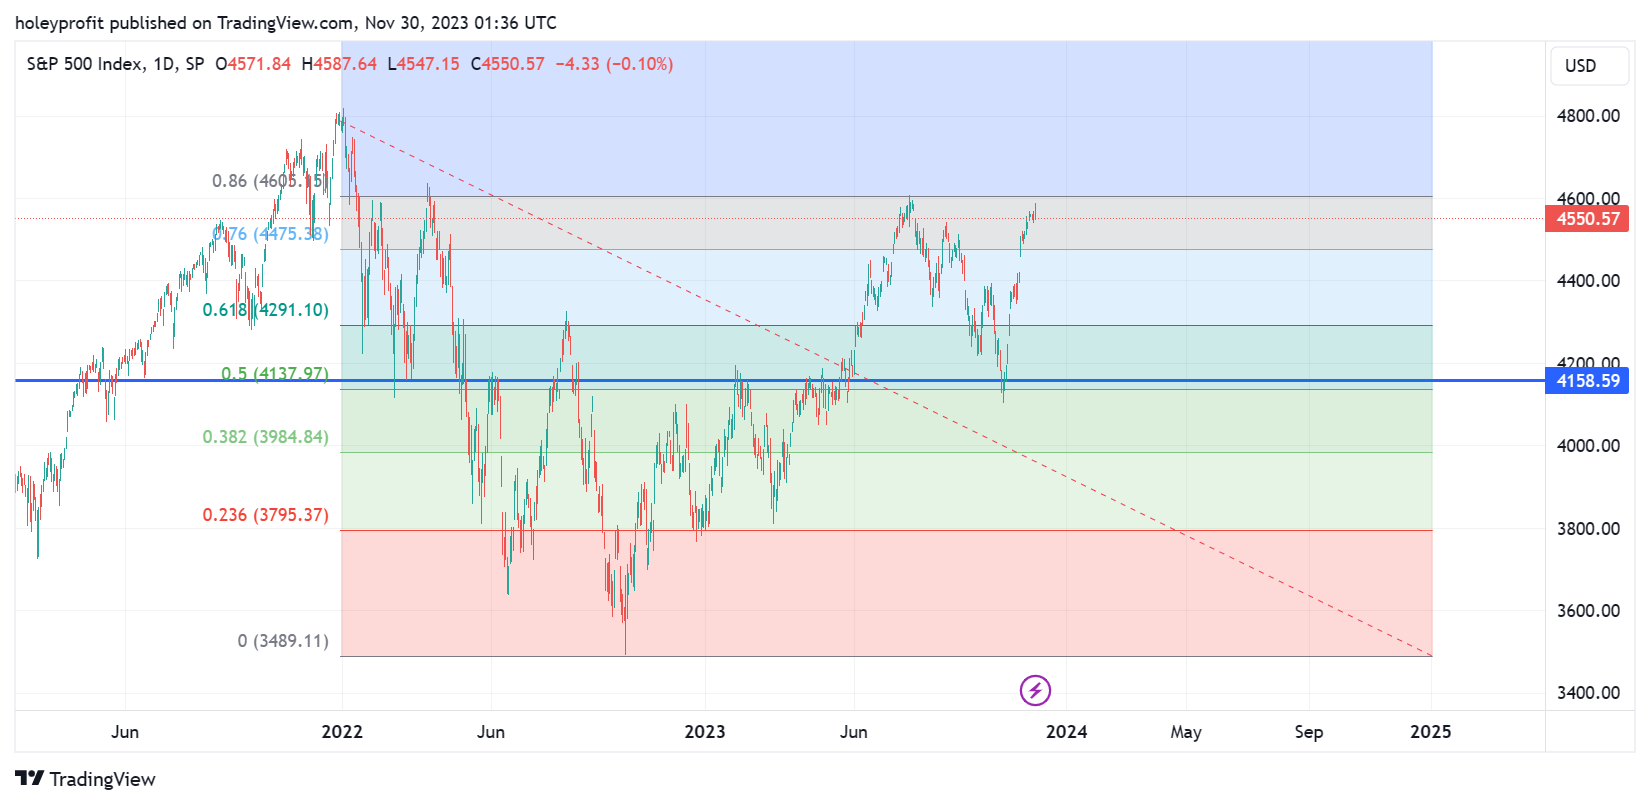
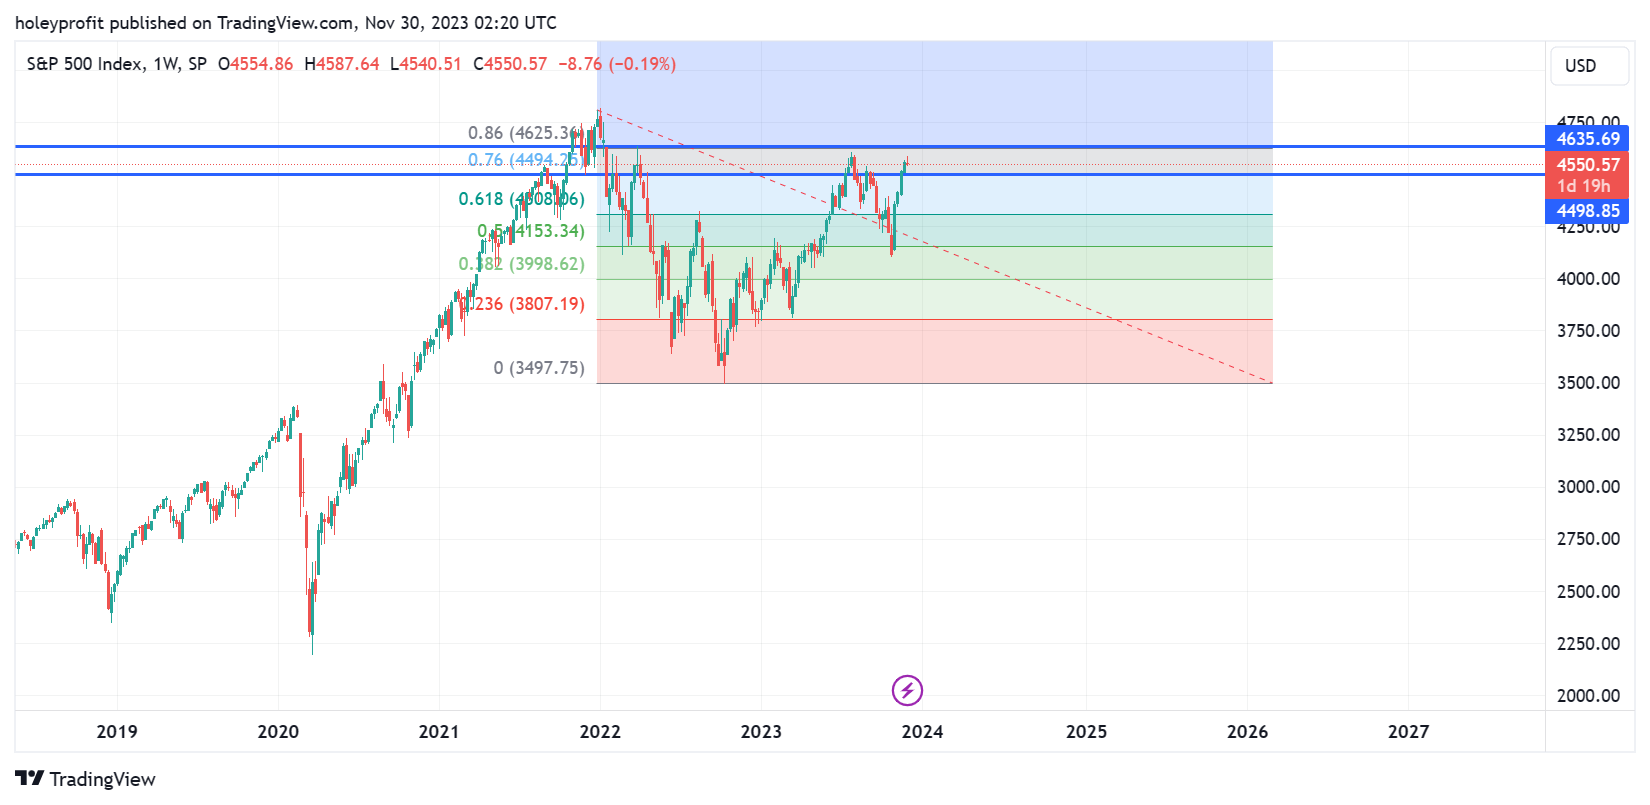
At this point we can fib high to low of the 2022 drop and map out plans for a big spike move. If we stop around 1.61 this has a lot of potential to be an Elliot wave 5 top. If we run through to 2.20 it’s far more likely we’ve made a legit breakout and while a short is more likely in the near term, this is net bullish.
We can further support the bull case with the low being on the 50 fib which we established while at the highs was a possible turning point if we pulled back from 76/86 but went on to make a new high.
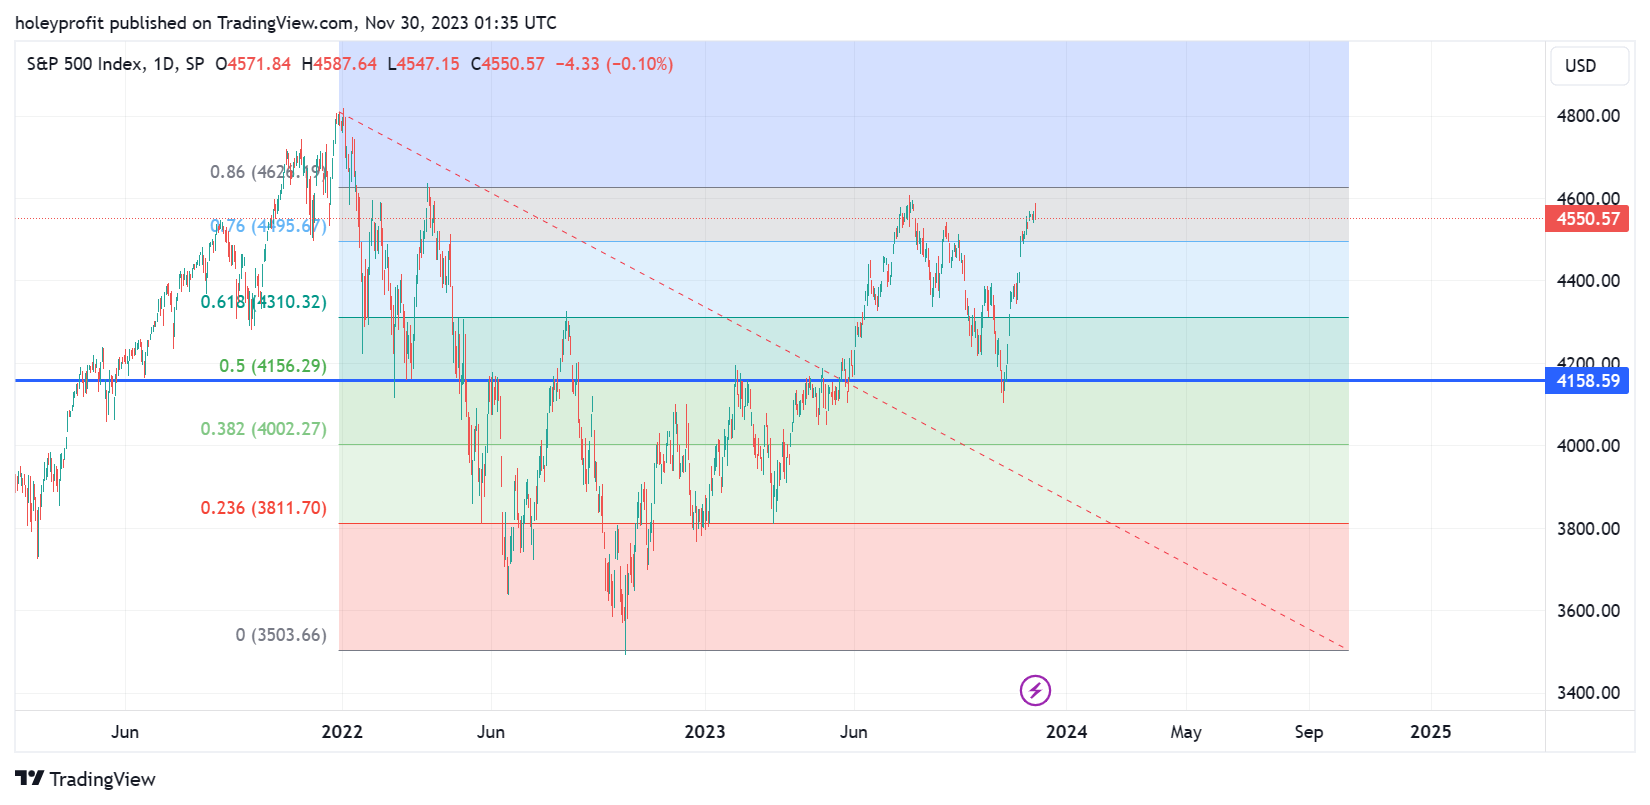
And using our basic rules of 76 reversal - 86 breakout, this is a clear breakout.
There’s not a bull flag. The fact so many people are clambering over themselves to point out the bull flag which breaks all the bull flag rules really makes my contrarian senses tingle.
Here’s the the bull flag rules.

The “Flag” is not three times the “Pole”. It dropped over 50%.
Rally before the flag formation didn’t make a new high. Here’s how the pattern is meant to look.
No matter how you try, you can not make this anything close to a triangle.
Here’s what one of those looks like.

And as for the “No bearish divergence” - there’s bearish divergence.
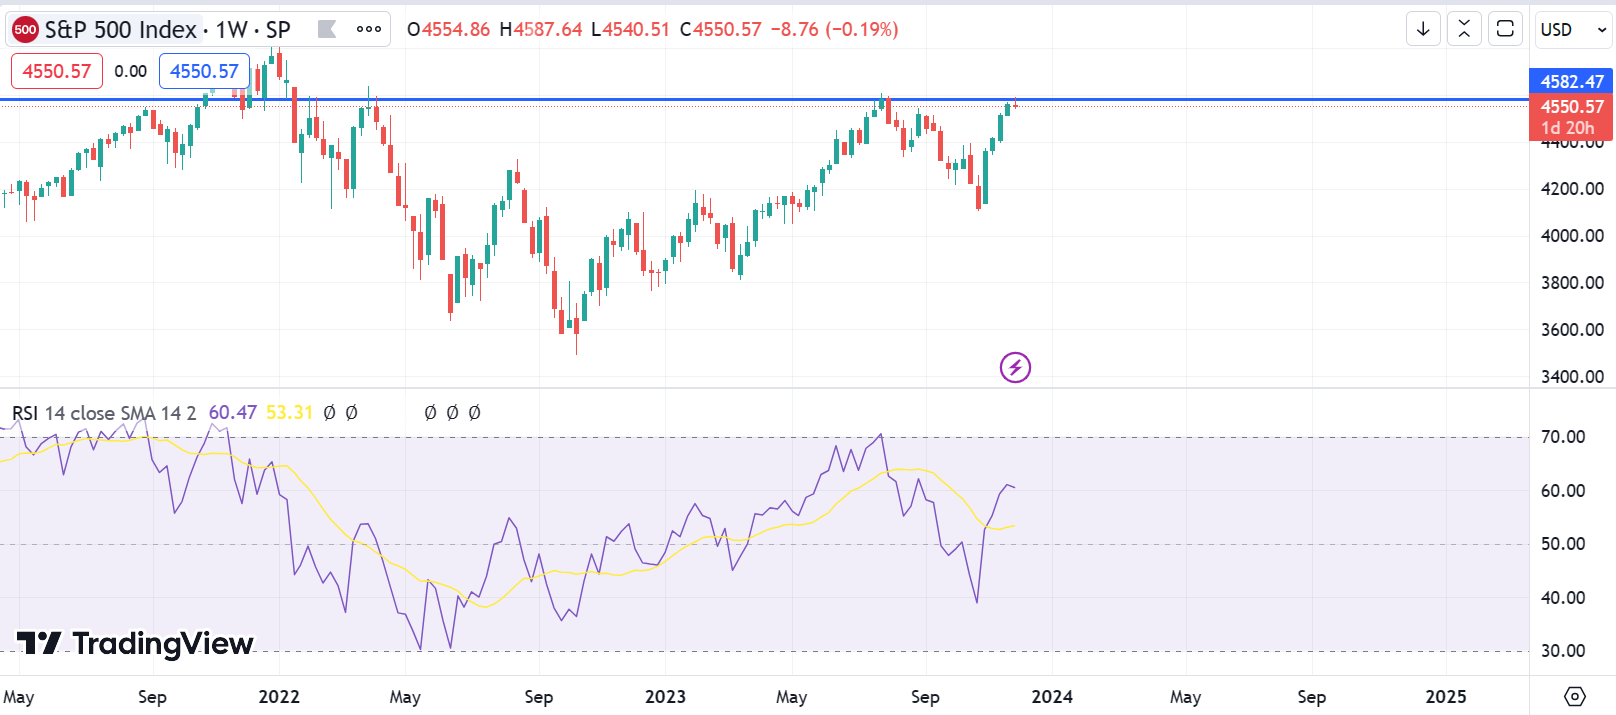
Divergence is when an indicator does not match up with price. SPX has traded back to the previous high but the RSI lags it trading around a 76 retracement.
A bull flag has 4 rules. Not a single one of them is satisfied in this move. To call this a bull flag is to be ignorant of the bull flag rules.
Nasdaq
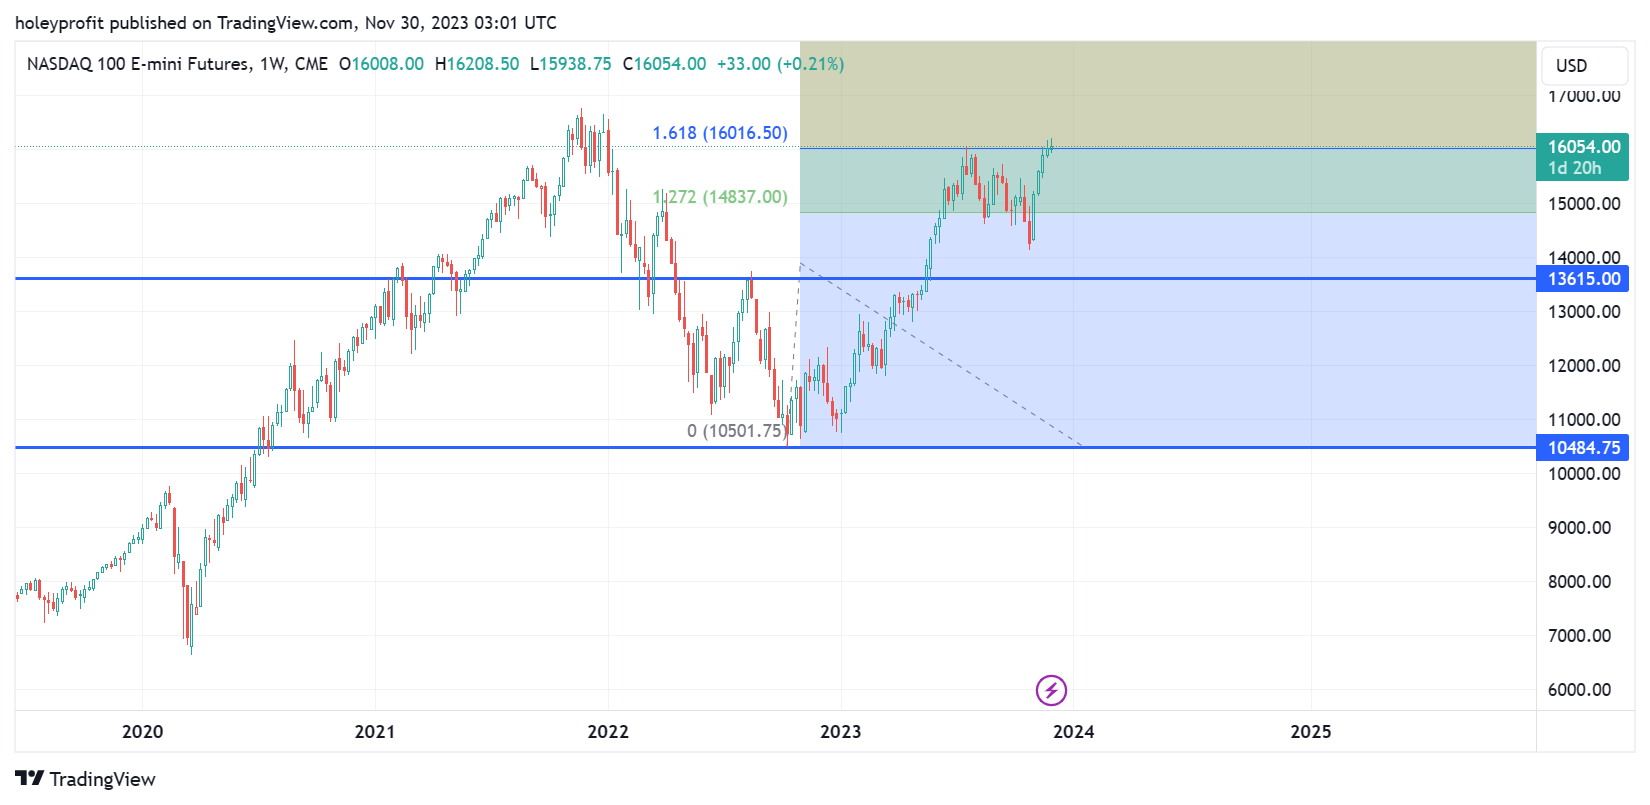
For upside levels on Nasdaq we can fib the last big pullback. We’ve topped on 3.20. A follow through move would be expected to go to 4.23.
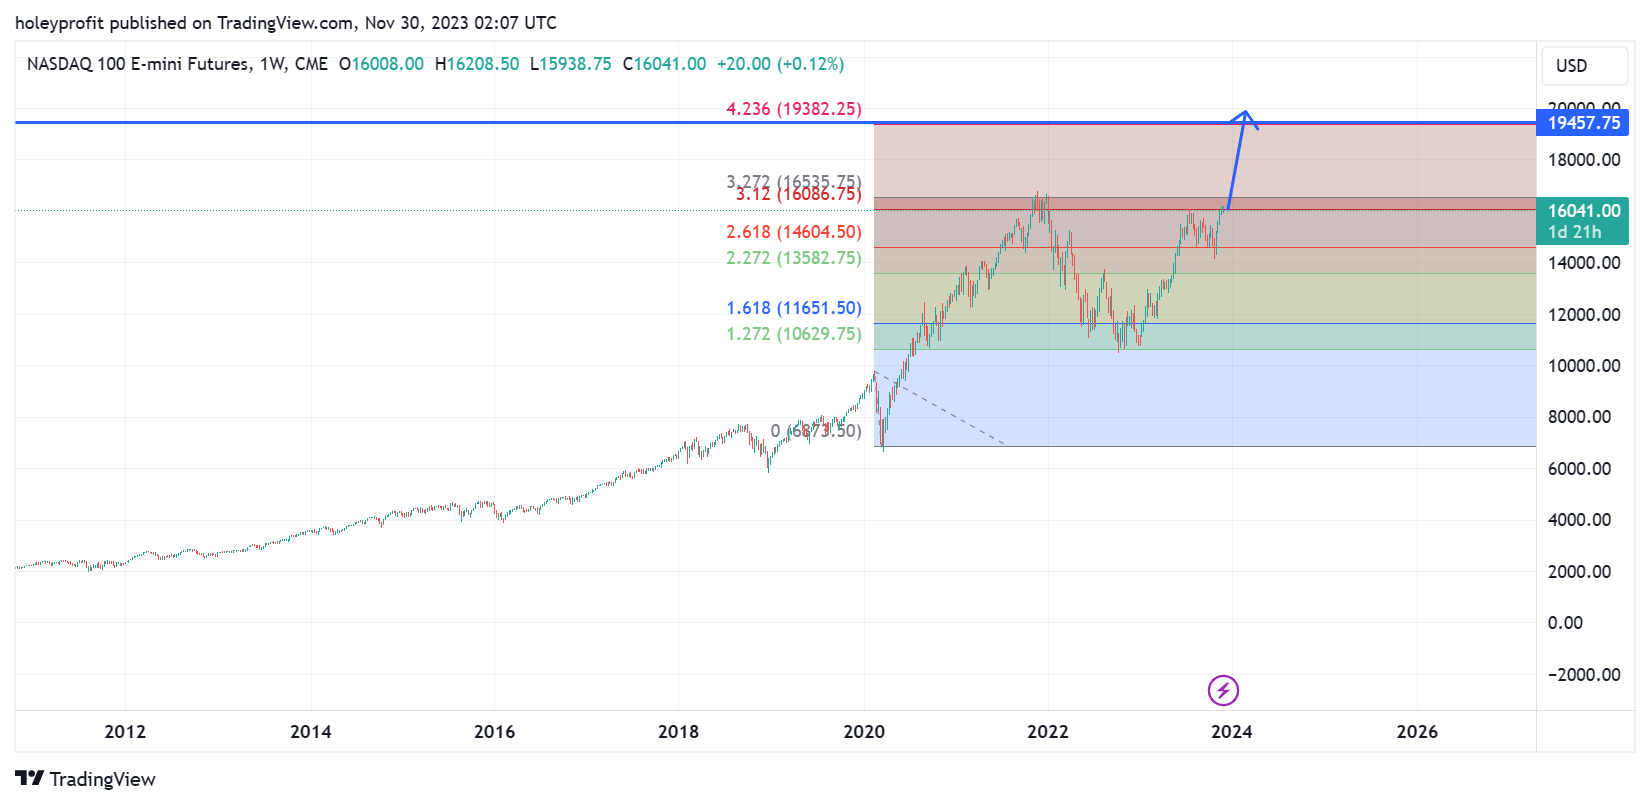
We can fib the W and do the same thing as we did with SPX, and this also would suggest a similar price range if we’re not making a high here.
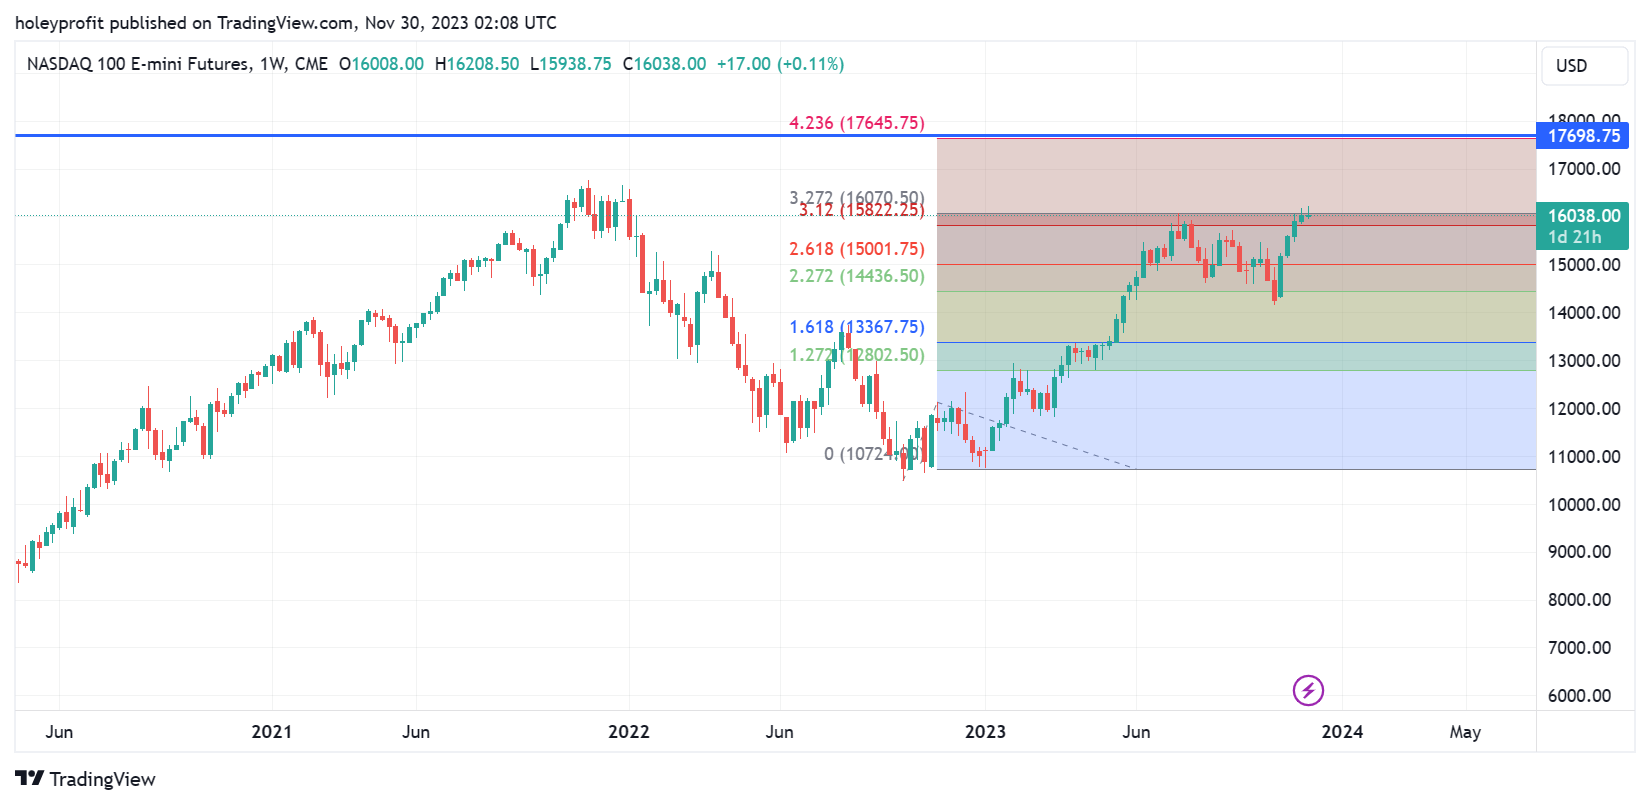
We have a break of 86.
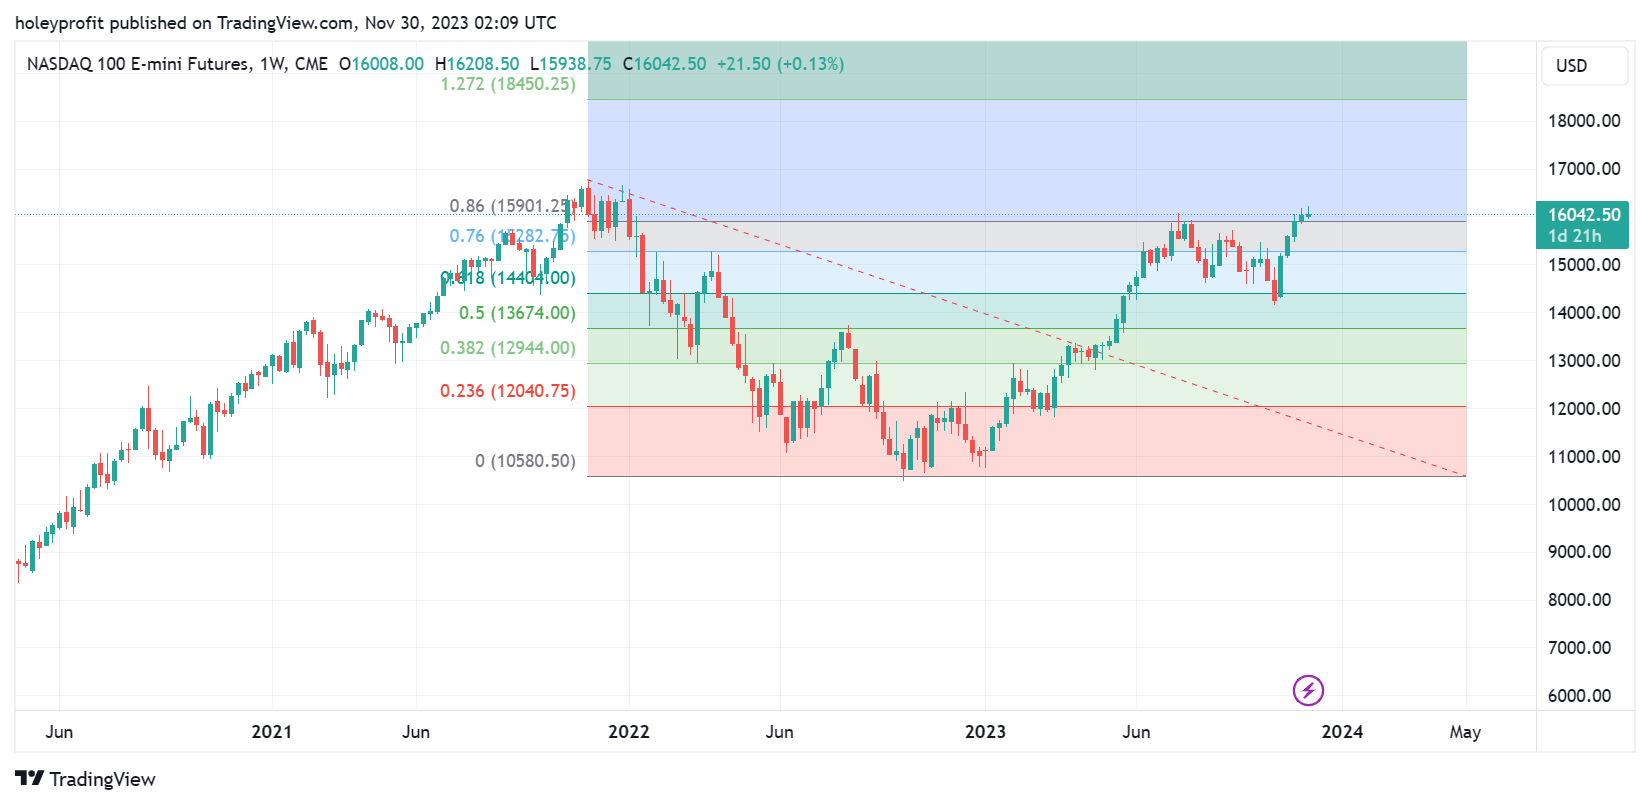
A break of 86 often implies 1.27 and this also agrees with the same general target zone.
DJI
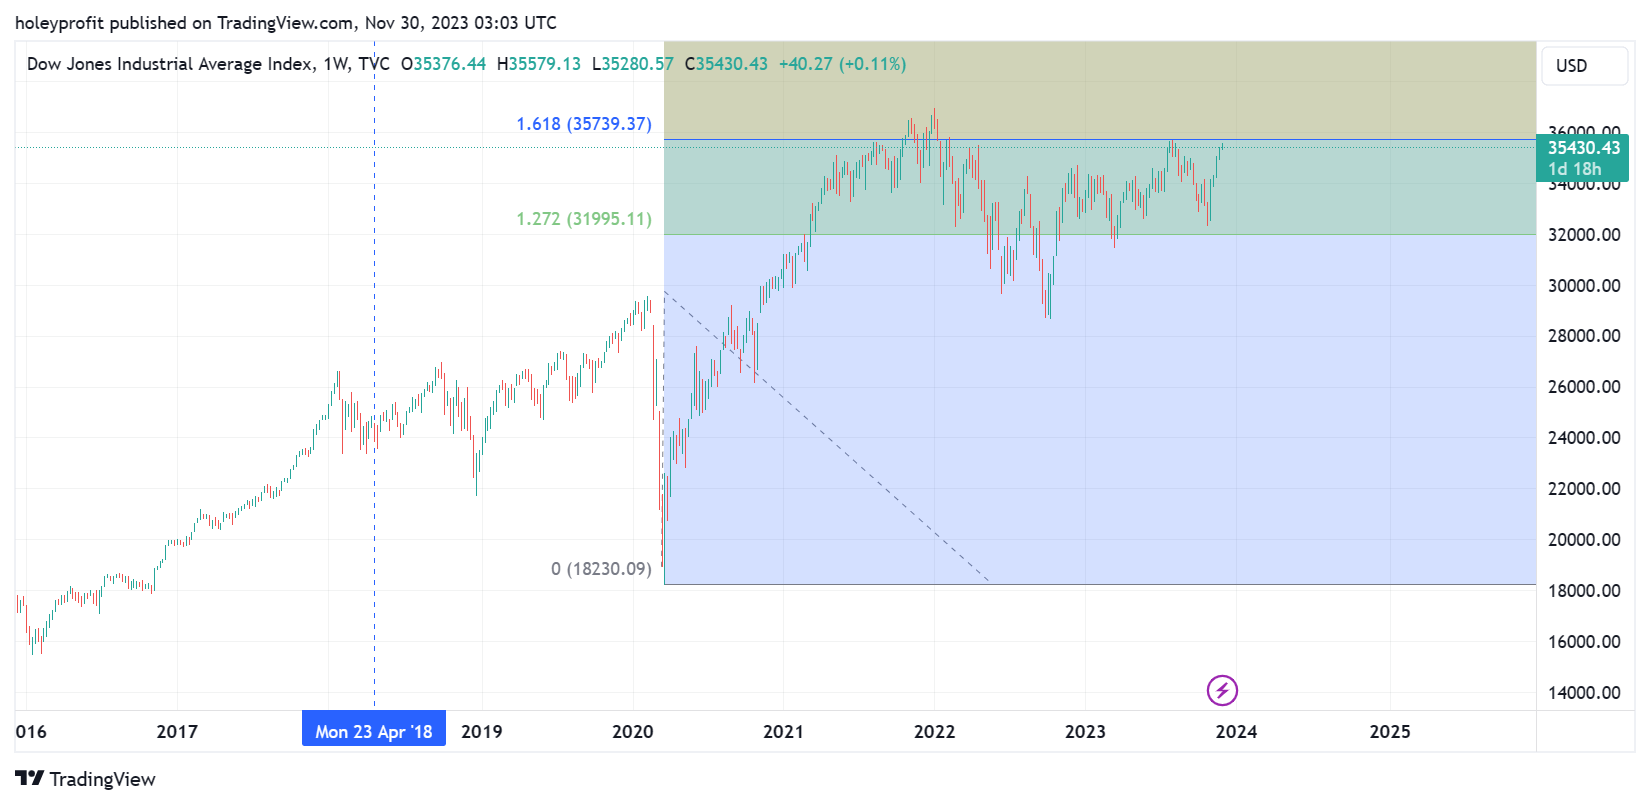
DJI upside levels we can generate using the last big pullback. If 161 fails as resis target is 220 - 261.
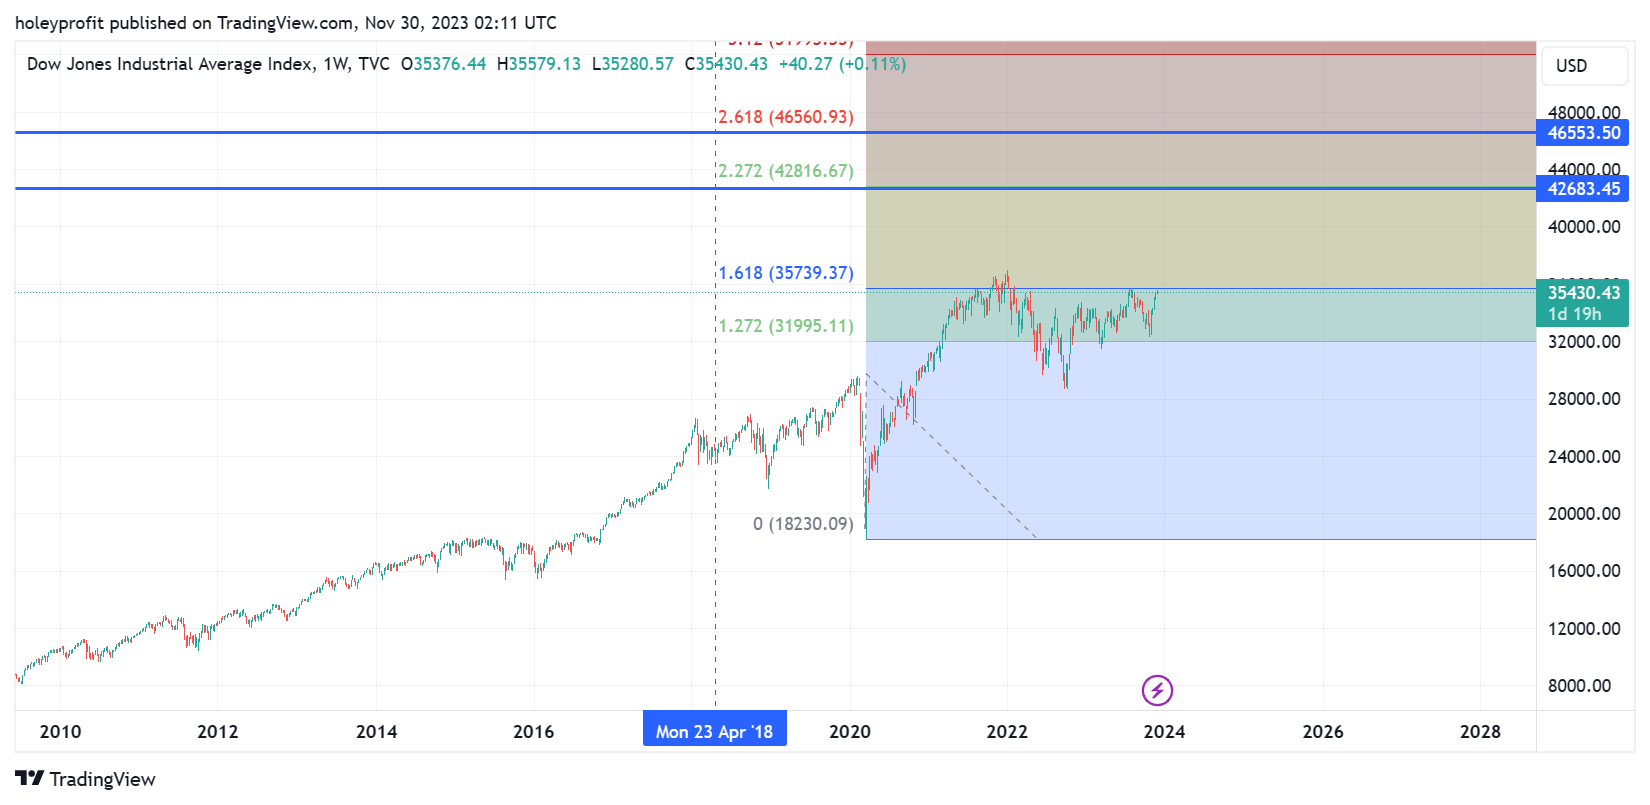
We can use the same retracement break theory to support a bull move.
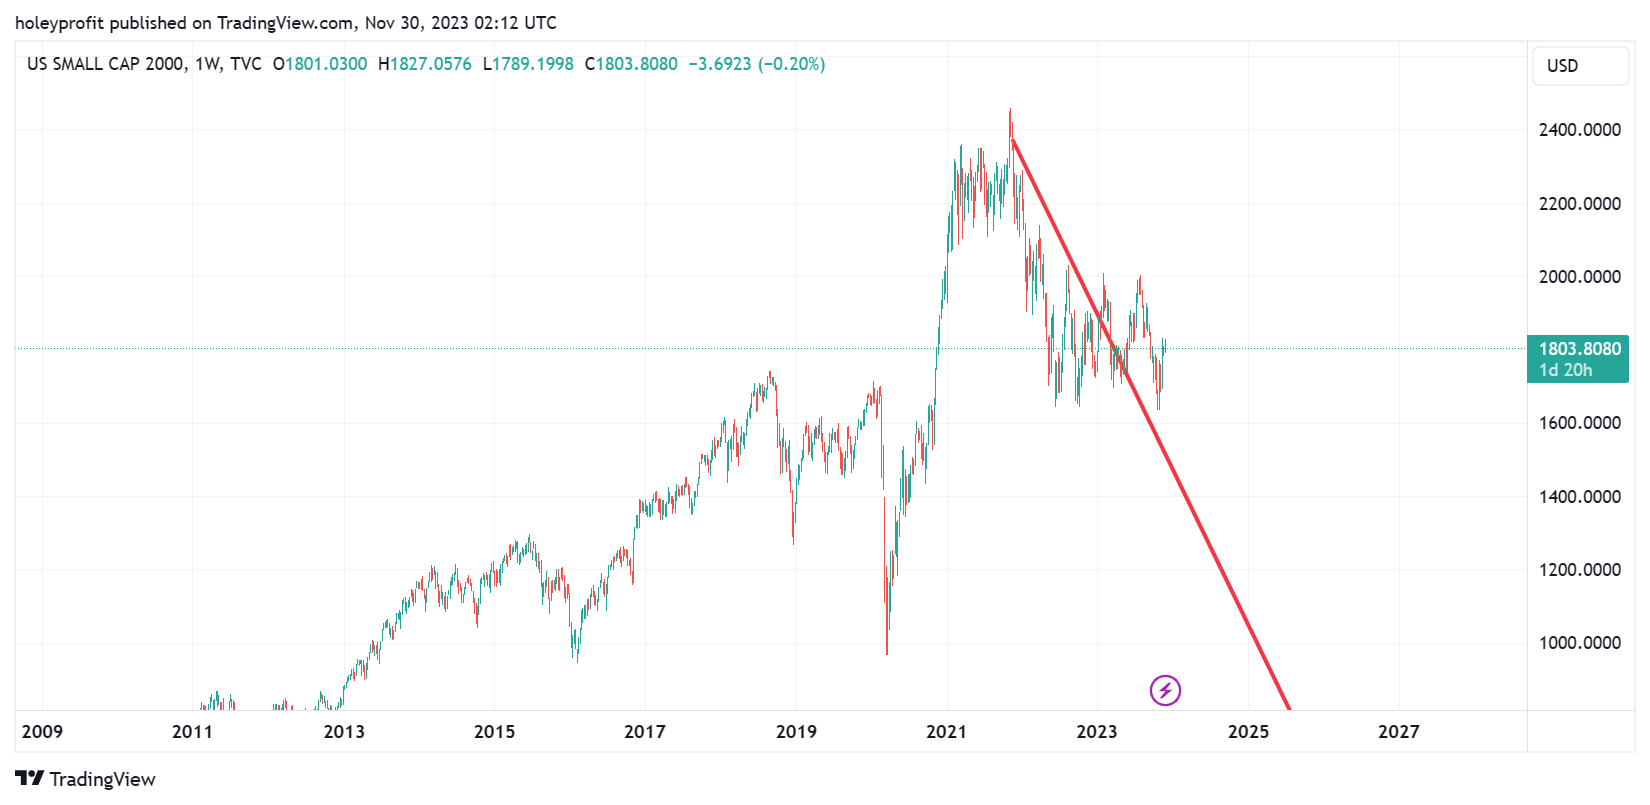
RUT
Hard to make any case for a RUT bull, really.
All I can see is a trendline break. I’m not a big fan of trendline breaks but I do know you trail stops on shorts when they happen.
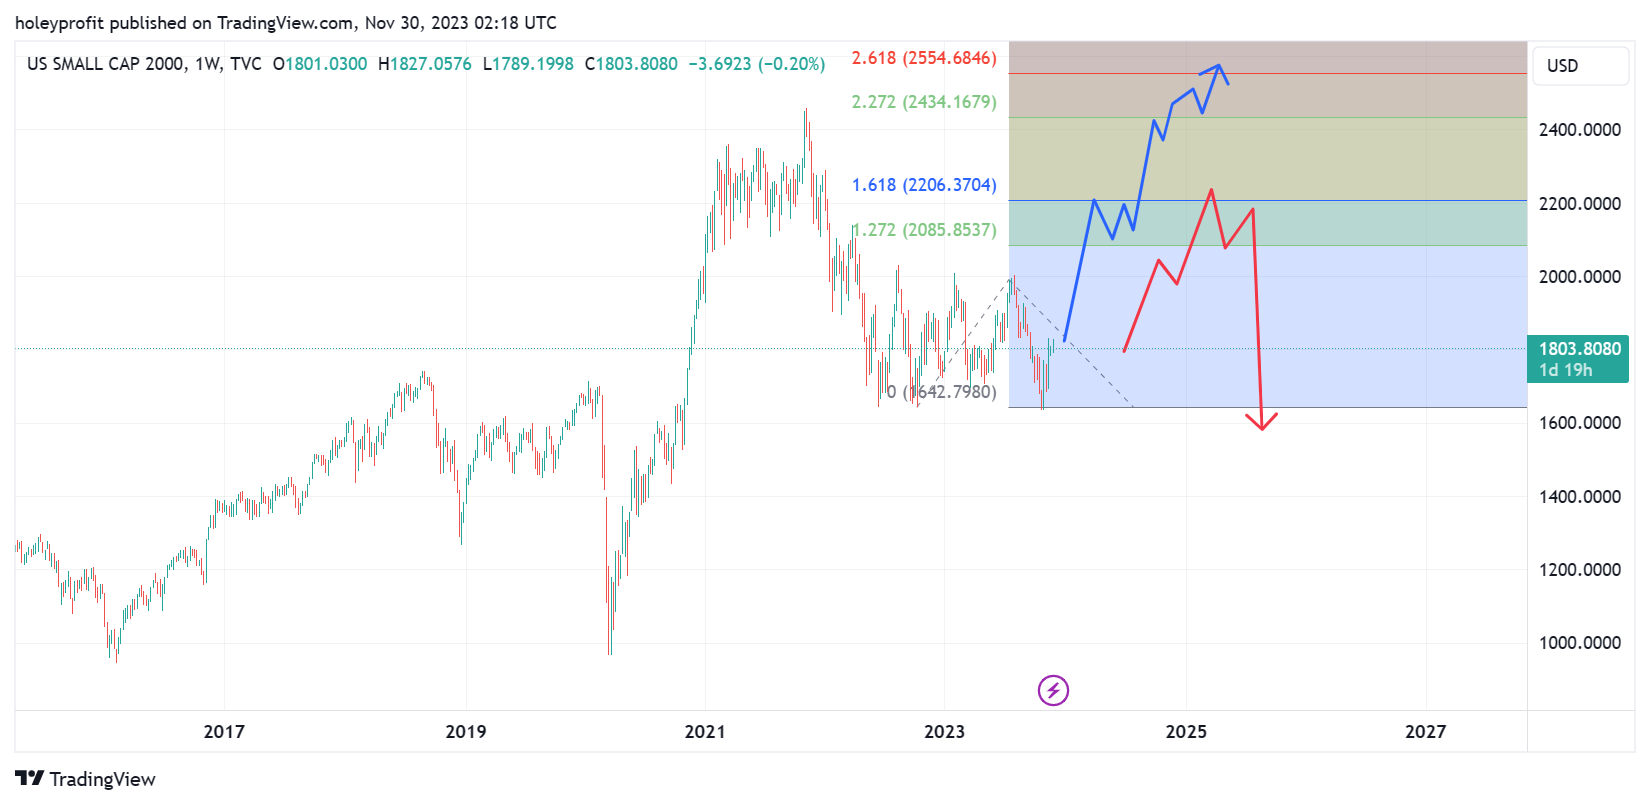
The only bullish thing I can really think of regarding RUT is this is somewhat similar to how BTC looked at the low after the first 50% crash in 2021.
If we did rally, these would be our main areas of interest.
Bear Case
The bull case is technically strong as per the simple rules I tend to use. However, during the small chart moves we’ve been routinely seeing these levels ever so slightly gamed. Reversals have some off 86s after faking from 76s. Head fakes have been just a little more aggressive than usual.
When we bring these adjustments into play, we have to determine our reversal zone as this.
And this is why I absolutely can not bring myself to be bullish here. Don’t get me wrong, there' are viable bull strategies you can use here. Buy stops over the high, tight stop losses under structure. Aim for 1:2 RR and then apply trailing stops. Going to lose a few trades if it turns but this would usually about break even so long as one or two hit. This type of stuff is really hard to give newsletter style updates on, though.
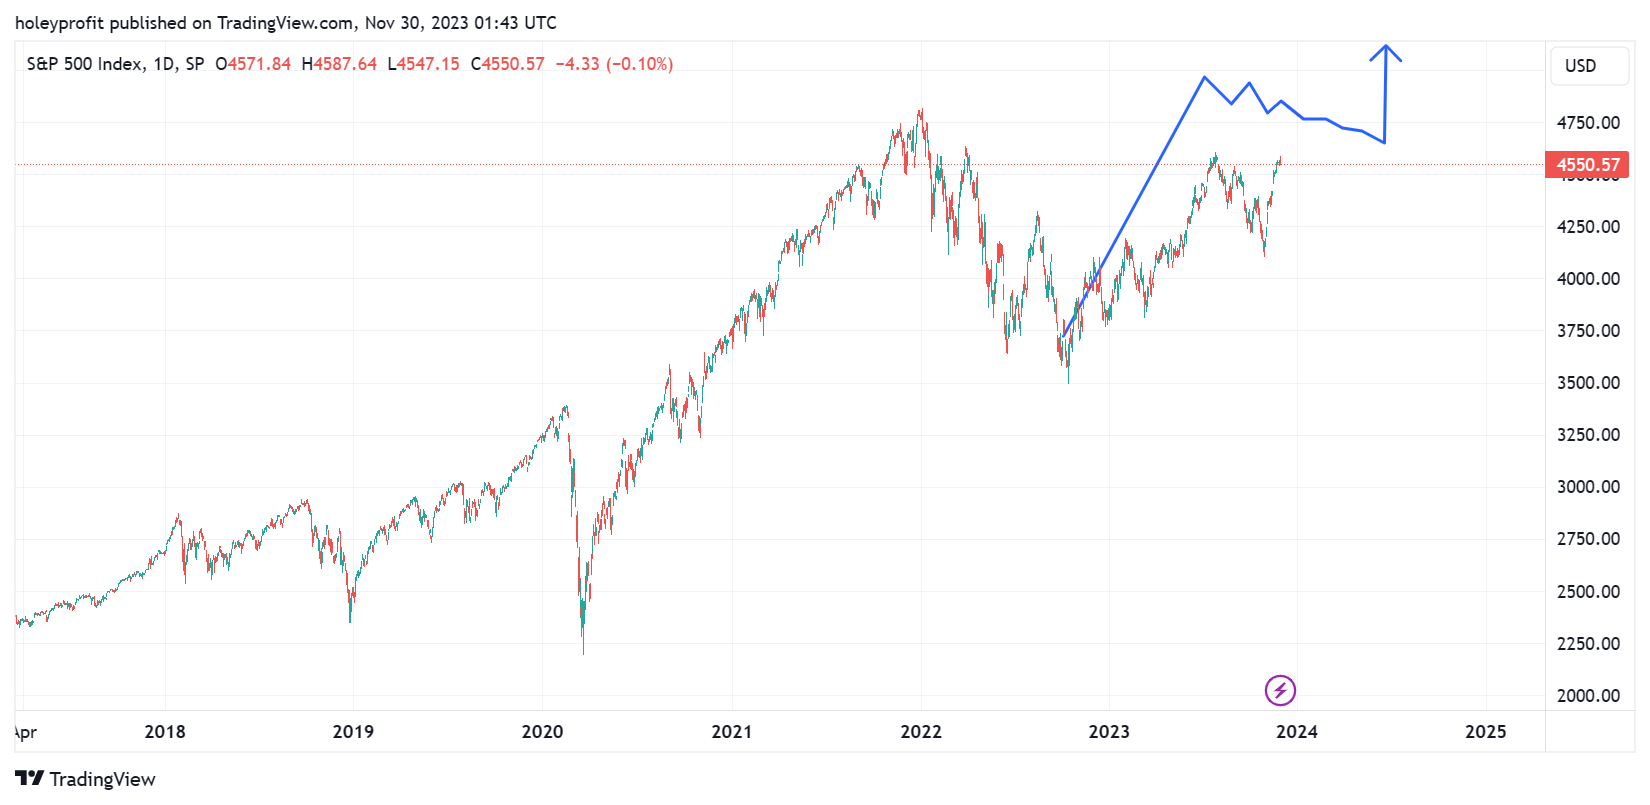
This big monthly candle looks really bullish but I know I should expect to see the formation of a bullish butterfly into a break.
So this kind of thing can easily fit inside of the context of a forming bear move.
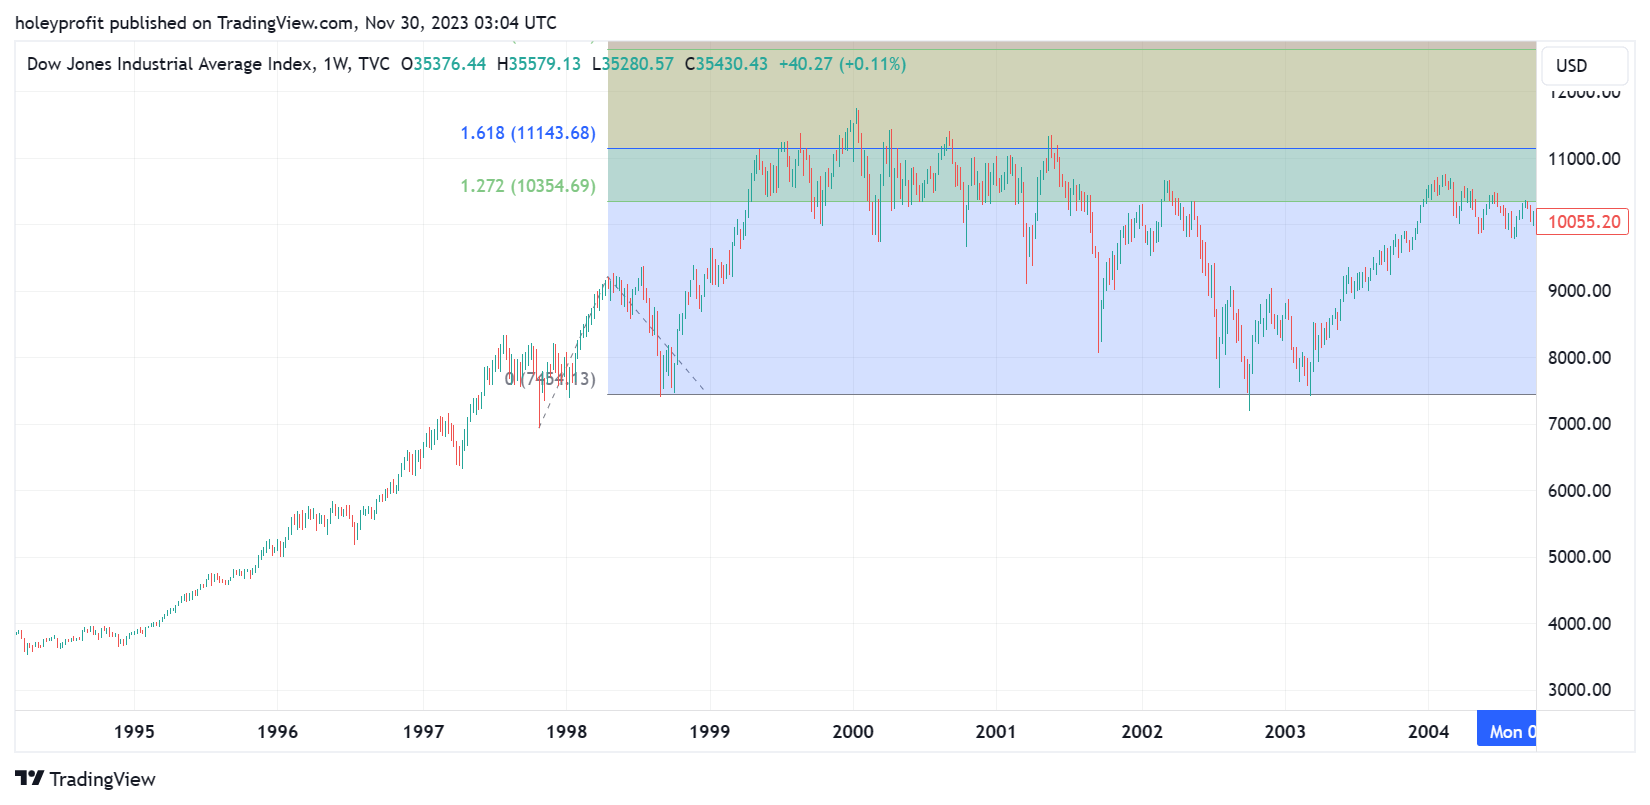
When we smooth things out by jumping to a 6 month chart it looks every inch the classic bull trap. Again, potentially forming a bullish butterfly setup.
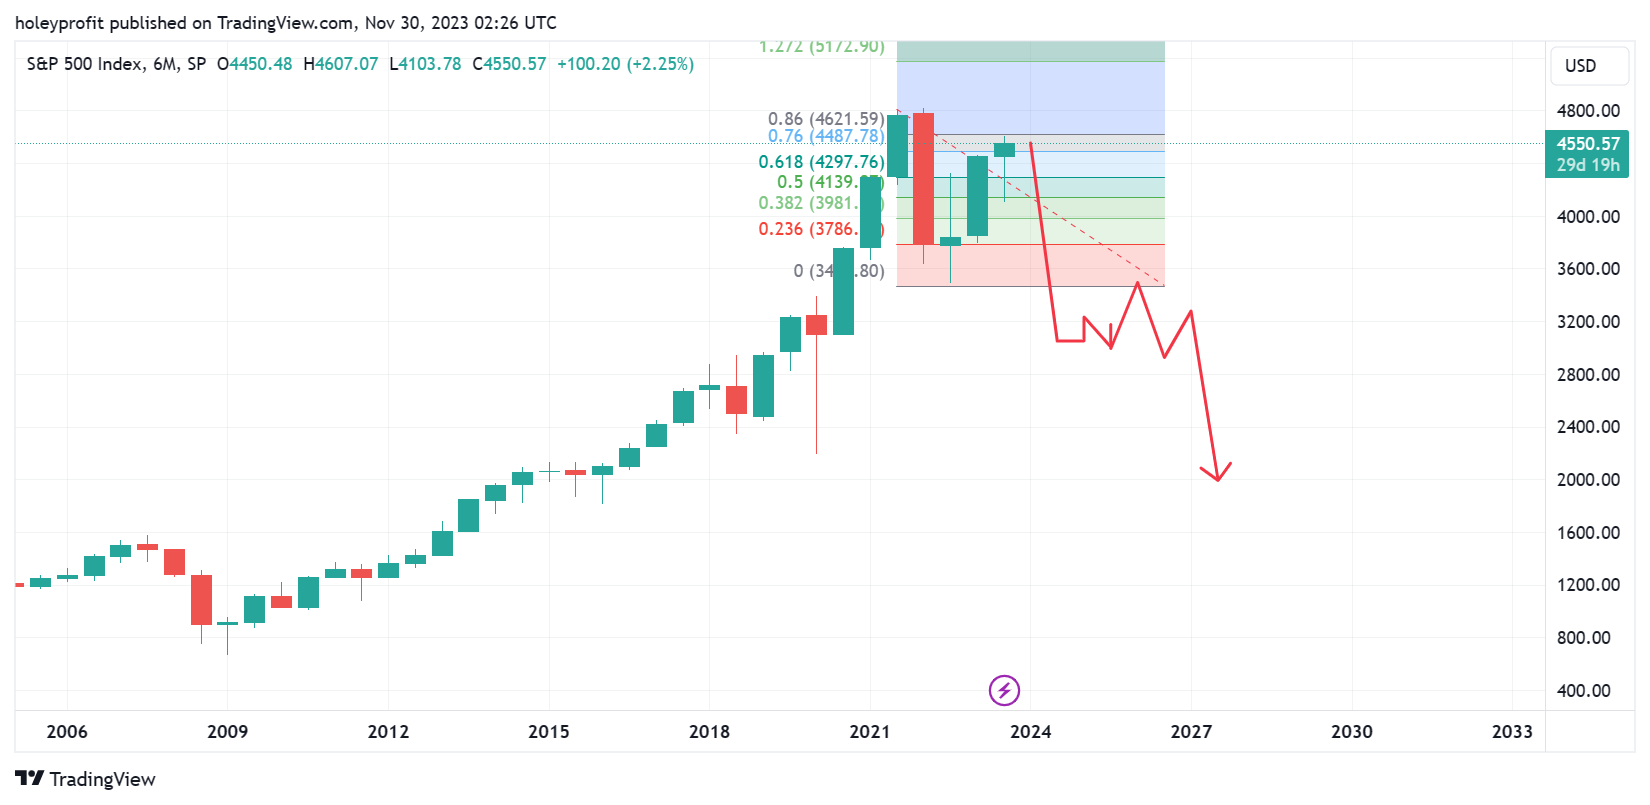
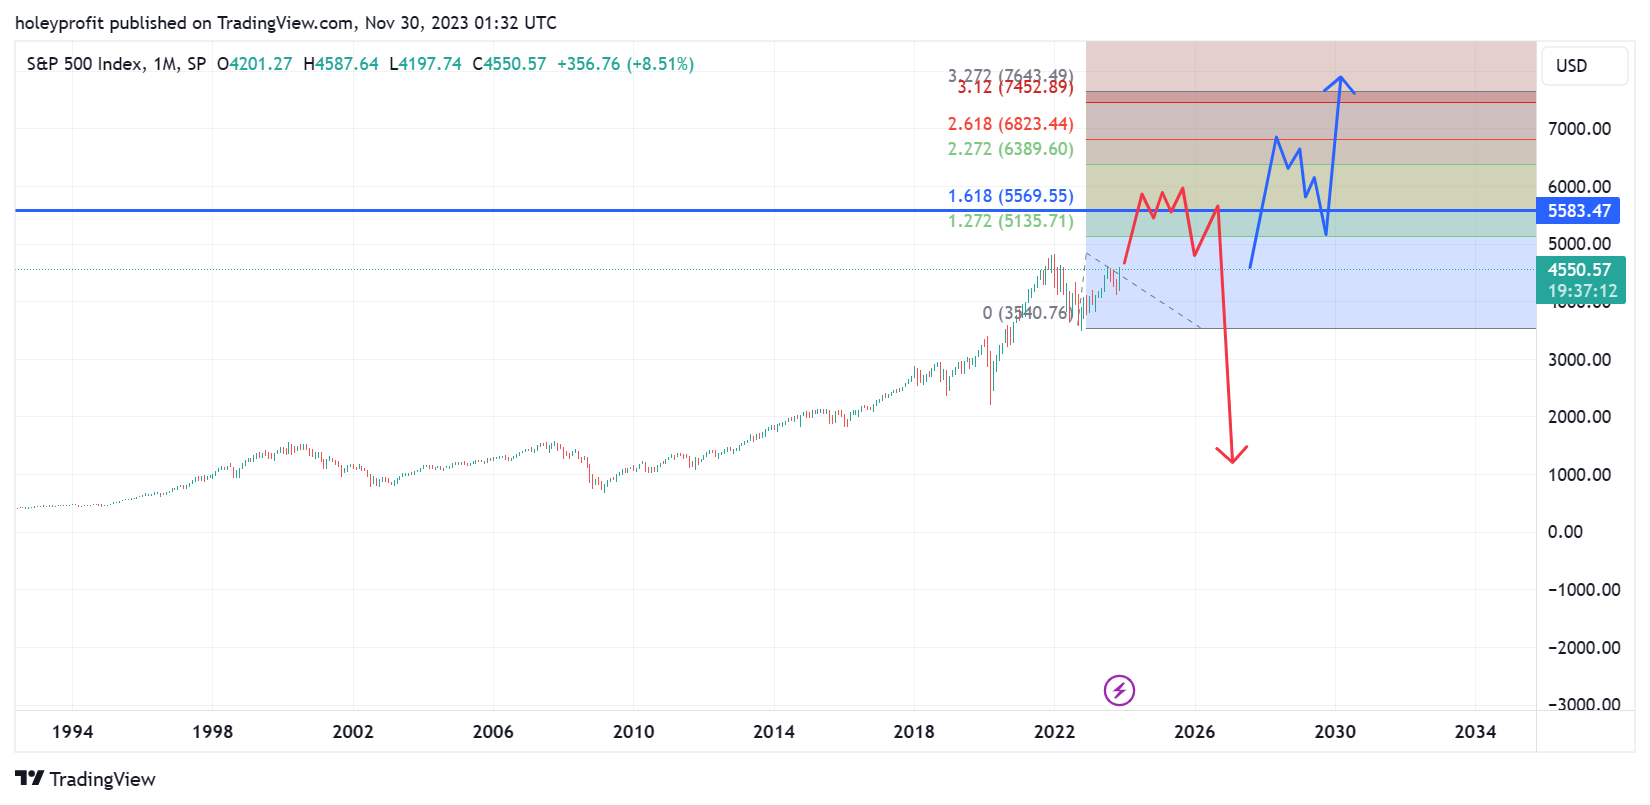
I know it looks highly unlikely at this point, but if we happened to see a mega sell off in December to close the year our SPX yearly chart would look exactly like the 6 month chart of the DJI heading into the depression.

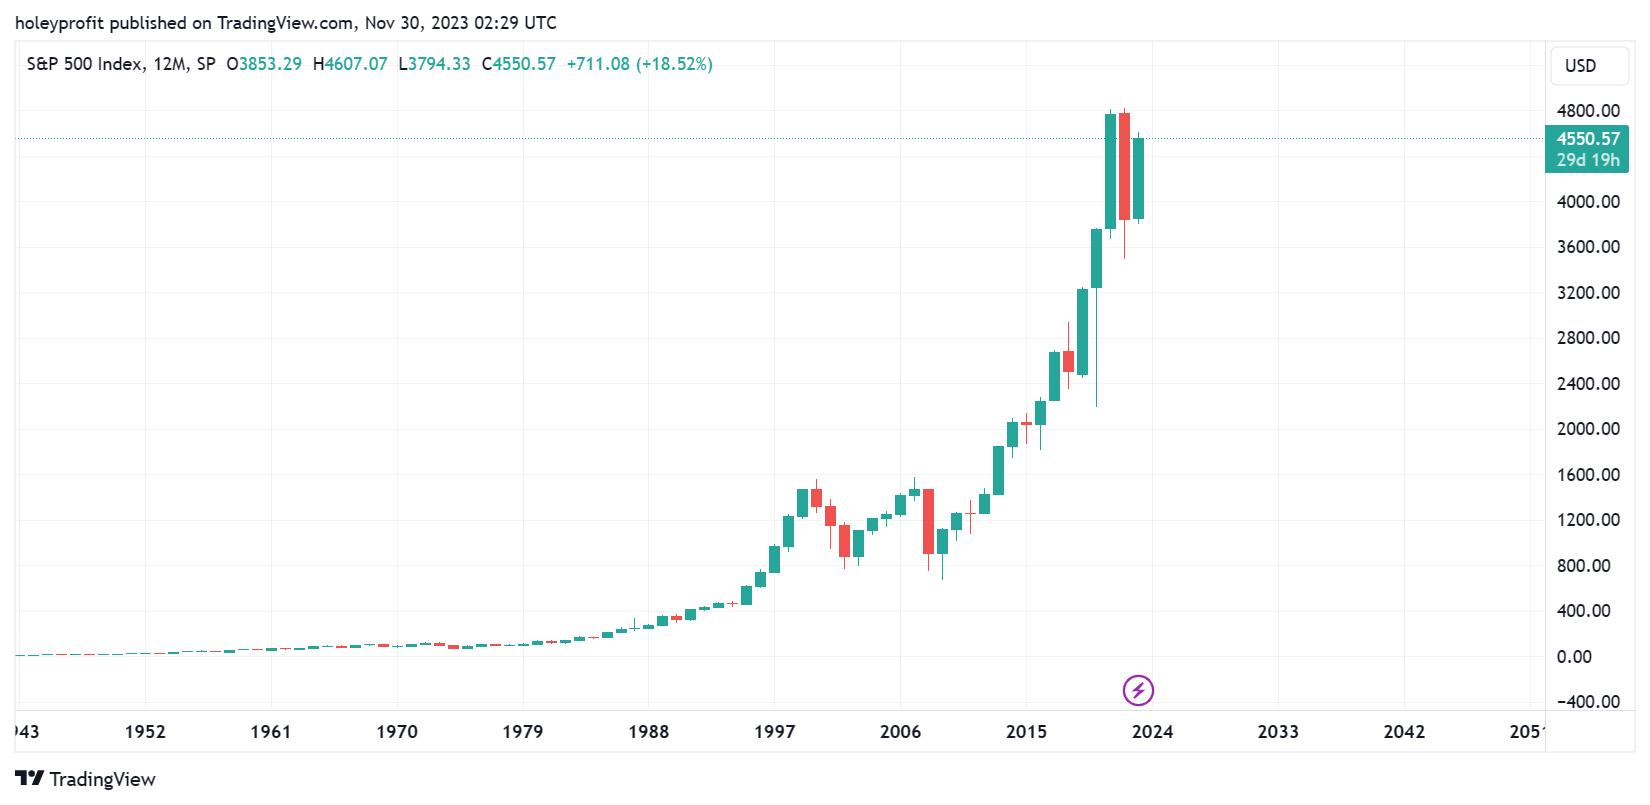
And while that looks highly improbable at this point, it’s entirely viable inside of the Elliot model.
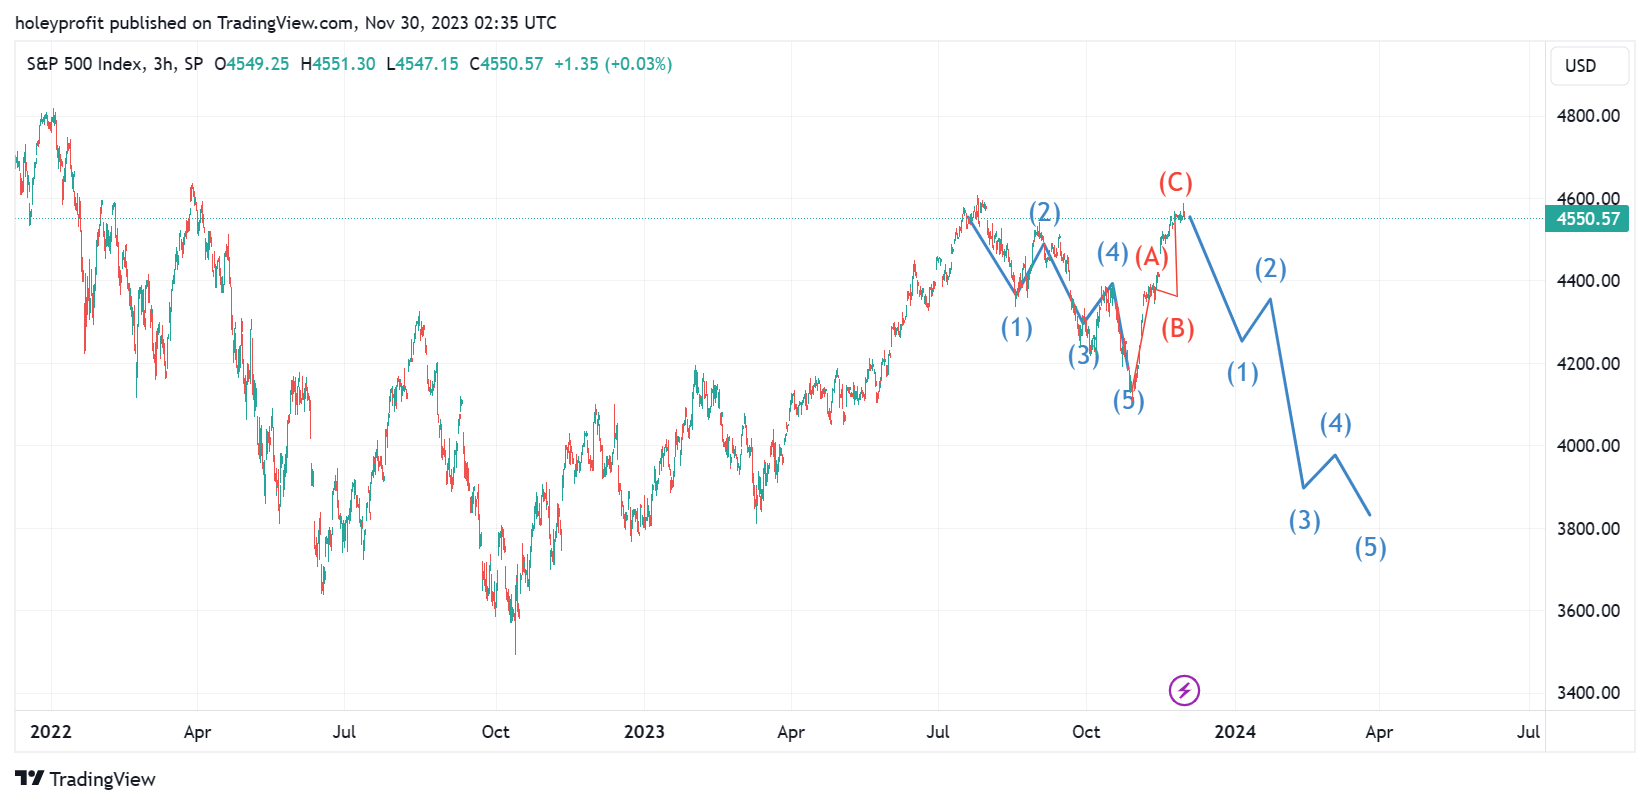
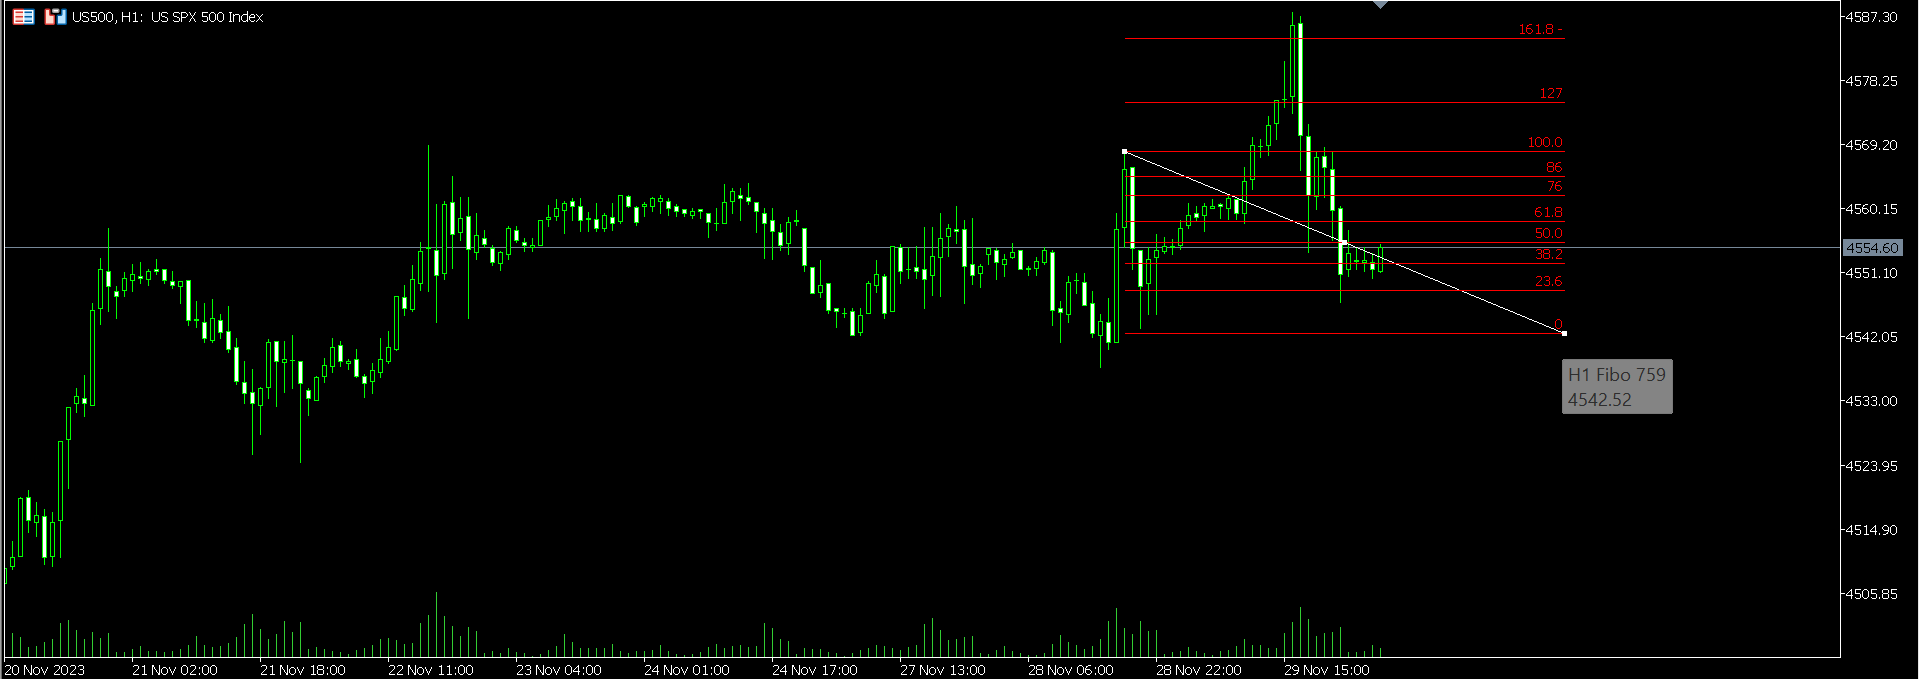
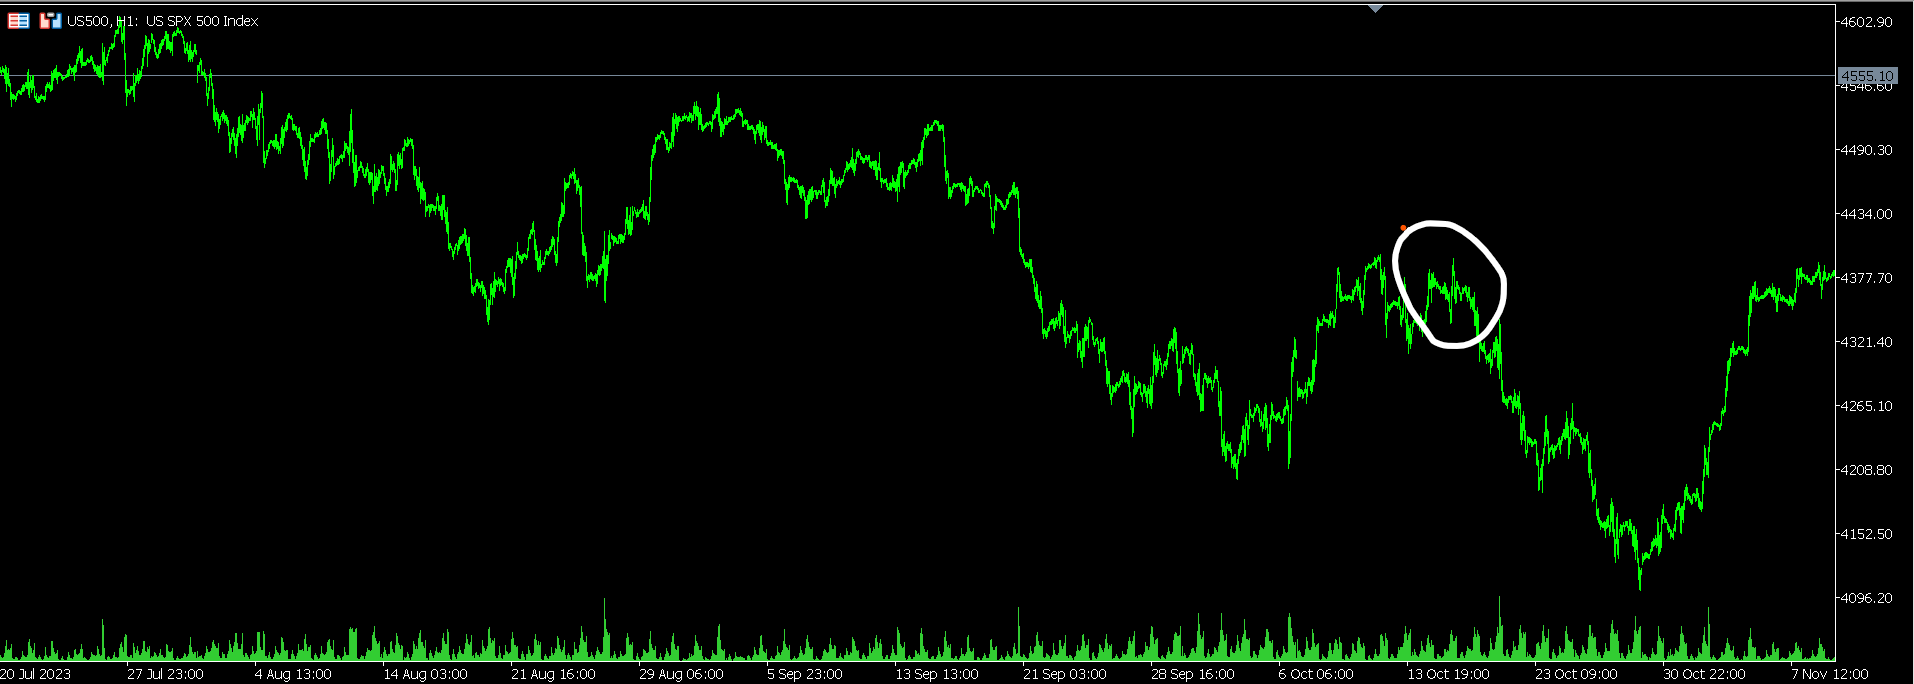
Today painted a really bearish candle. Gapping up and giving up all gains to close at the low.
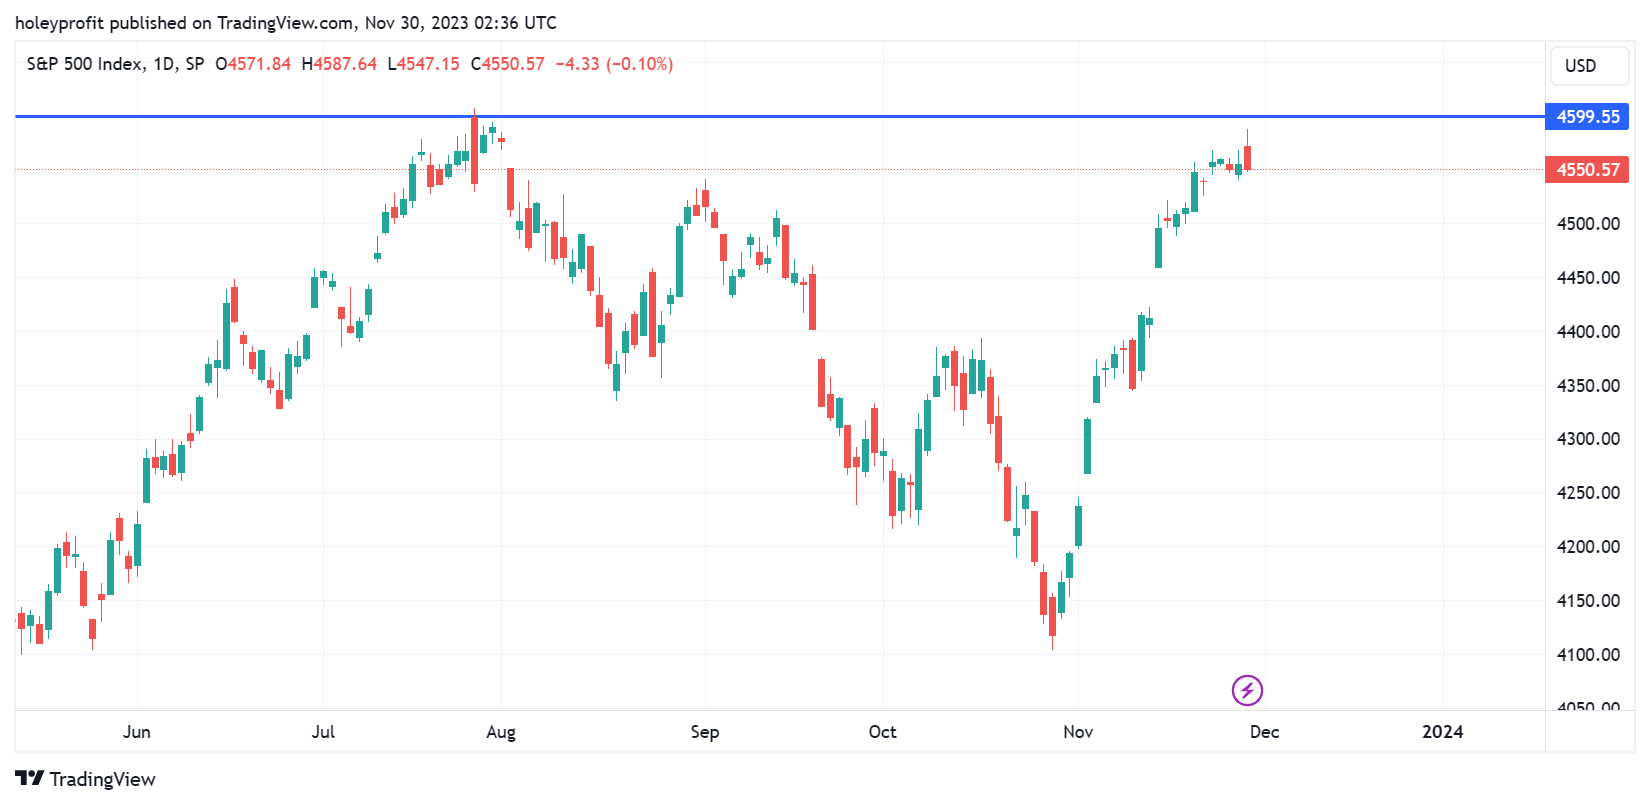
I’ve said recently when we range we should look for some final spike out and the rejection of that being the start of the move. The clear wick rejection is much more obvious using all trading hours.

With the high being made via a harmonic.
Nasdaq
This looks like an ABC correction in Nasdaq.
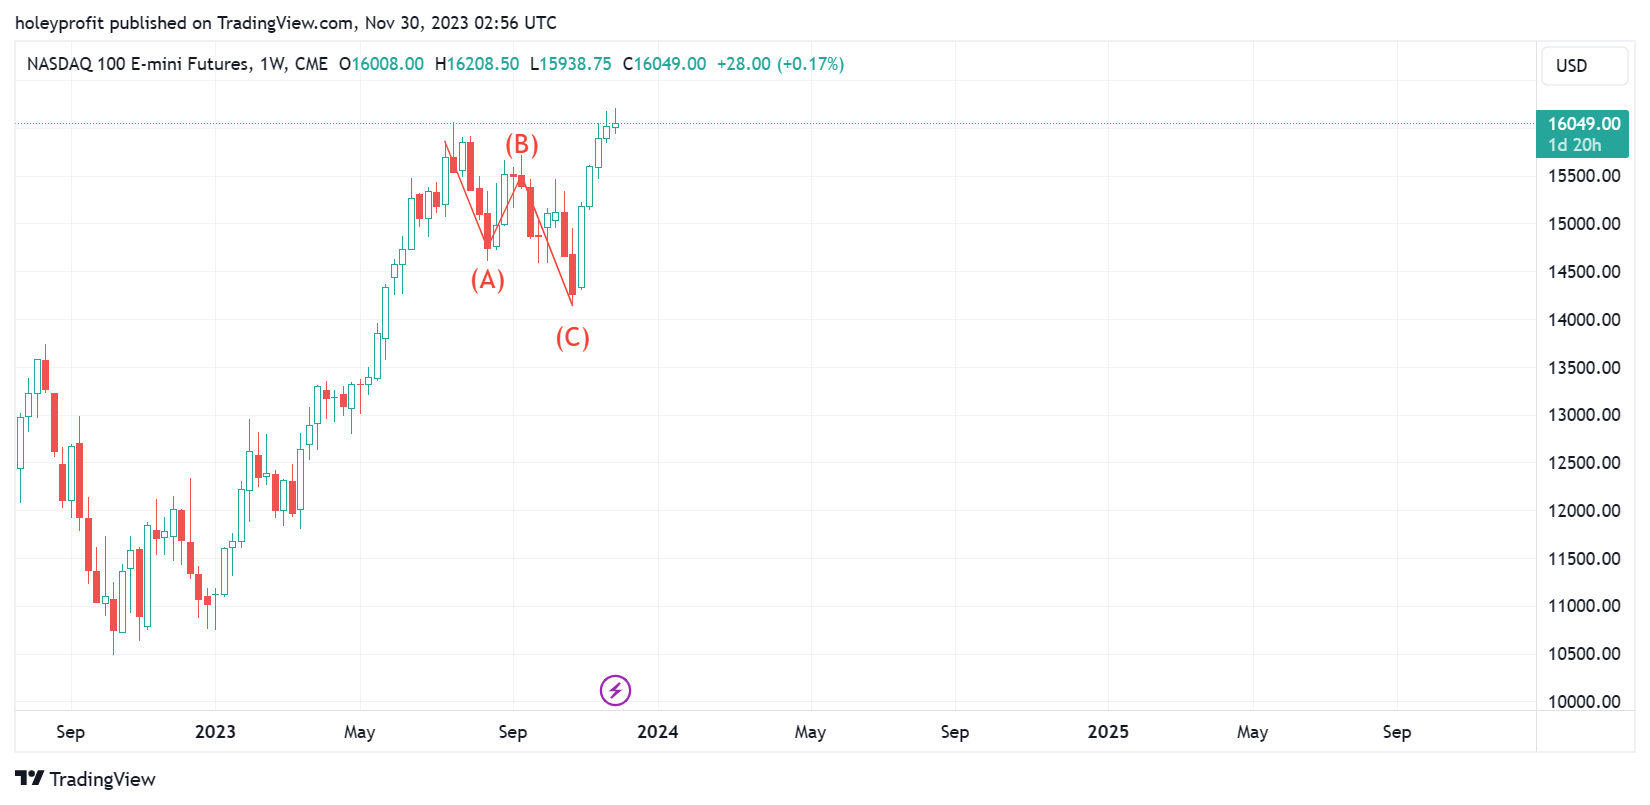
But this isn’t actually as positive a sign as it appears on the face of it. For an ABC to be due, we’d usually have broken the high of 2022.
As things stand, this might be 5 waves up and no new high. A failed fifth - which is a rare pattern but it’s as bearish as things can get.
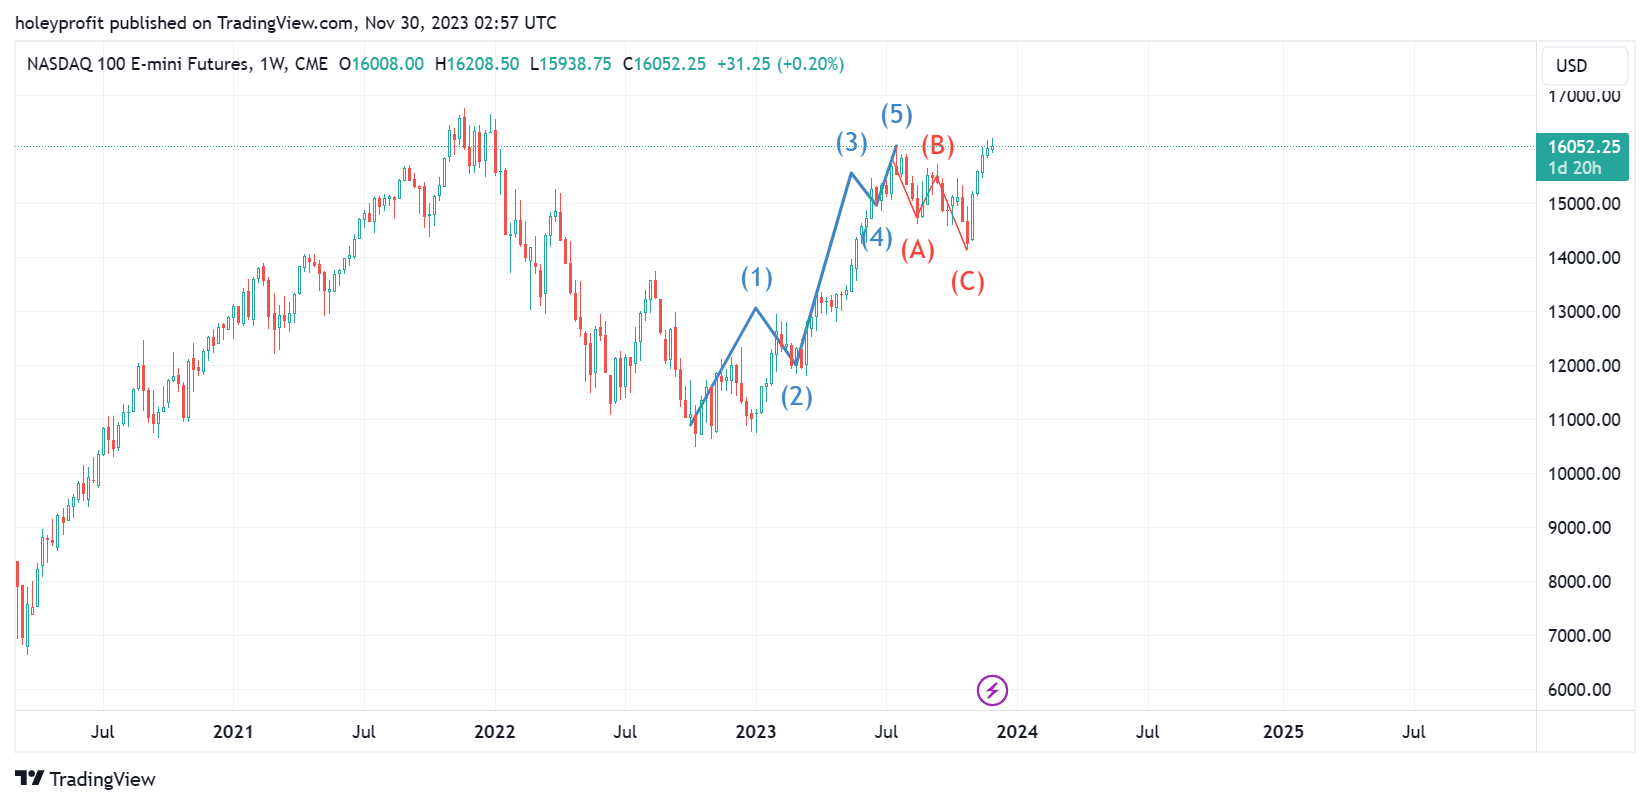
A failed fifth is evidenced by a really strong rejection with few pullbacks.
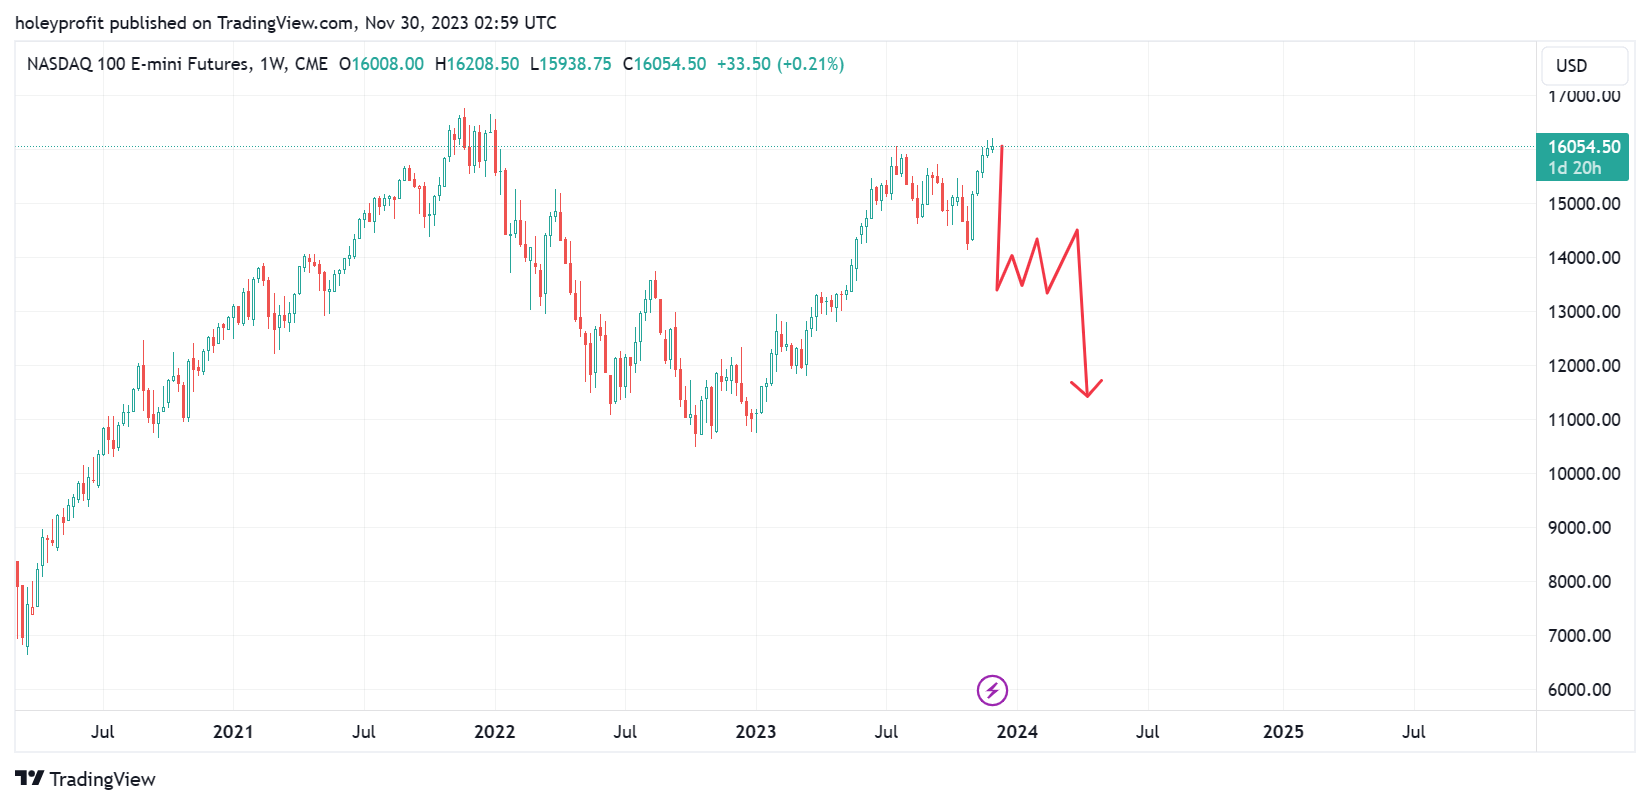
Here’s the last instance of this style of pattern producing a bear move I can think of.
And this move was typical of what we expect to see in this type of failure.
If we fib high to low of the final Nasdaq move before the rally we see we’re at he 1.61.
Very common level for a top.
DJI
Bear case for DJI remains very clear cut because we’re just retesting the 1.61 of March 2020.
Here’s something that looks very similar.
RUT
Bear case for the RUT is self explanatory. It’s bounced like a brick.
Instead I’ll just show you something I’ve found quite useful with trend lines. The rule is the first failure of a trend line will usually be false and the next spike will end at 1.61.
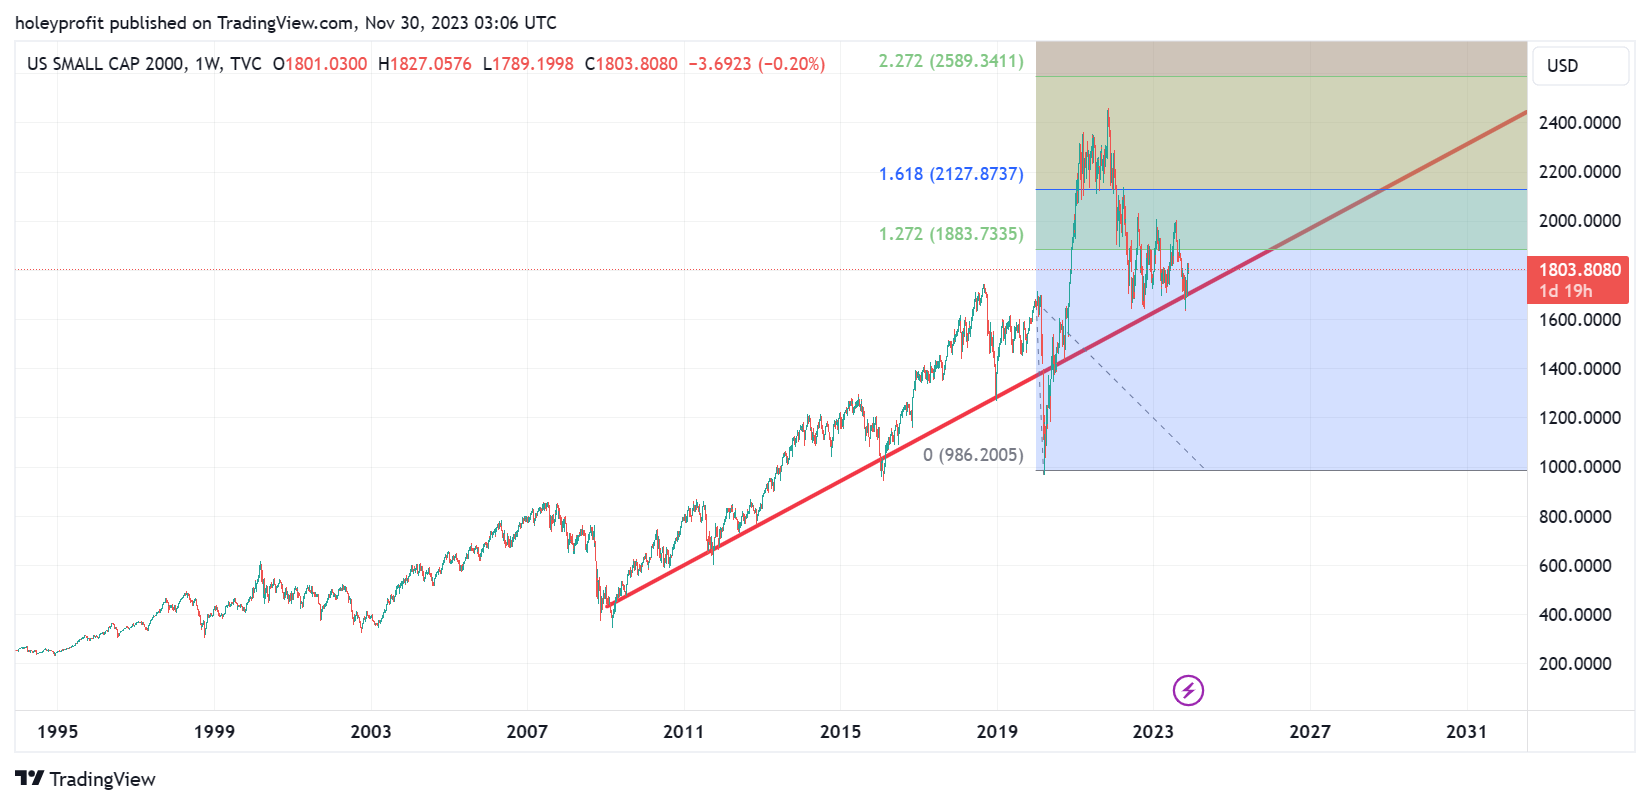
And then the real reversal comes. RUT fits these rules perfectly to date and I suspect this is a dead cat on the trend line retest.
Trading ideas related to the analysis covered here will be posted tomorrow.