Hubble Bubble. Toil and Trouble.
Implied crash swings if a "Return to normal" is being made.
Early 2021 I posted a chart showing how we could match up all the stages of a bubble topping on big SPX charts. This is a follow up forecast along with various examples of historic crashes to support/explain my analysis.
This is a more detailed look at how the bear side of this move would look if we were to see a conventional bubble pop. IF a true "Return to Normal" forms, since we'd then know the size of the RTN swing we could make inferences on the size of the bear. When there's a crash, the RTN swing always looks small in the context of the crash.
The RTN has to look small in the context of a crash because the RTN does not cover the first drop (In theory, spike outs do happen) and the first drop of a crash is never the biggest. There's a warning break but then things appear to "Return to normal". The following drop relative to the first drop/RTN is much bigger.
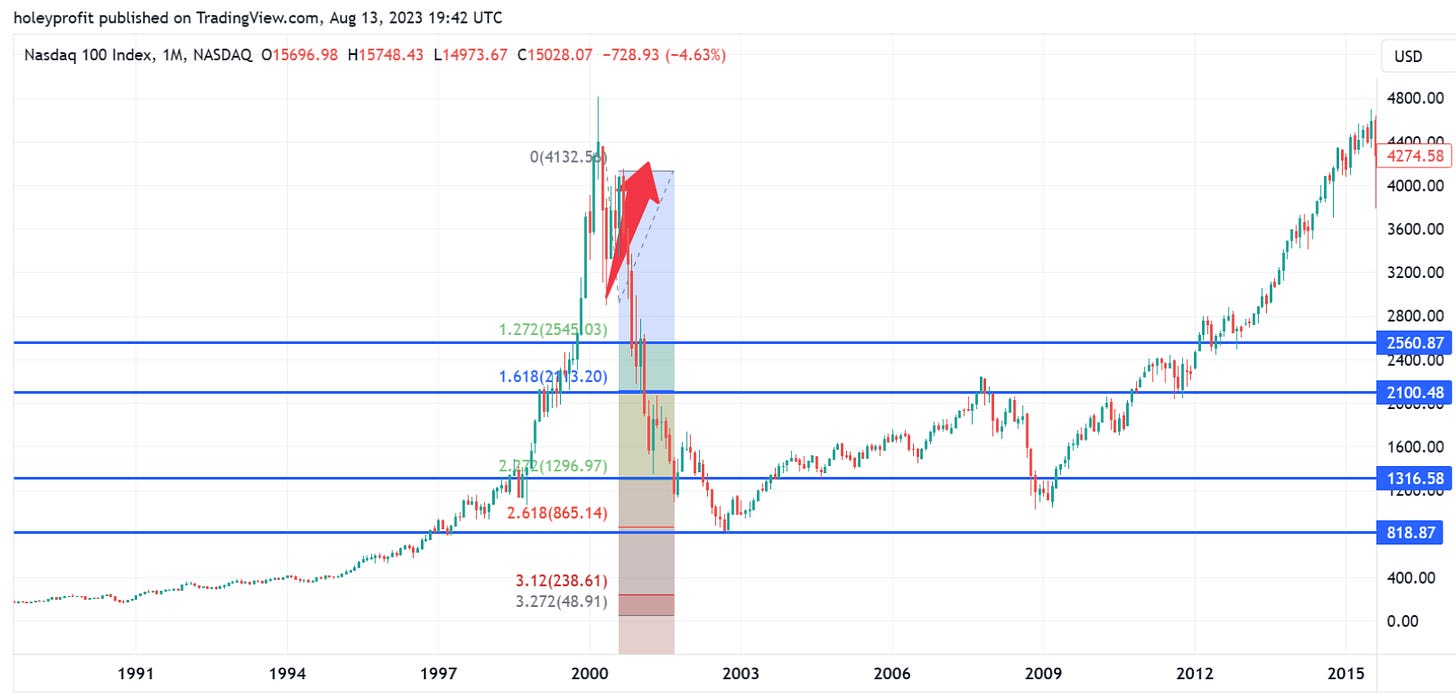
In previous crashes the RTN swing gave a good way to estimate the important levels on the way down. Here's a fib that you could have realistically applied to the Nasdaq in real time and could easily apply to current charts if the criteria fills. These are ENTIRELY NON-SUBECTIVE swings. There's only one high and one low in the RTN.
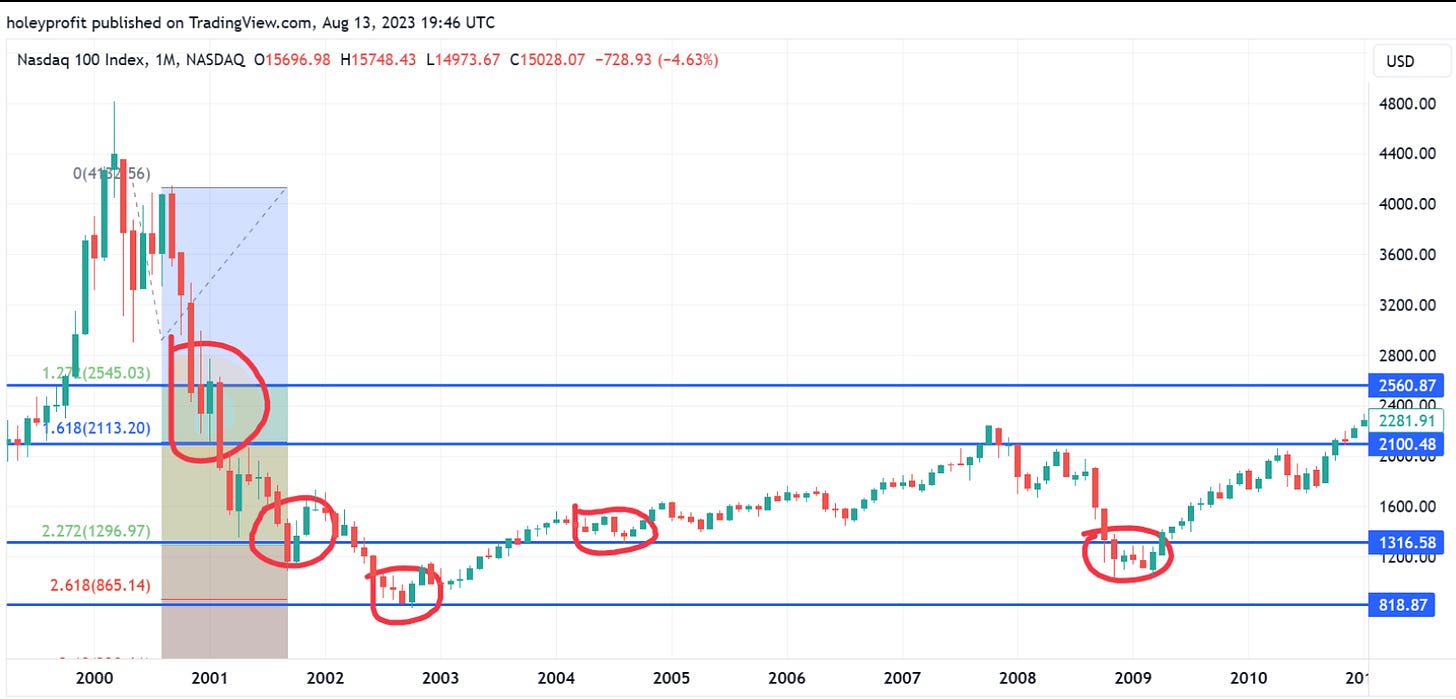
Let's look closer at what happened at these levels in Nasdaq.
Useful. And this is not a one off. If you test the same thing for the Japan crash you can find an even higher success rate of notable reactions off the fibs. Japan's bull trap was much shallower and thus it went to lower fibs.
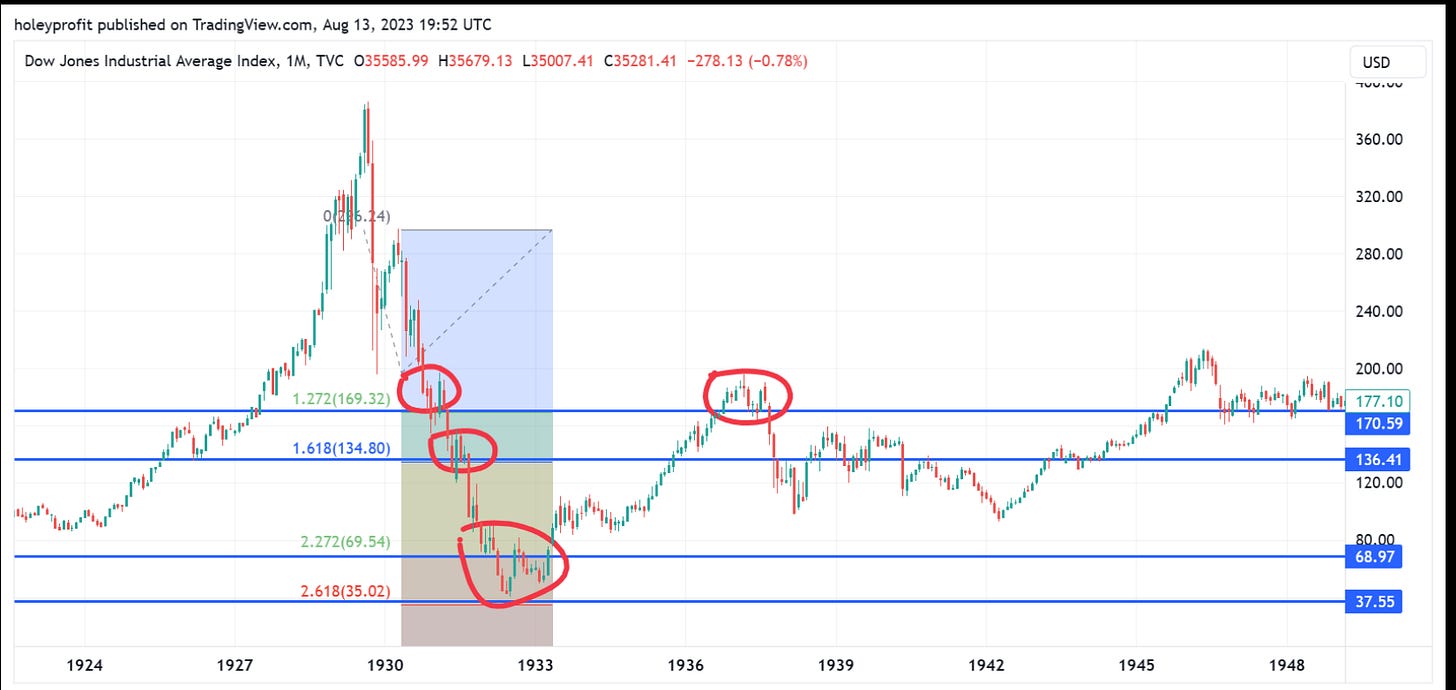
This is not a new thing.
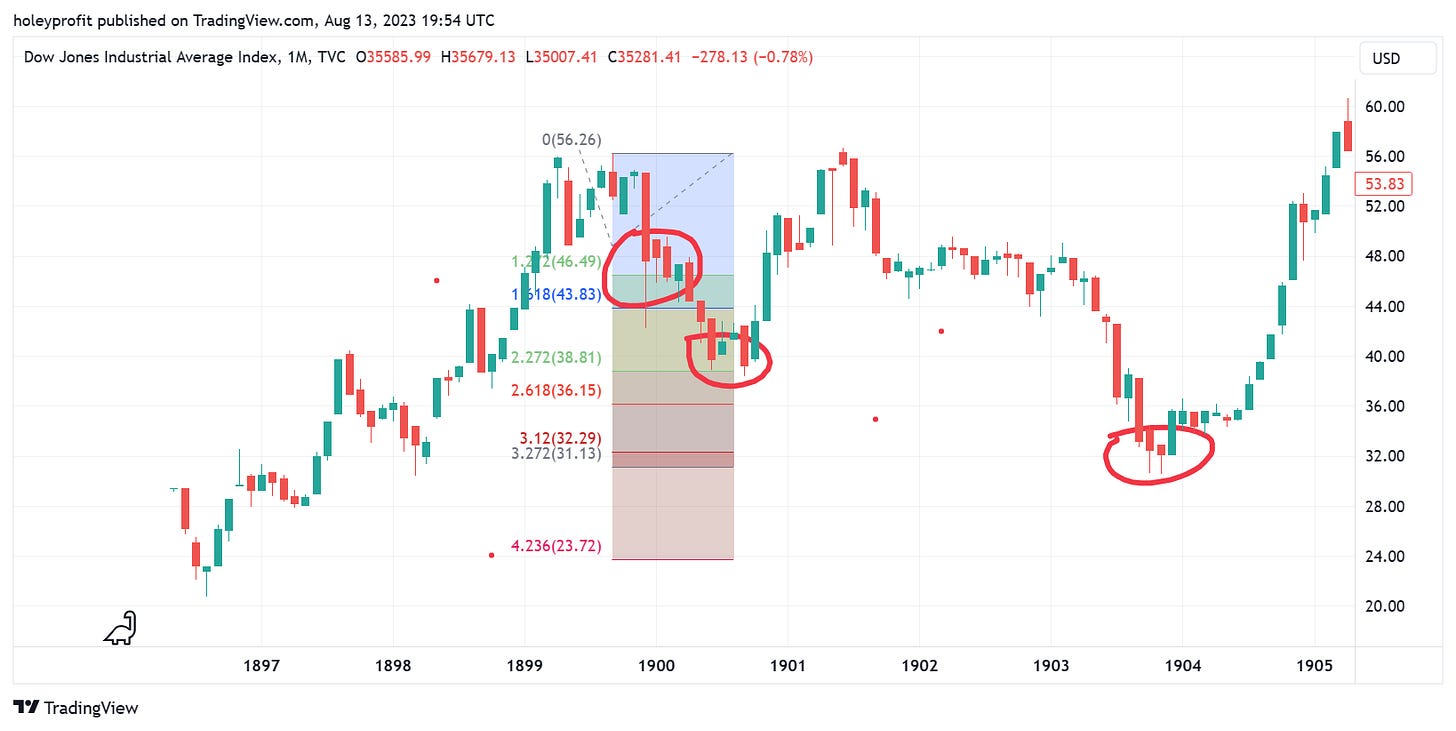
Here's DJI in 1990.
Let's apply some of the things that have helped in the past to current charts.
First we'll define simple clear norms:
- Price usually chops in the 1.61 - 1.27 zone.
- Drops are 2.20 or more (Meaning over 2* size of RTN).
- Big risk spots for bulls in rallies are retests of previous fibs.
When we at BTC we can see it has followed the chop and then drop to 2.20 norm and is now retesting the 1.27 zone. In the above examples there were various times moves like this were bull traps and following fibs hit. This would imply 8,000 for BTC.
Now that we've framed the potential significance of it (And please go test these for yourself. They're totally non-subjective. It's not curve-fitting) of a RTN and the fib swings we can draw off it, let's look at what they'd imply for SPX... And it's not good. It's really bad. The RTN if this was a legit one is really big. That forecasts a big drop.
In the classic bubble template featuring the "Return to Normal" everything after the RTN is just a nice smooth drop. Fear builds into capitulation. People get more and more scared as price consistently goes down and then everyone starts to panic sell and it's a crash. It's easy to be a bear after the RTN.
Yeah ... Don't do that at home. There are usually multiple strong rallies.
For one, the "Fear" stage usually breaks the last big low and then immediately goes into a rally or a range with a series of rallies. Between fear and capitulation there's a hope or frustration stage - depending which side you're on.
The capitulation phase can often look like it just dropped all the way on big timeframes but usually is built up with multiple swings with a many near term highs/lows and changes of trend. These could easily be months or even years if there was a prolonged bear. Meaning we trend down but intermediately have long bullish periods.
Usually before the low there's some sort of false reversal. This is most often a range that turns into a parabolic bull move but after the rally capitulated to new lows. Classically a news related move. The worst of the crash is now over. The market will usually have exceptional gains over the coming years.
But by this point, there's been too much false hope and real despair. Reflexivity bites in. People's recency bias switches from the market being generally bullish to generally bearish. Everything that's happened seemed impossible and the last thing they are thinking about doing is fishing for bargains when even more bad news is hitting and it's capitulating.
DCA Dangers
Many people believe they could DCA their way through any bear event and do well in the long-term. The problem with this if we head into a bear market is the market is going spend a long time in ranges or in rallies. The capitulation periods will be fast and often there will be huge dead cat bounces after them - followed by ranges before more fast drops.
What actually is likely to happen with DCA is people end up loading up positions into areas of the market that are going to be very high relative to where price is going. Price can end up really low without their DCA reflecting them having this low entry. When this is drawn out over years people will start to feel differently about markets.
Most people who are trying to DCA into a market during a bear market are also going to be experiencing a loss of income. Jobs are lost. Business slows down. Rents dry up. It's harder for many people to allocate as much capital to markets now as they could during times of stability. Many factors come together to suggest people will have top heavy positions on their DCA.
Then there's just the real life squeeze. The need to sell assets because you need the money. It's easy to say you will not sell stocks but the reality is most people who sell stocks do it because they have to rather than they want to. A sustained bear market will make most people need access to cash. Liquid stocks are cash.
We have a saying here, I suspect there's similar ones around the world; "It never rains, it pours". Meaning, things don't just go wrong - they go terrible. The effects of a bear market can have compounding pressures that make it a realistic prediction that most people will DCA in high relative to where price ends up and most need to sell when it's low.
The DCA strategy is not infallible. It's just an aggressive trend following strategy. If that trend fails and does not recover for 20 years, the strategy fails. At least for most people. It's just not viable in practice. It's great in theory and it's great in a bull market. But it is an aggressive strategy that can really go bad.
If anyone has ever tried their luck with grid trading EAs you'll know the deceptive nature of DCA like strategies. The PL curve on those things has a very distinctive look to it. Looks a lot like those bubble chart. Which seems to be a very risky game to be playing with your financial future.
If a real return to normal is forming the implied forecast would be really bad. Something really bad would happen or in the 2020s we have to break the norms of all the major crashes stretching back to to 1900. While it seems a silly to think simple fib swings could forecast such events - it clearly always has.
Why should it be different for us? There really isn't a reason. The reason is always "They won't let it". But they might. For any anyone knows, "They" might want it.
This all sounds fanciful now. We'd be looking at SPX under 1,000 in a full boom. AAPL would be under 30. Memes already heavily down could be down 70% or more. Relative to 2021 the speculative booms would be trading at pennies on the dollar. It's not what we've become accustomed to, is it?
But if this did happen - do you think it would be hard to explain to a child in 30 years time why the US bubbled and popped?
Note of caution:
The classic template can be flawed in various ways. One of them is the “Return to normal” can make a new high. Read more about this here.


I appreciate that you are presenting more and more detail in recent months. Trading/Investing is a life-long study and I really appreciate that you touch on details that either illuminate new things for me (or historical data that supports your view/counter view) and it pushes me to research new ideas and test my own theories and application.
It reminds me that no matter how much I think I know, there is always more to learn or that there is another (valid) view.
Thank you for your efforts!