
I think that's the last big bull trap in.
I think that's the last big bull trap in.
Big kaboom to both sides yesterday, might open the door for the real action.

A rule to live by in trading, before the big trade- the market will usually kick out as many as it can. During yesterday’s wild price swings, this was accomplished. Now we might be approaching the real trading swings. I think into the next low is when we’d see the really strong selling.
Firstly, for positioning this looks like the ideal entry zone and stop loss. We’re looking for a sharp rally and then once this is in the following swing will to become the actionable break. Limit orders to enter into the highlight and the red cross indicates stop losses (New highs invalidate this analysis).
Putting this early in the post because it’s the most actionable part that may trigger soon.
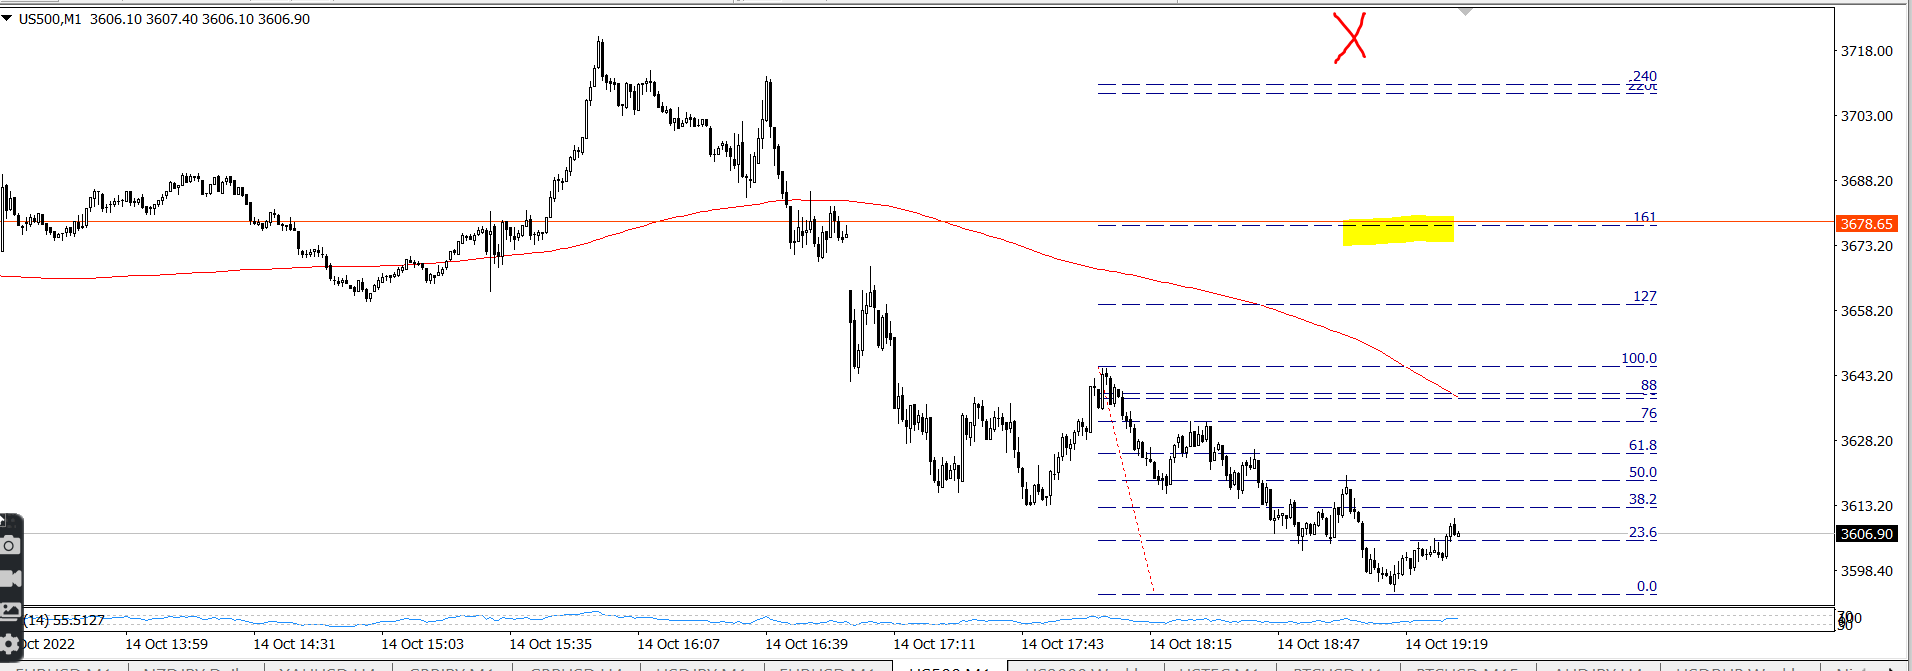
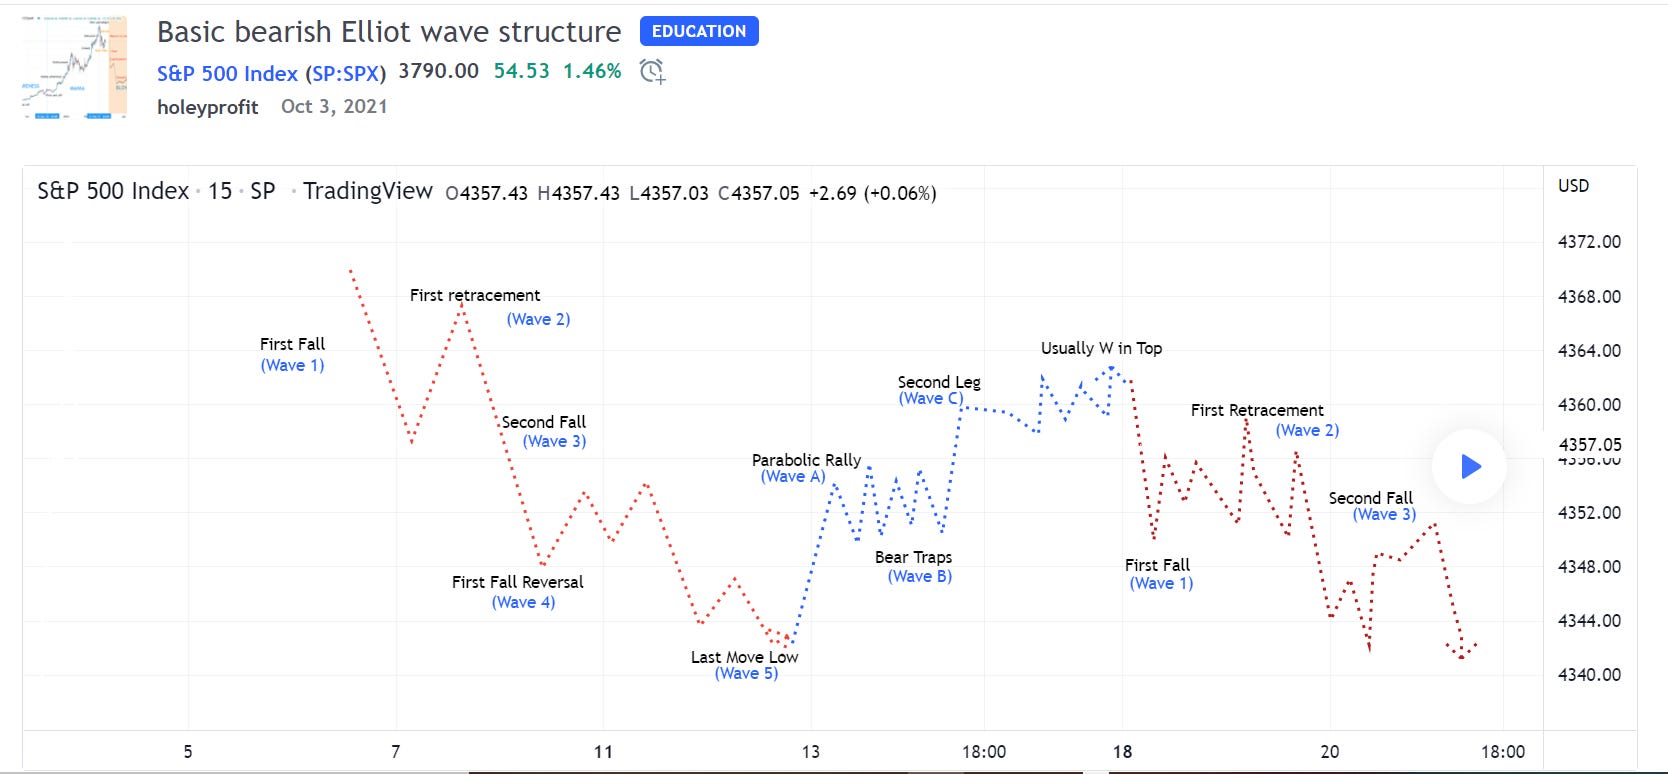
This would be basic Elliot wave stuff. We have the first drop in and a second rally for “Wave 2” sets up optimal entry.
Scaling out to look at the bigger setup.
Firstly, sticking with Elliot wave, we have the swings explained in the previous newsletter but we were off on the levels expecting to see a low 3400 before a big rally. This led us to be caught out a bit yesterday but on a broad swings basis we have seen something like we expected and it helps us with forward planning.

CPI dump was consistent with wave 5 rules and from there we went into a parabolic correction that ended in a W top.
Very fitting with the bear market rally template provided.

Now we’d be looking for the “First pullback”.
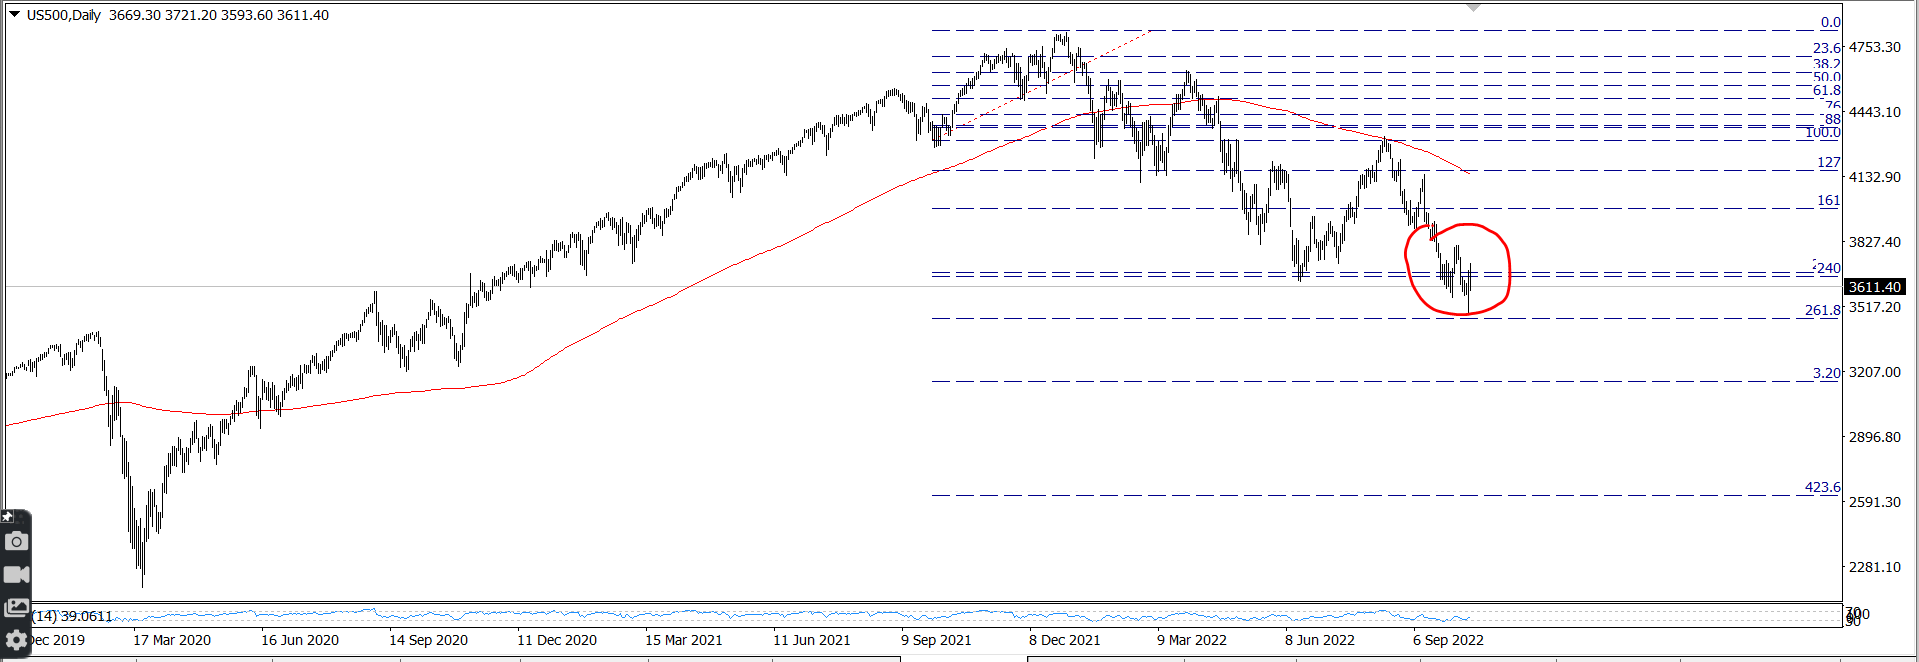
Yesterday a breakout was made. All simple rules can define it. We broke the lows on weekly chart. Made a new yearly low. Spiked under the 200 SMA of the weekly chart. Many different ways to define a breakout was made yesterday, but interesting all the attention was on the rally for the most part. Few mentioned the break.
From our perspective, the most important thing that happened was we broke under the 220.
An insta-rally inside the last leg really makes no difference to this. It’s more common for a breakout to instantly have a bull trap rally than it is for it to continue going. In at least 3/4 cases this is what we’d expect to see in standard bread and butter breakout/corrective patterns.
Nothing major happened - but it all happened quickly and that always puts people’s heads into a spin. When most people are in a spin, is when the best ops are. All that’s required is to be prepared, be calm and ready to execute on plans. Define what makes them wrong, set stops. And wait to see what the market does.
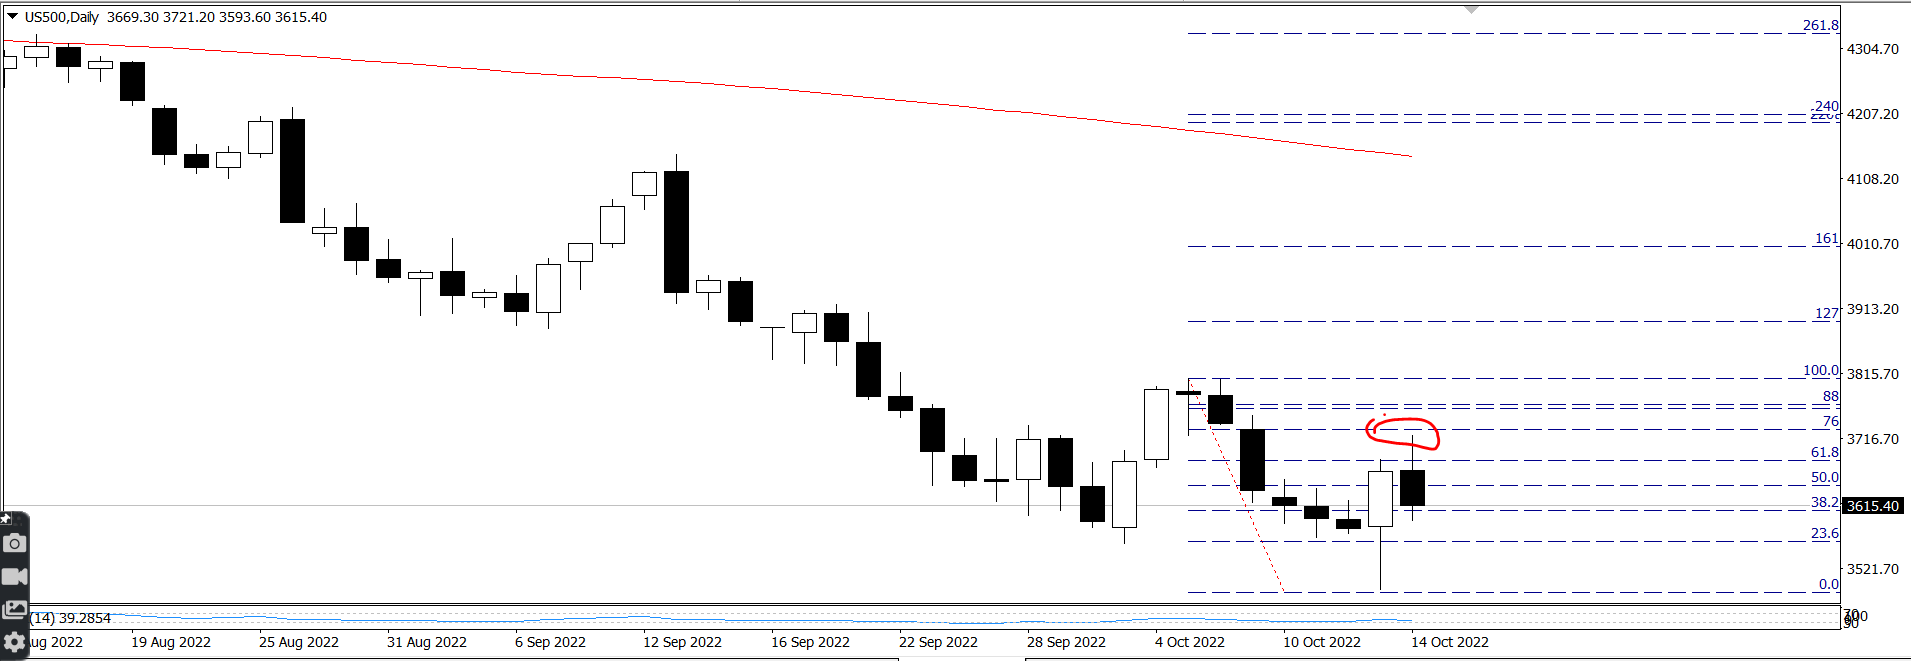
Currently the daily chart correction has went to the 76 fib. This is trend continuation 101.
Since some of this is time sensitive and if the rally is coming to the level mentioned it’s liable to be a quick one, we’ll send this issue of the newsletter out now but over the weekend we’ll have a follow up part with more actionable plans/details for a potential drop and also expanding on some edu/theory stuff.
Our estimate at this point would be SPX closes somewhere close to the proposed entry level. We have a bearish daily candle with a bit of wick under it. The next daily candle will be a strong bear candle. This may start with a gap down in Asia. It’s also possible this comes with weekend news.
We’ll expand more upon these over the weekend but at this point we’re just noting down this series of fairly unlikely seeming events as things to be sure you notice if they happen. If these swings happen, we’ve been the accurate forecast purely based on observations of how price has historically acted before major crashes.
If there’s a time for deep OTM puts on SPX, the time is now.