
I think this is a spike out. Here's why, and stop levels for if not.
I think this is a spike out. Here's why, and stop levels for if not.

Markets are now trading a bit above big resistance levels. While this is uncomfortable as a bear, I’ve said various times we do need to have some tolerance for stops being run. There’s a difference between tolerance and stubbornness. We need rules to define when a false breakout theory has failed (And stop out shorts).
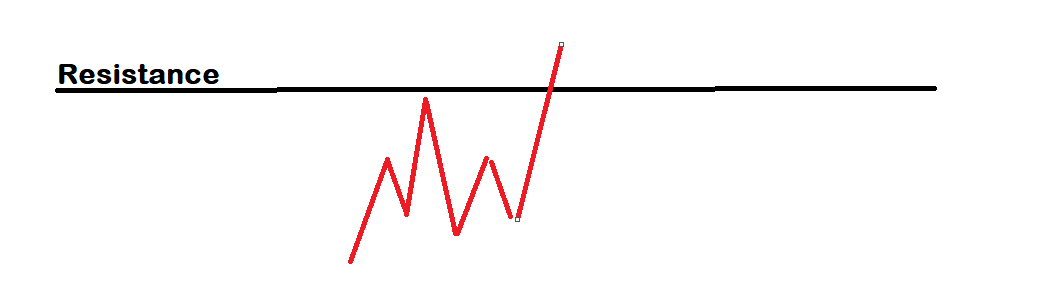
Markets trading above resistance is okay if they reject with a wick on big charts (Or maybe close strong but instantly reject a few candles later). And we should be seeing this in one of the known spike out patterns. The most famous of these is head and shoulders.
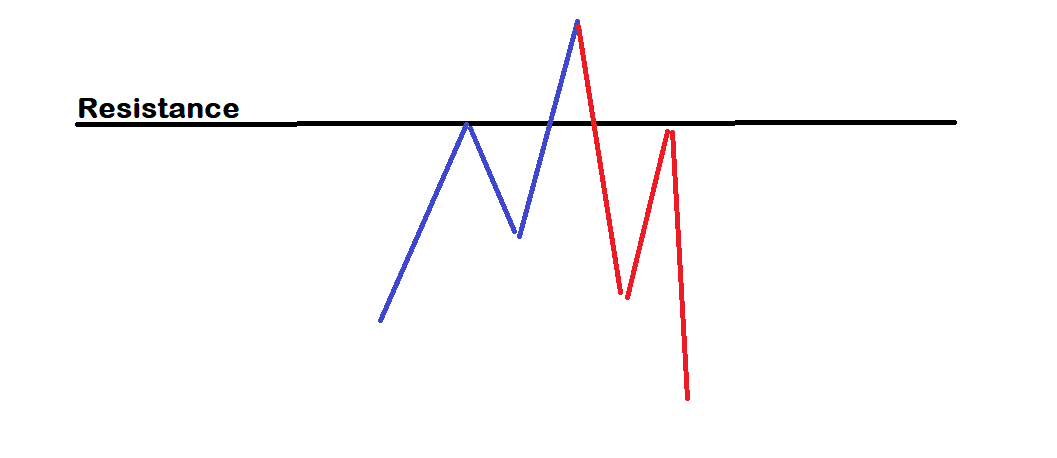
The head and shoulders happens a lot but the most useful pattern to look for I find is a butterfly.

The butterfly is often found inside a head and shoulders. When this happens there will usually be a false head and shoulders pattern off the resistance. This breaks with a spike high and this spike high is the last leg of the butterfly. The false head and shoulders becomes the left shoulder, the butterfly spike the high.
This is seen a lot in tops. We gave this sort of move in a template of how a bear market rally tops.
Understanding the bear market rally. - by HoleyProfit (substack.com)

As scary as the current action is, it might be this.
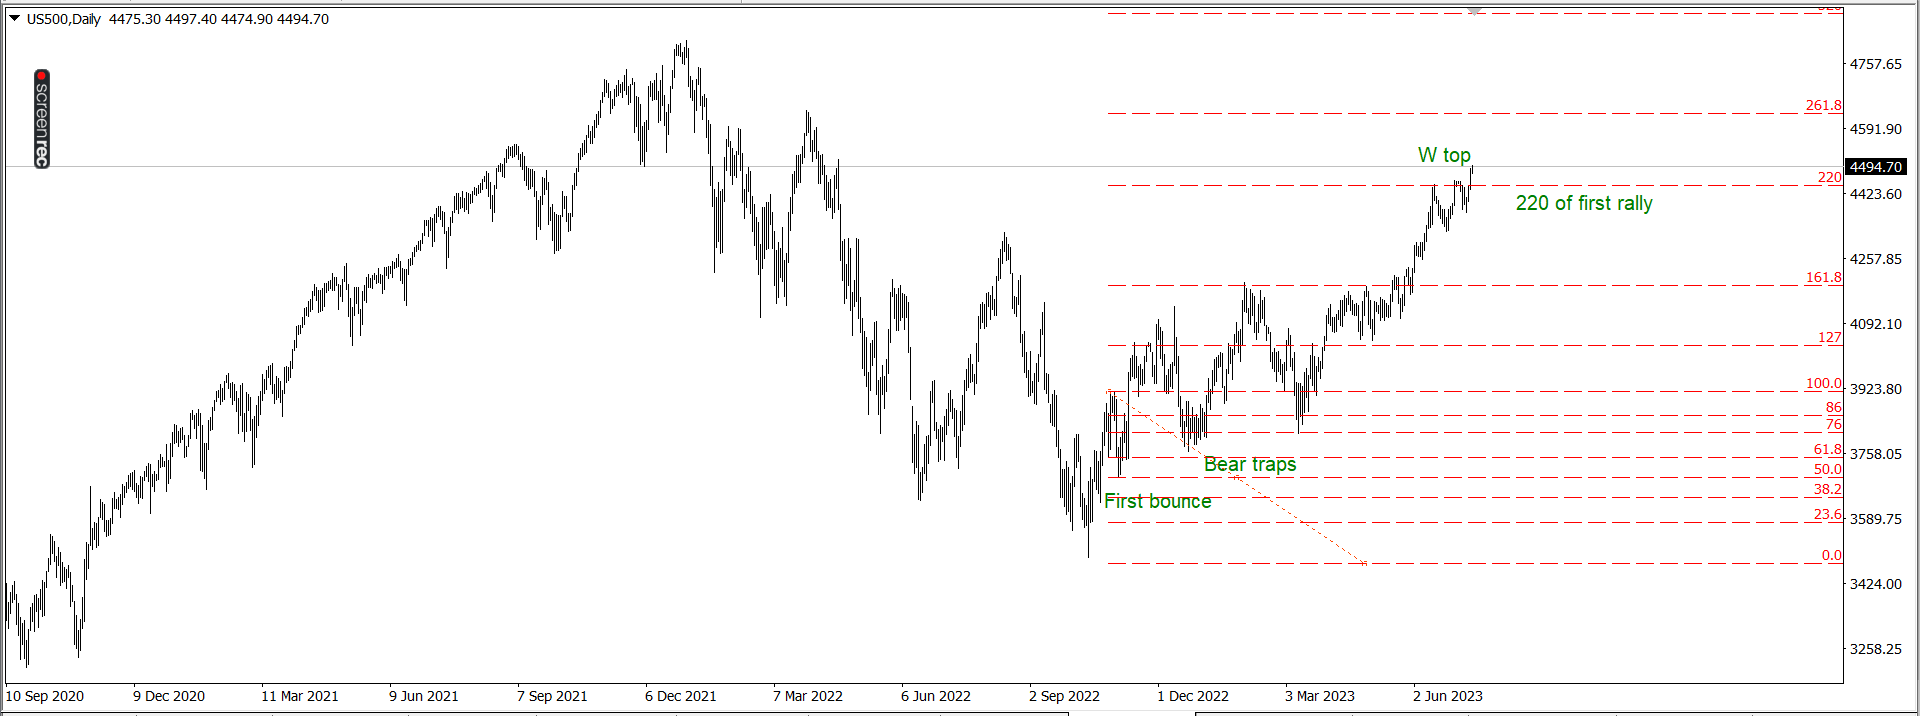
Nasdaq has a clear W like pattern and is currently at the 161 (Possible reversal level).

Fits all the stages on a big timeframe. To control our trading we need to use smaller timeframes and find practical stop loss points (Because large timeframes are very wide and it’s better to get out and back in higher if you want to). And we may be in butterfly spike outs on smaller charts, too.
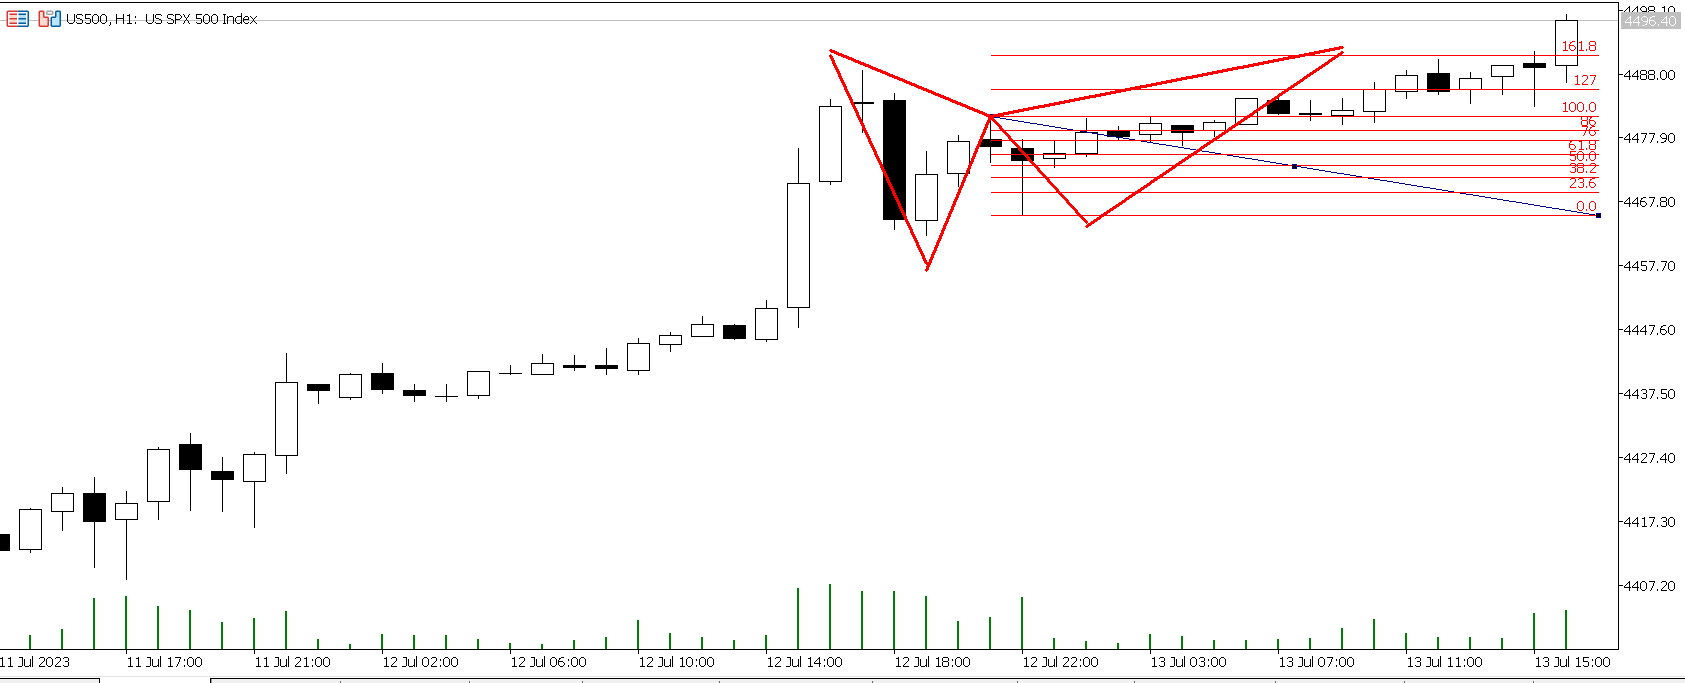
But for this to be the case, we’re going to need to sellers coming in soon. Price should not be able to break the 220 here (Usually it’s heading higher if it does). So we should see sellers coming in at or before 4500.
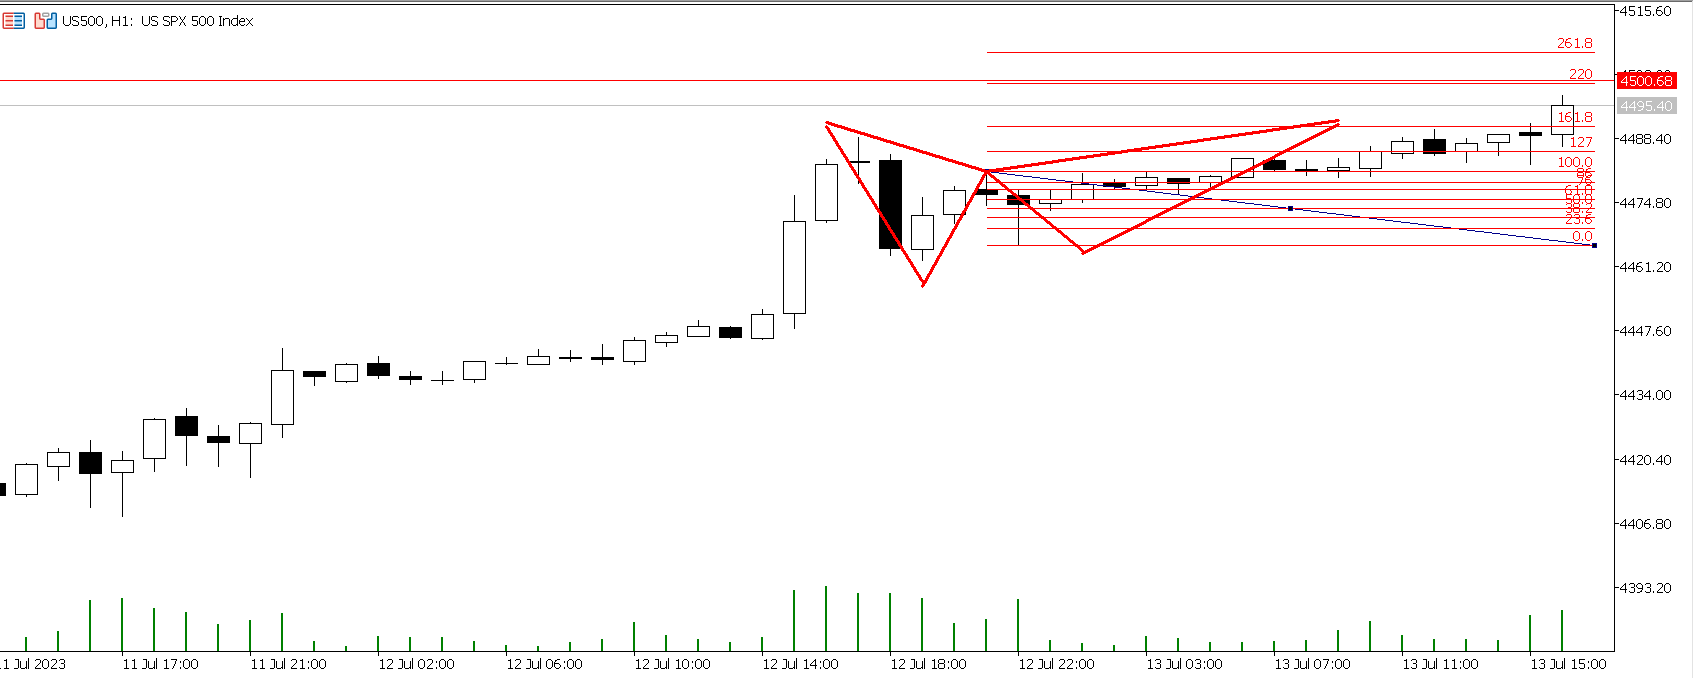
Above there, we’re probably going to see 4530 - 4540. This is another good level to short but if 4600 hits I’d probably have a net long bias (After a dip, 4600 would probably dip the market, but not good for bears if it hits). I think there’s massive RR on the bear trades here, but these stops zones are important.
Above these levels, I think bears ultimately get the horn. The short I think comes, but maybe closer to 5000.
The Big Harmonic.
We’re now trading a spike out of the 161 of the harmonic from the previous year’s action. What happens here is likely to be critical to the trend for the next 600 points, at least. If bulls can break this pattern, ultimately a new high will likely be made. If this is a corrective pattern in a downtrend, the second drop will be bigger than the first.
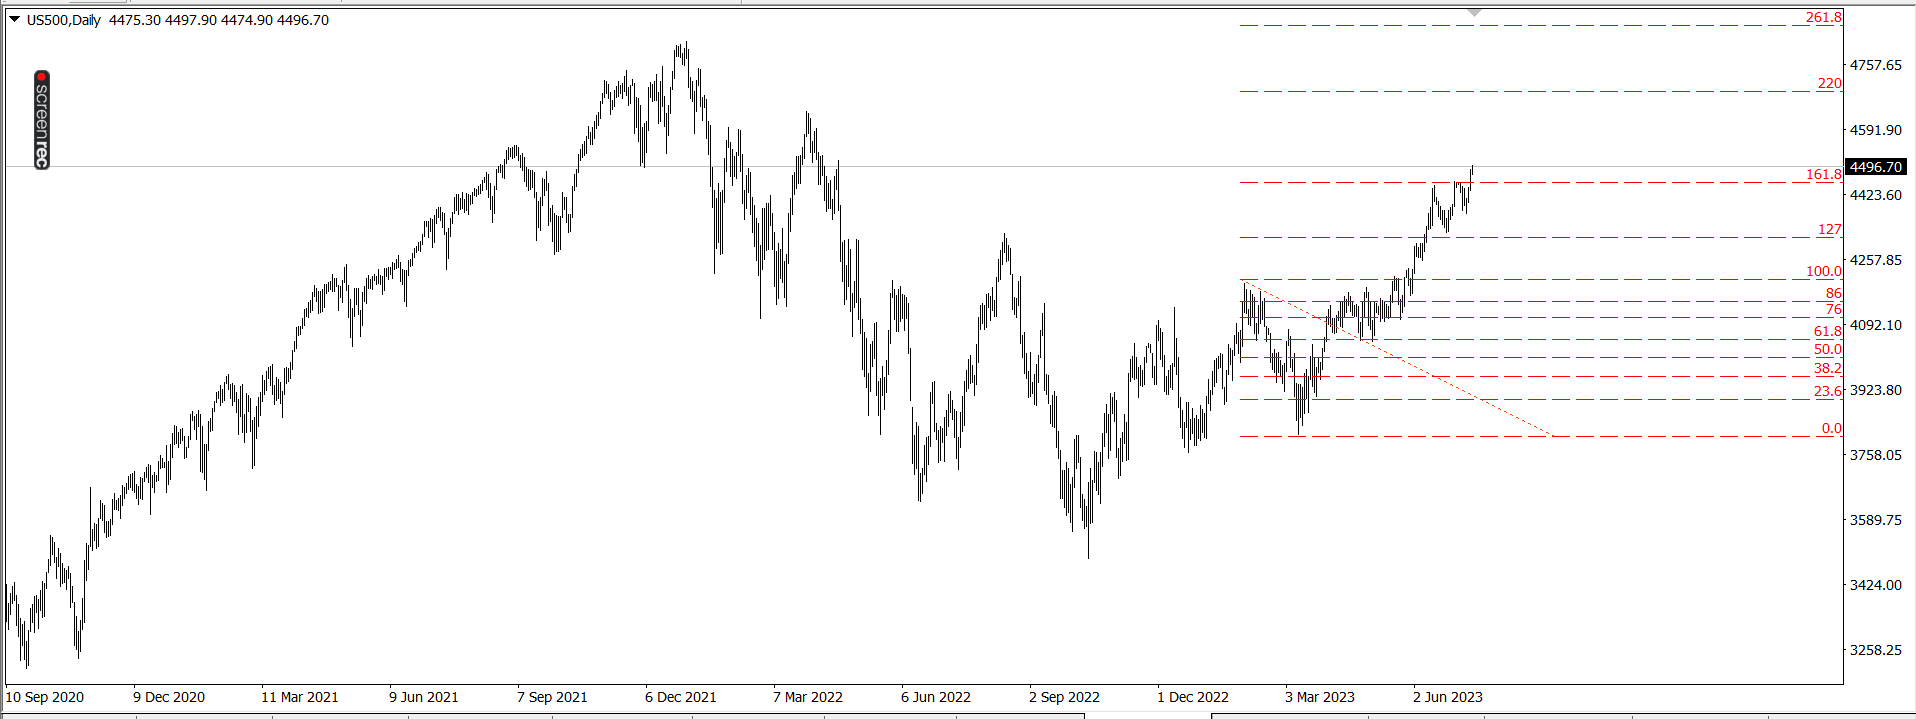
The target for this type of butterfly break is the 220 of the full rally.
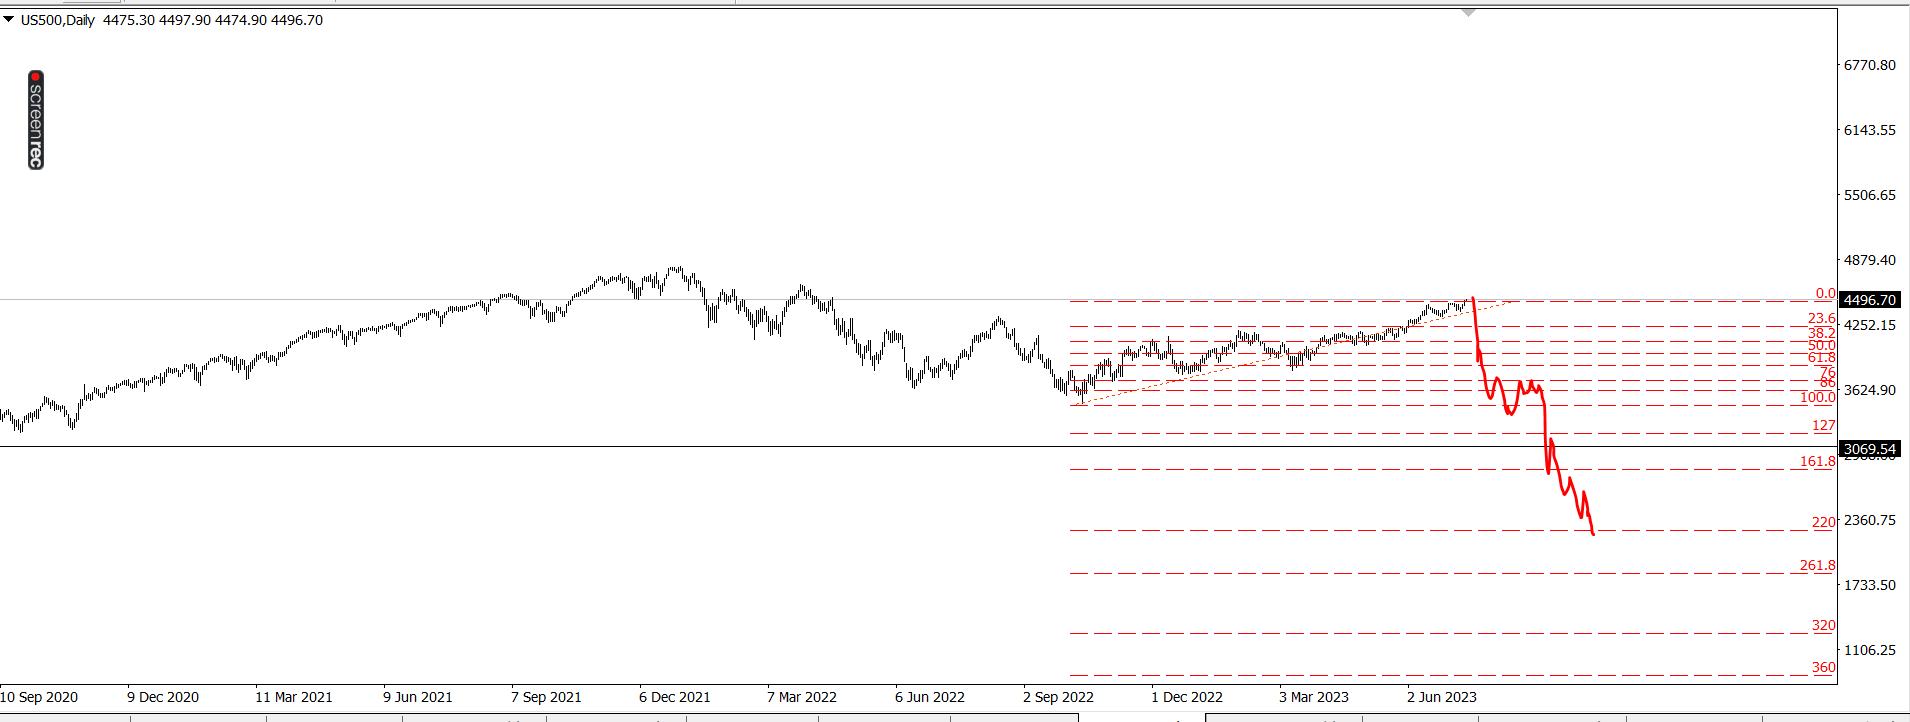
Harmonics turn in vicious moves! We have quite the confluence of harmonics here. It will not be subtle. It should be obvious bears are in control when they are. Usually, this is going to be driven by some sort of news. That’s common of harmonics and seems essential for a move of the implied scale.
Something big is going to happen when we have a big harmonic. The failure of it will be break and the success of it would be spectacular. Mark my works, something big will happen upon the resolution of the big harmonics. It’s one of the surest things I’ve seen in trading.