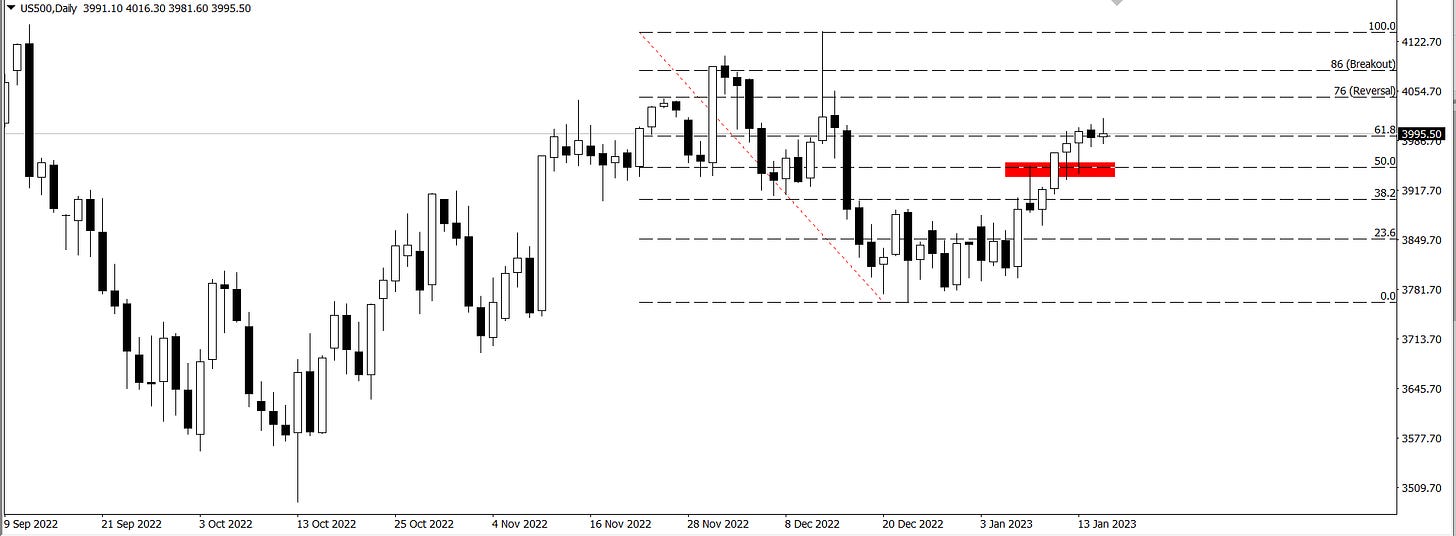
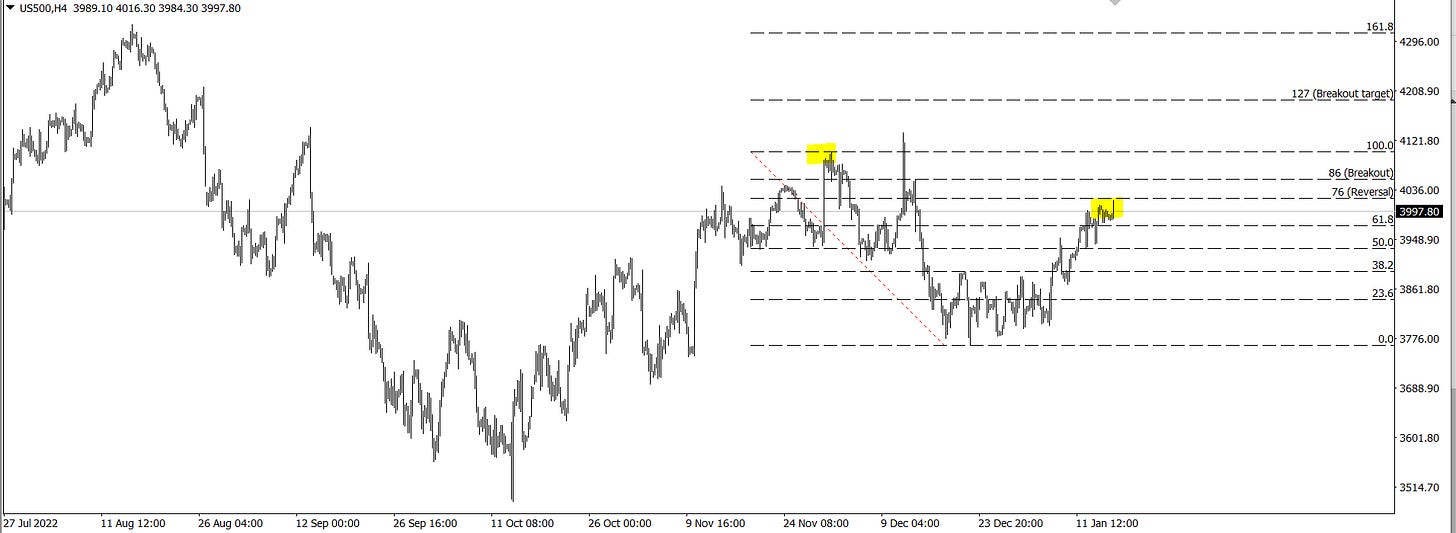
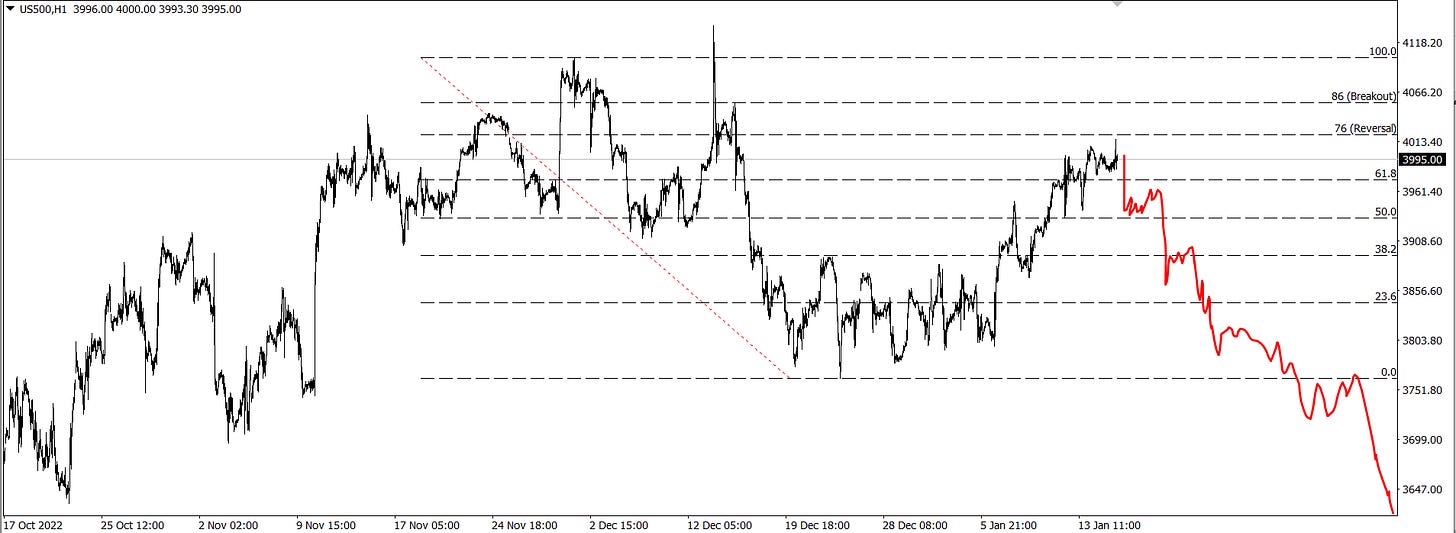
Previously we looked at two potential levels for the bears and a stop out point in the middle of these. We ran through the first one and are now into testing the second the one.
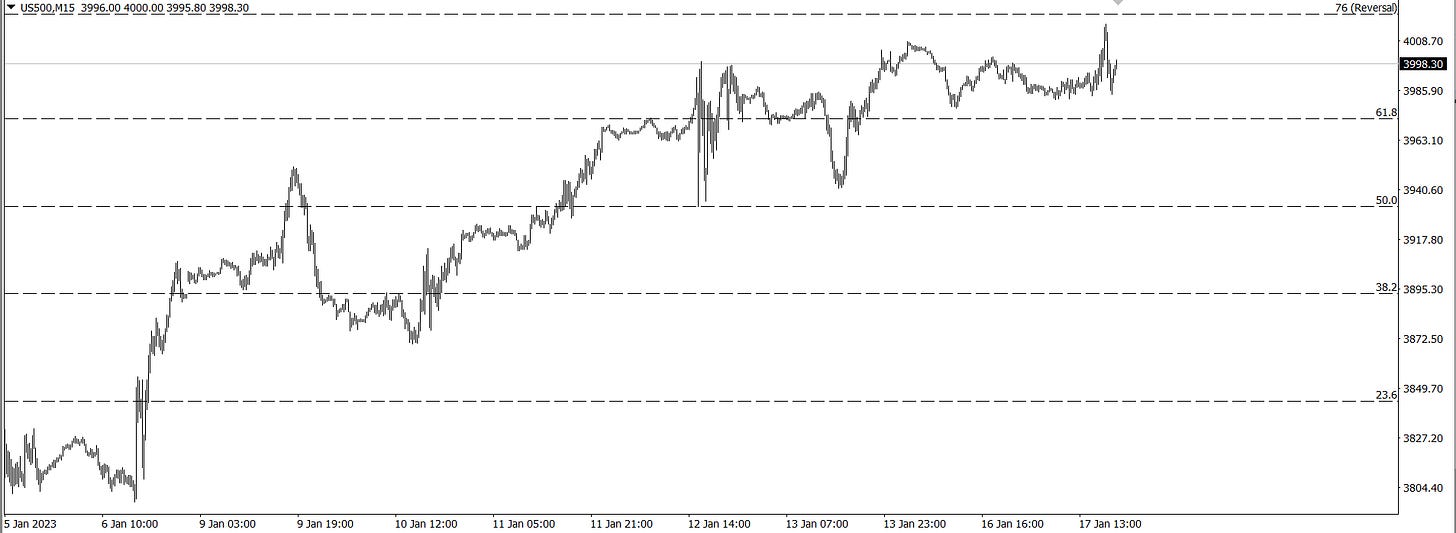
Based on this plan, we’d typically still have a long bias since we’re not yet really close to the 76. However, the current action in the market has a decidedly bearish tone to it. Moves over the last hours looked a lot like what we see when we’re starting to make a turn.
I usually draw my fibs wick to wick. I’ve found if you cut out the wicks and look for earlier entry points more often than not you’ll wish you’d used the wicks. The first proposed fib set is wick to wick. However, if we were to draw this without the wick we’d be right in the 76 area now.
There’s a bit of a case to be made for discarding the wick here. It came off the news pop and only traded there for a few minutes. All the candle closes strongly imply the important level / high was made and this was just a bit of a stop run.
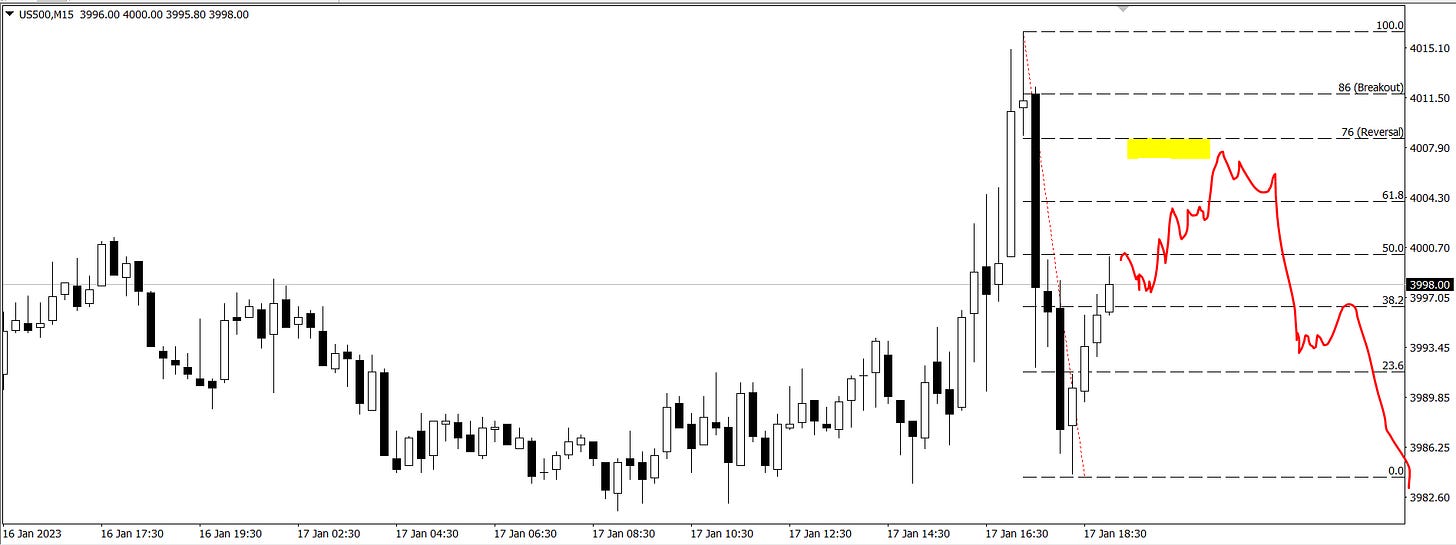
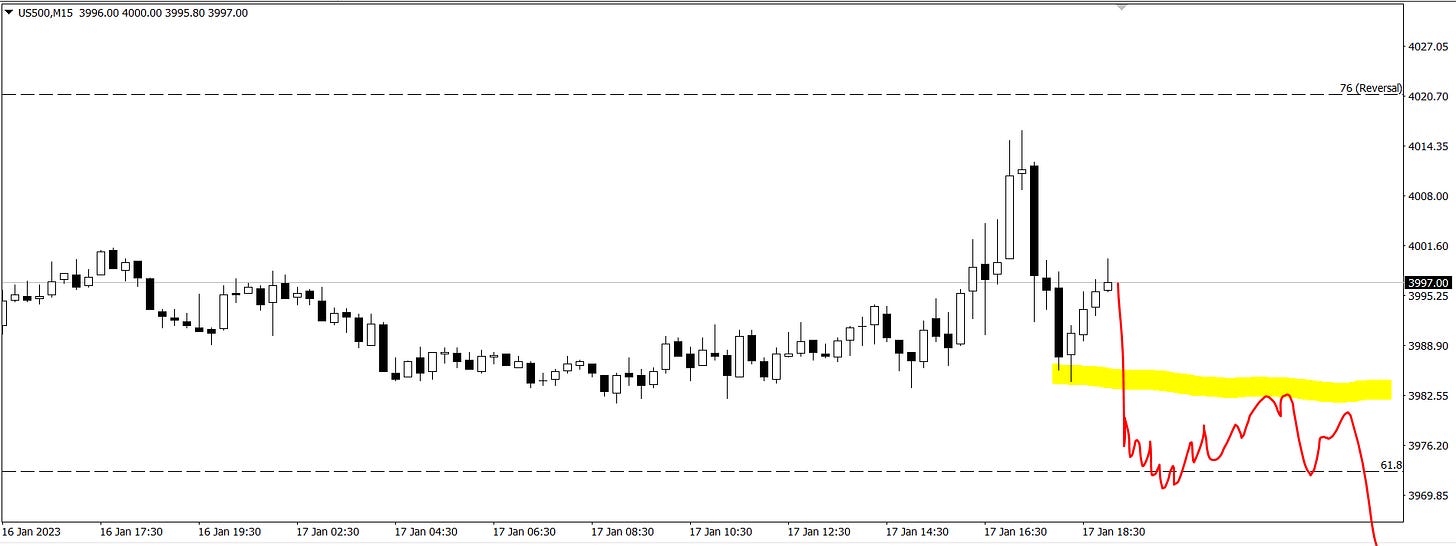
If we were using that fib set, we’d not be surprised to see selling around this level. Here’s the move on a 15 min chart.
The obvious entry pattern here is to look for a 76 retracement. Stop loss rules are simple. Above the 86 fib for tight and above the high for wide.
Shallow bull traps can happen and they can be harder to deal with, but if that’s the setup that comes we’ll typically get some sort of bounce on the 61 fib to retest the break and we can short into that.
If a sell off starts from here it’s liable to be a really strong one.
Conversely, bulls getting over the 4070 price would be very good for the bull case. If we have a bear move coming that’s going to break the yearly range lows (Which could start a legit downtrend) as per common traits of a correction we’d be either starting that now or have a tiny spike higher. The next move high being the last one (Which usually means it would be a fast one and it’s wise to remain cautious of it).
I think we’re at a pivotal point now. Big decision to be made in the 4000 - 4070 area.
Here’s some more interesting big chart patterns over various markets.
Keep reading with a 7-day free trial
Subscribe to Market Forecasts and Trade Plans to keep reading this post and get 7 days of free access to the full post archives.


