
Major inflection point in USD.
Major inflection point in USD.
Strong dollar trends upon decision are likely.

In this post we’re going to cover a macro swing forecast of the USD. Using DXY and some of the US majors. The primary thesis at this point is the DXY is making a big low just under 100. We’ve seen a correction in a uptrend. The next leg will be bigger than 2021-2022 rally. DXY target in this scenario, up to 150.
If the reversal levels fail, we probably have a lot more to fall. We’ll plan breakout levels.
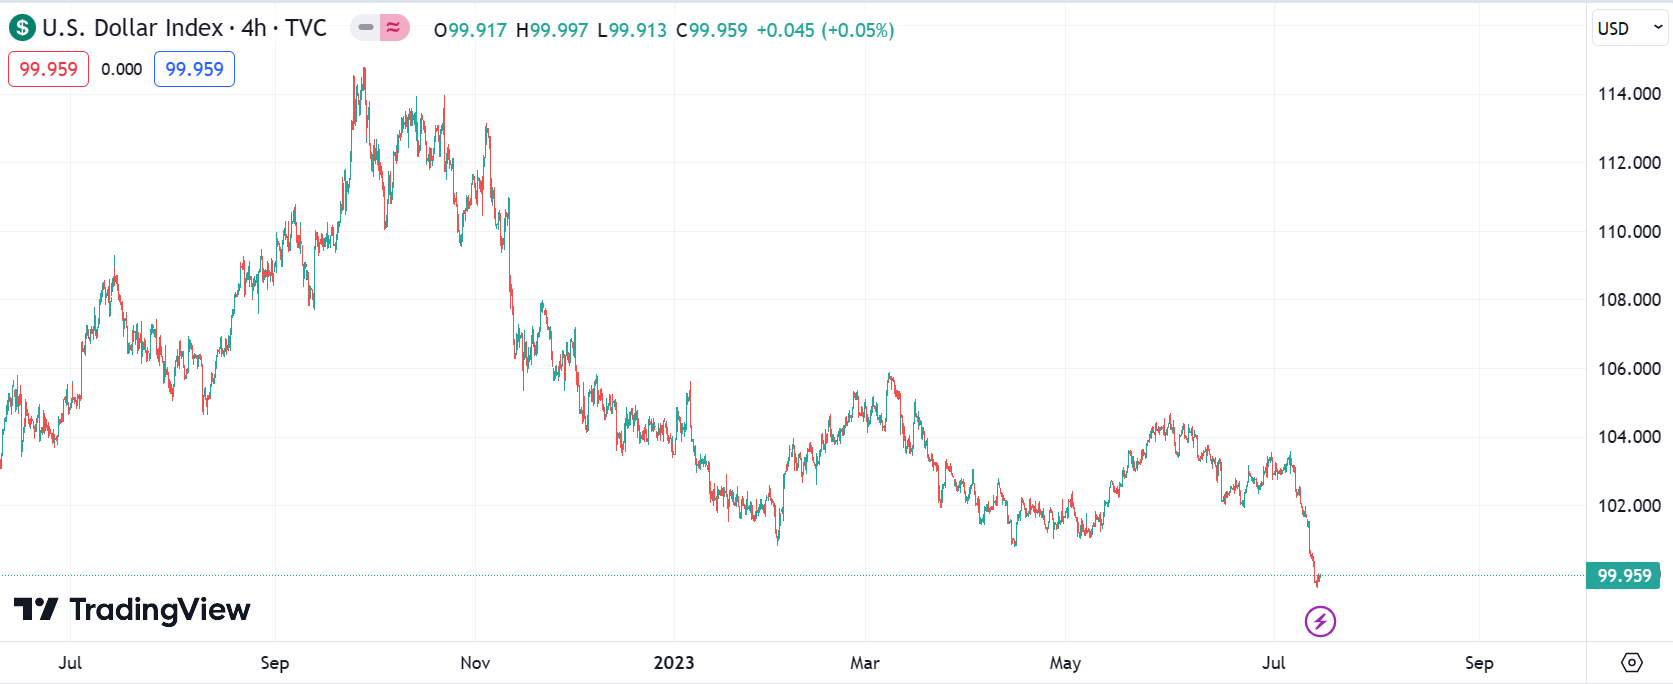
There’s a growing perspective that DXY is suffering extreme losses. Really, it’s just moving fast and getting attention. The DXY chart is one of context. When we look at recent charts it looks like a significant devaluation.
When we look at a monthly chart DXY is going up and down inside of the same general area it has for a very long time. It’s business as usual.
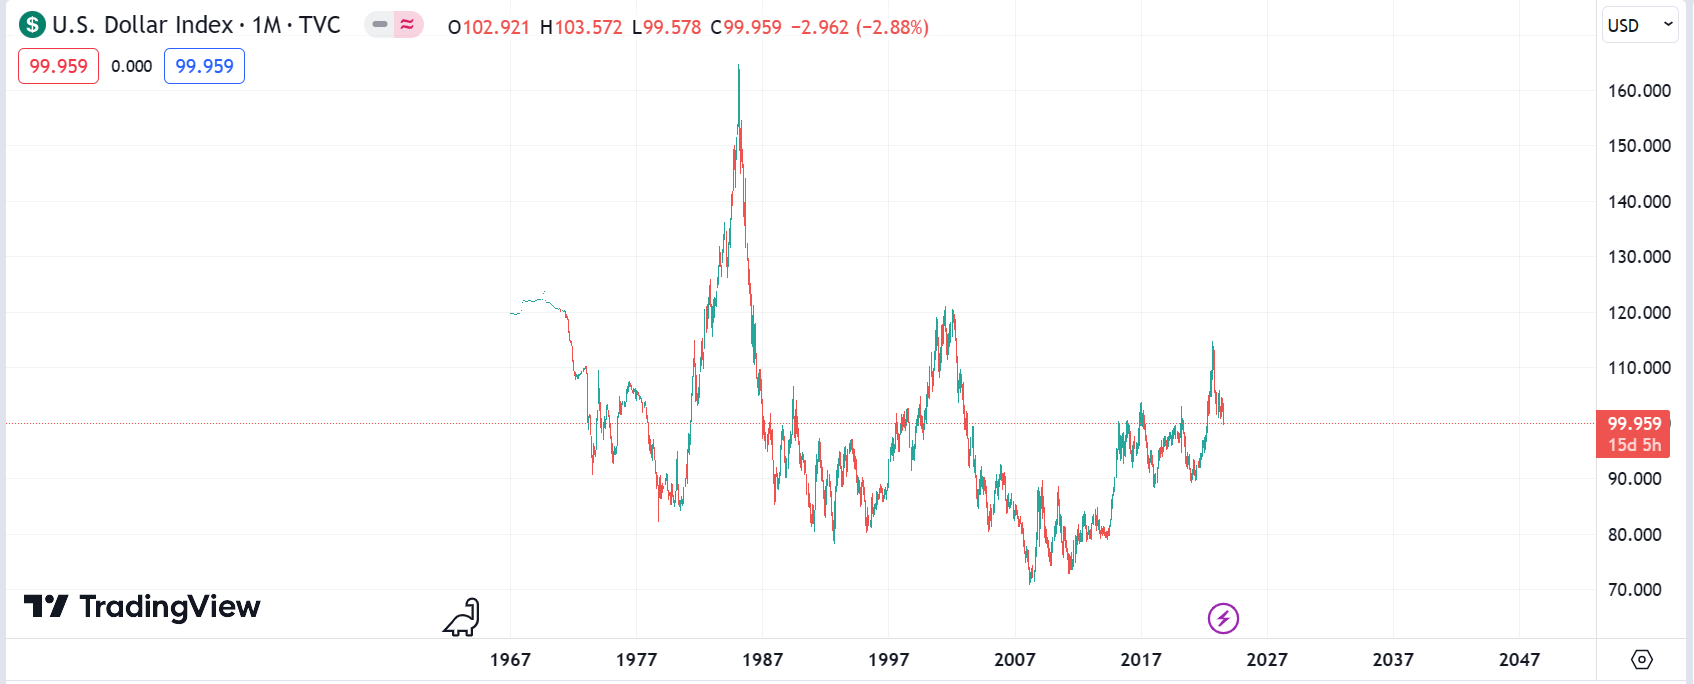
Based on what is happening now, there’s no significant event in the USD. Not saying there will not be, it could be crashing to the bottom of the range or worse - but any idea something BIG is happening in the USD right now is an illusion. It made a big move up last year and it’s made a sharp correction of it. Typical.
If we look on a weekly chart, we can see DXY made a big breakout last year and we’re now back to retesting this breakout.
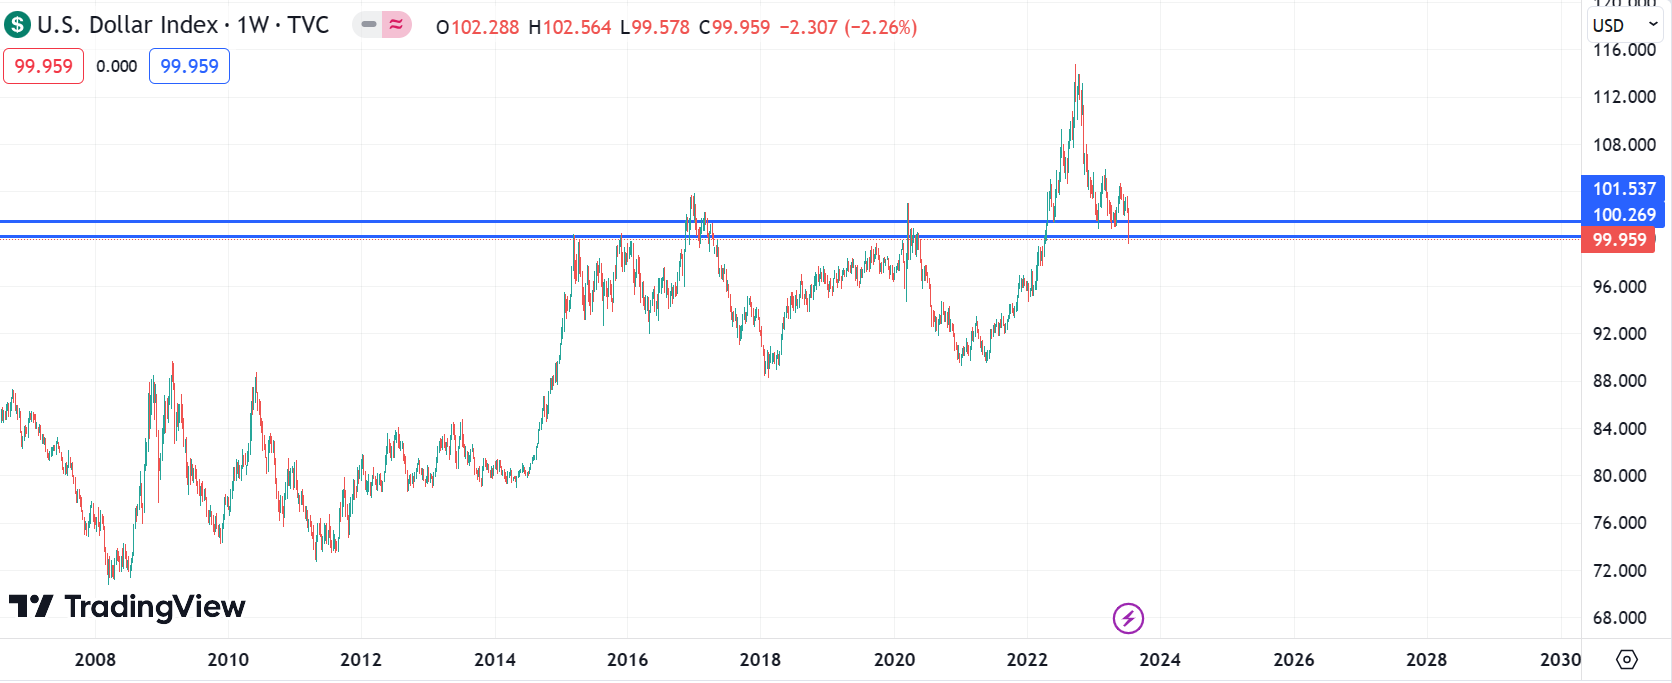
Breaking under this level could be significant, but the obvious thing to be doing here is looking to see if there are long signals into the support level.
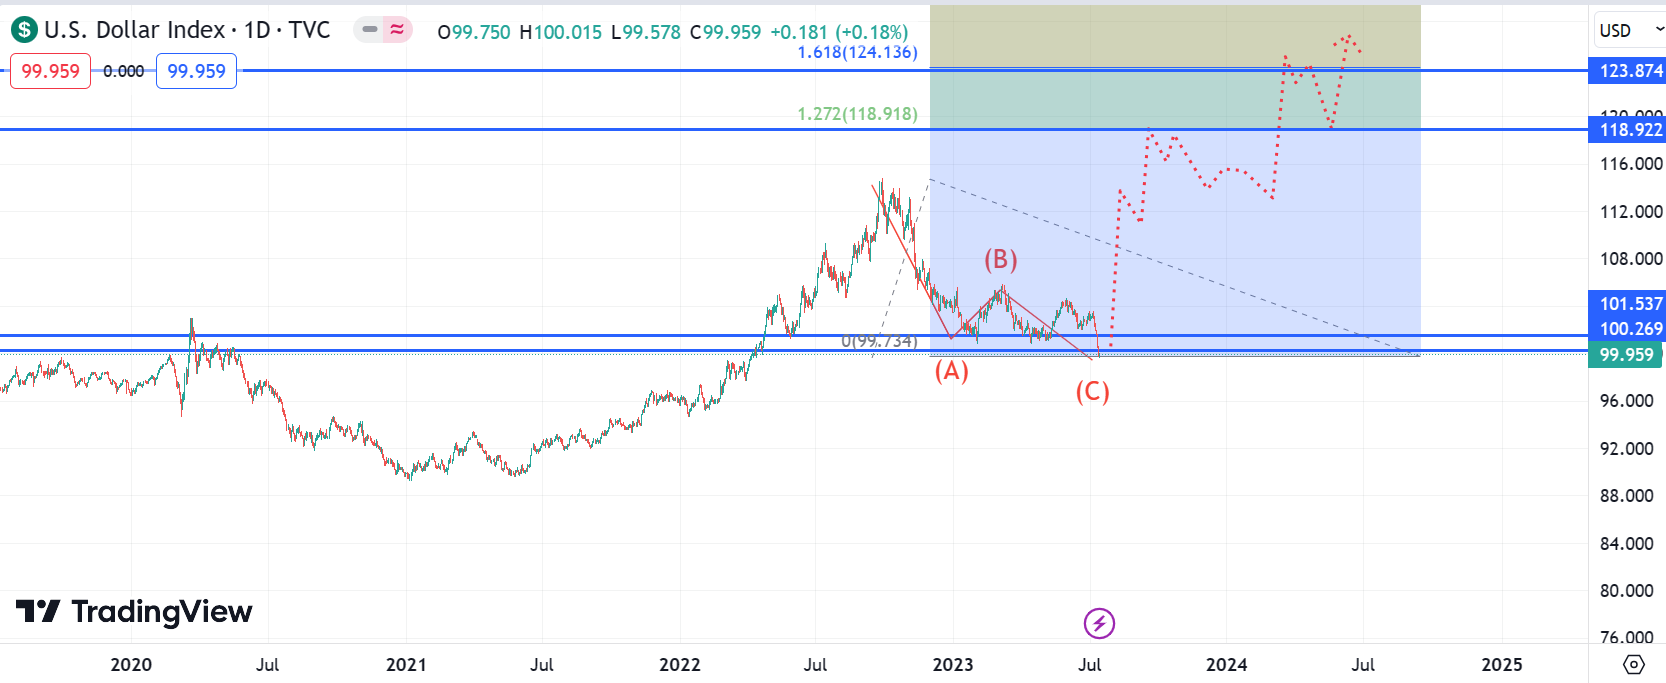
On the daily, USD has crashed breaking the recent low. Scary price action for a bull, but this is currently in a “M” shape. It may be a bullish harmonic pattern. In a bullish harmonic pattern we’d be looking for capitulation in the last leg. The obvious thing to do here is to look for longs on the butterfly and be ready to reverse if it breaks.
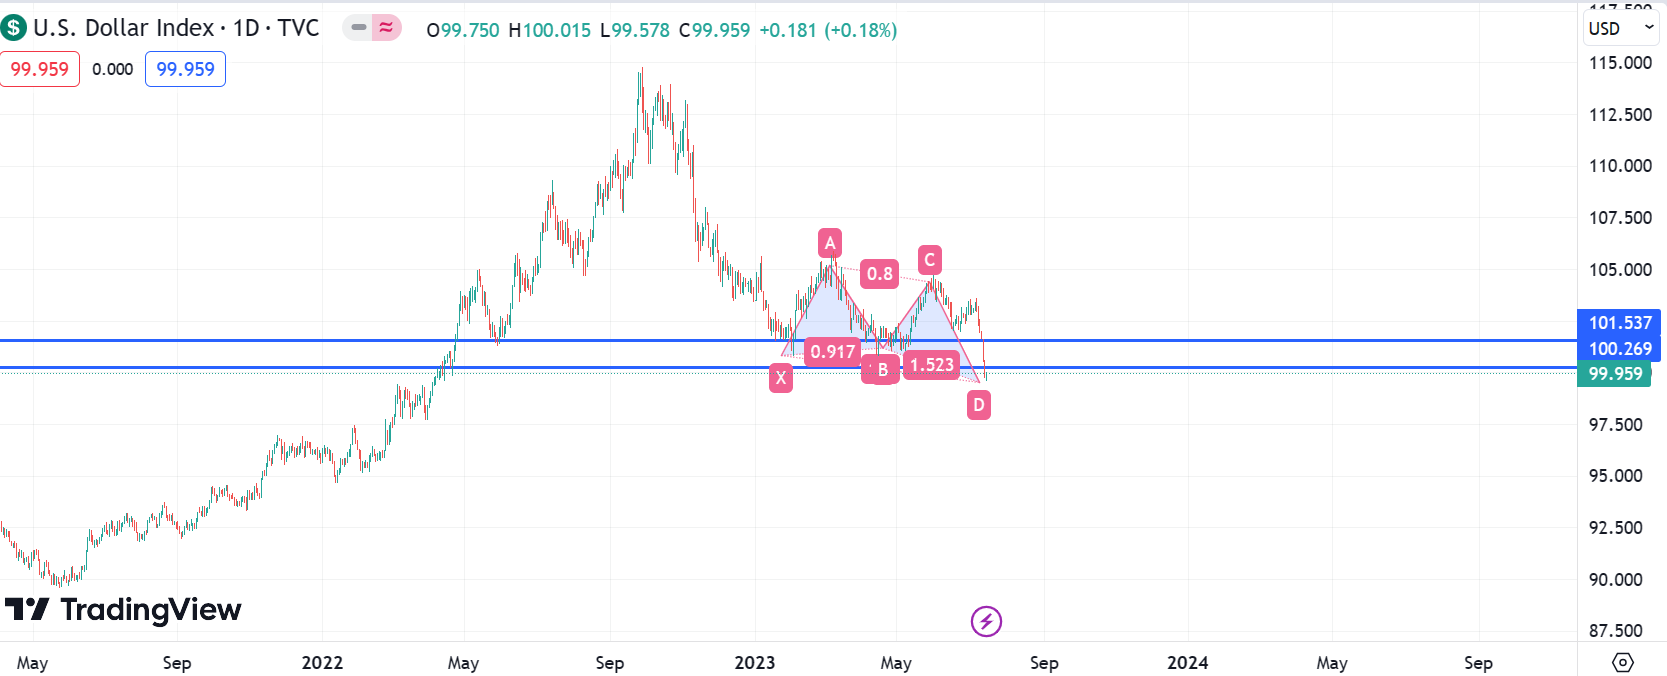
If this is a low in the DXY, this could be an ABC correction in an uptrend. We can draw a fib from the high to the low of the drop and use the extension fibs. First target a bit over 115.
I think a very important breakout might have been made last year. Looking at a bigger swing we can see we broke through a 76 fib and hit an 86.
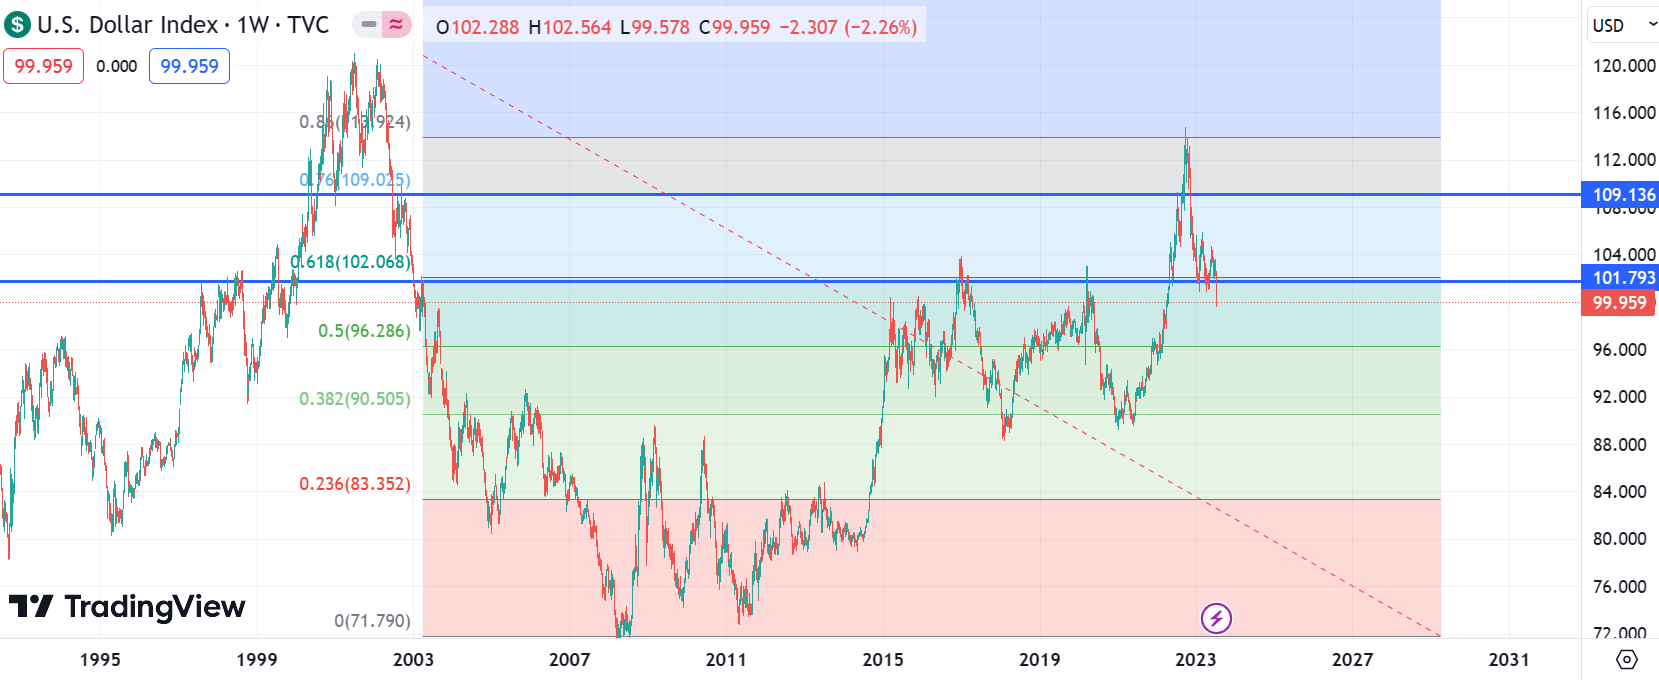
This can be a strong bullish continuation signal (Caveat on this is DXY is in a long-term range and it could just be chop). In the trend continuation signal we look for buys on the 76 retest (Here) and 61 retest. Under there, the breakout strategy has failed.
If bulls can make a low here, turning this scary crash action into stubborn rally taking out the last drop, I think we have a very strong case for a macro bull trend. A really strong one. We’ll have many great trades shorting EURUSD etc. If we break it, the steepness of the downtrend will probably increase.
We’re right into the support areas for USD now. Which way it goes at this point is still very speculative but I think the decision of this level will give us a strong indication of the monthly trend for DXY. Once we can establish this, we should have good trades whatever way it goes.
Bias is currently towards the reversal, but a break would be very strong and using good stops is important if fading the daily chart downtrend.