

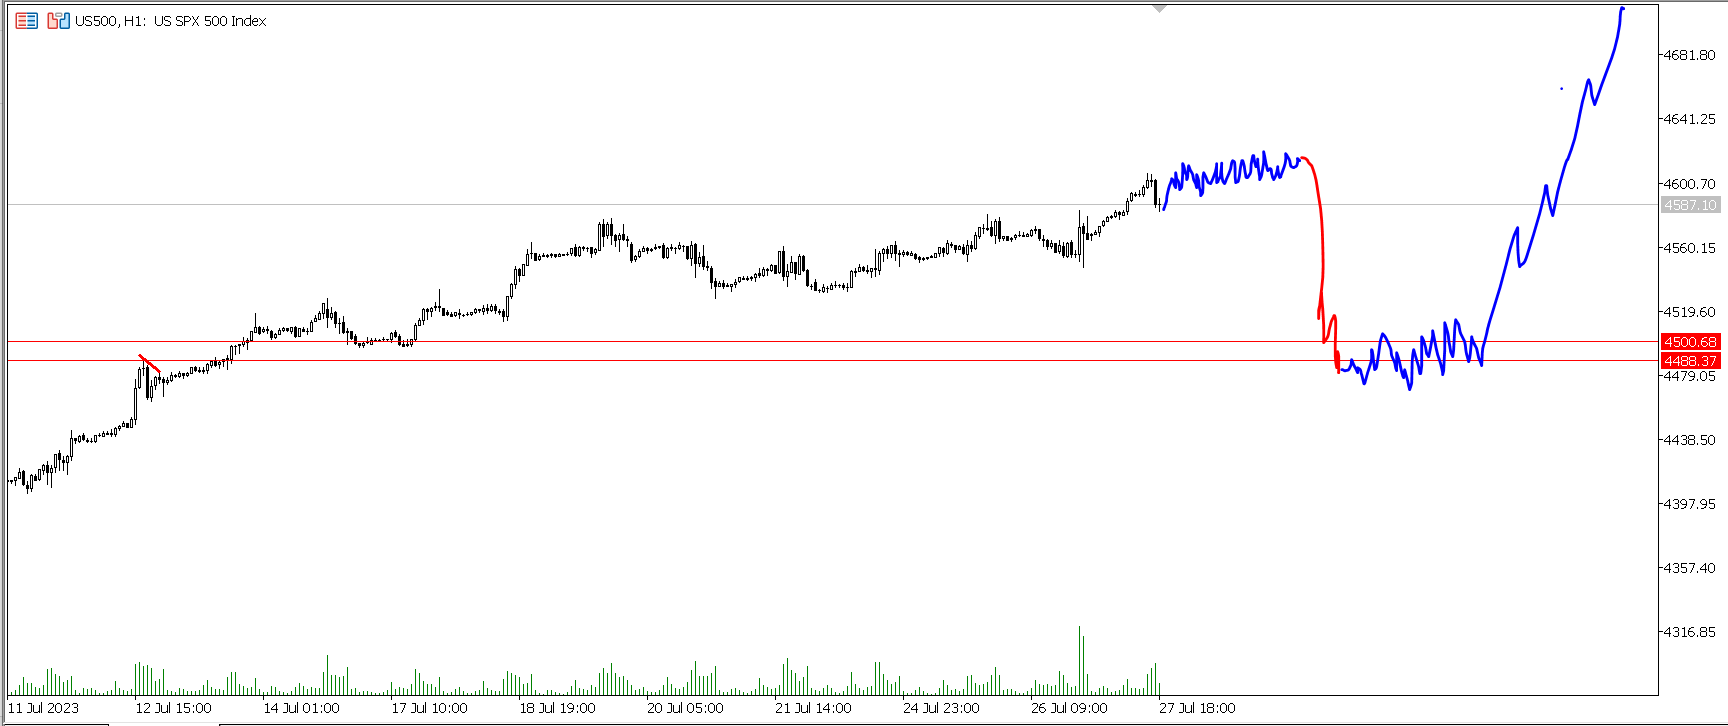
Maybe a flash crash coming.
Strong buy the dip around 4500.

We now have better agreement of signals on daily charts. All of them are trading close to resistance levels. All would be close to making bullish breaks but more likely to have sharp corrections. Usually we’d be approaching some sort of flash crash (At least on the 1 hour chart sort of scale) soon.
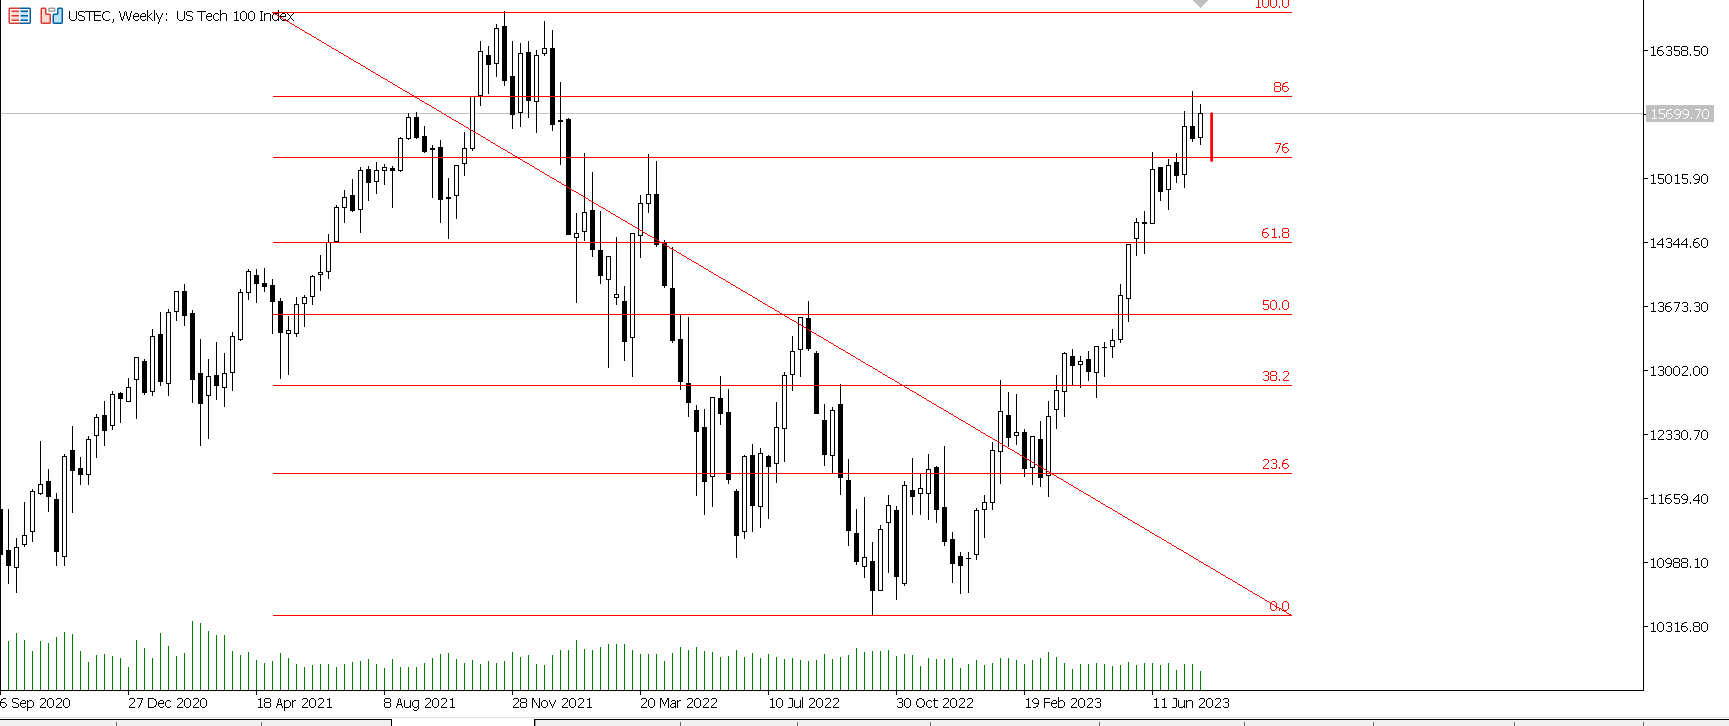
Nasdaq
Has hit the 86 and not yet retested the 76. 86 corrections can come off double top like moves. Nasdaq retest of 86 and drop to 76 would be the most likely move here as per the 76/86 norms.
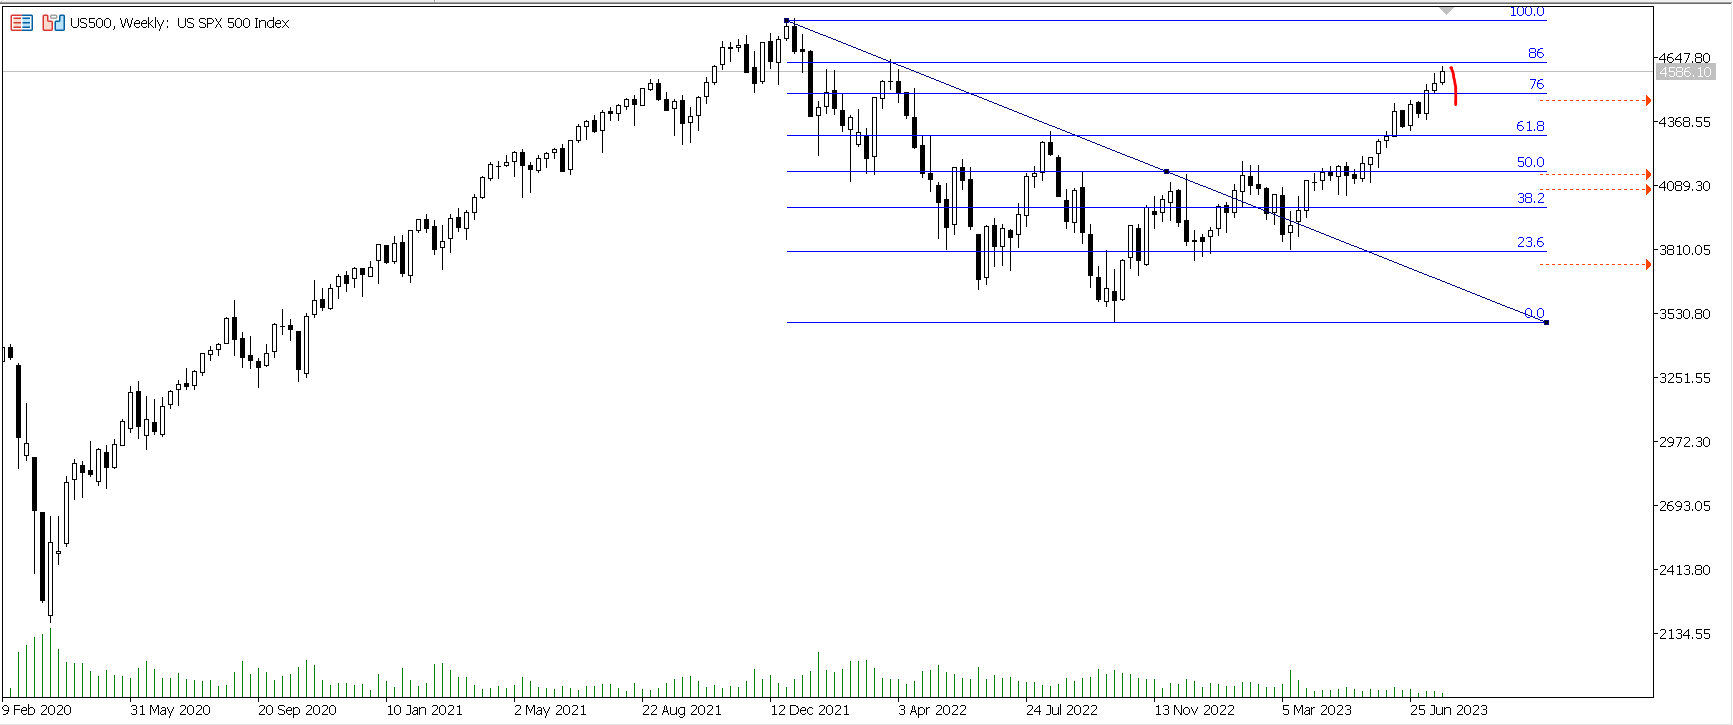
SPX
Is getting close to the 86 level. Usually signals a bullish break has been made but most often we will retest the 76.
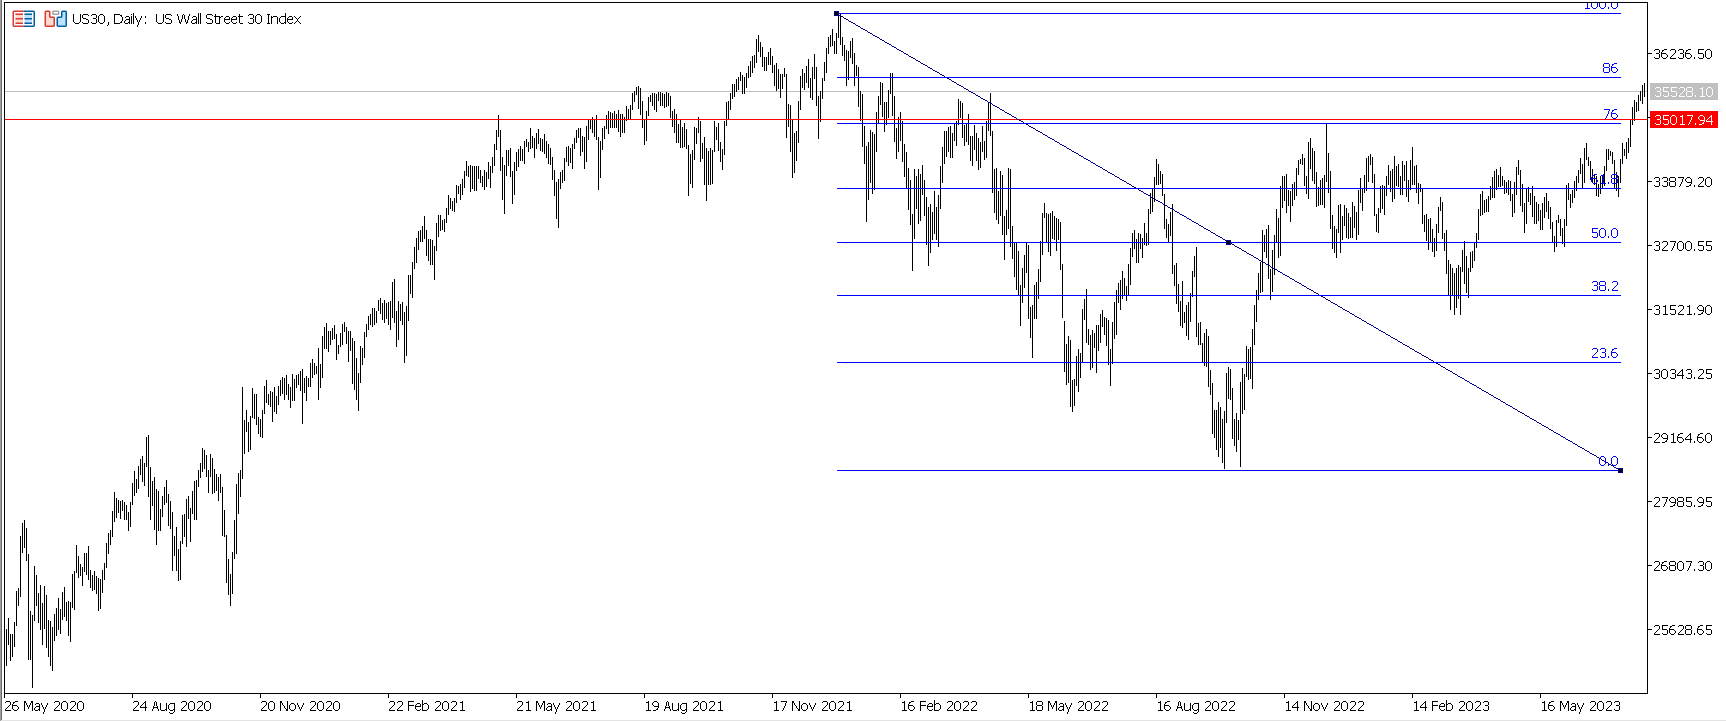
DJI
Similarly, DJI is close to the 86 with the same implied move.
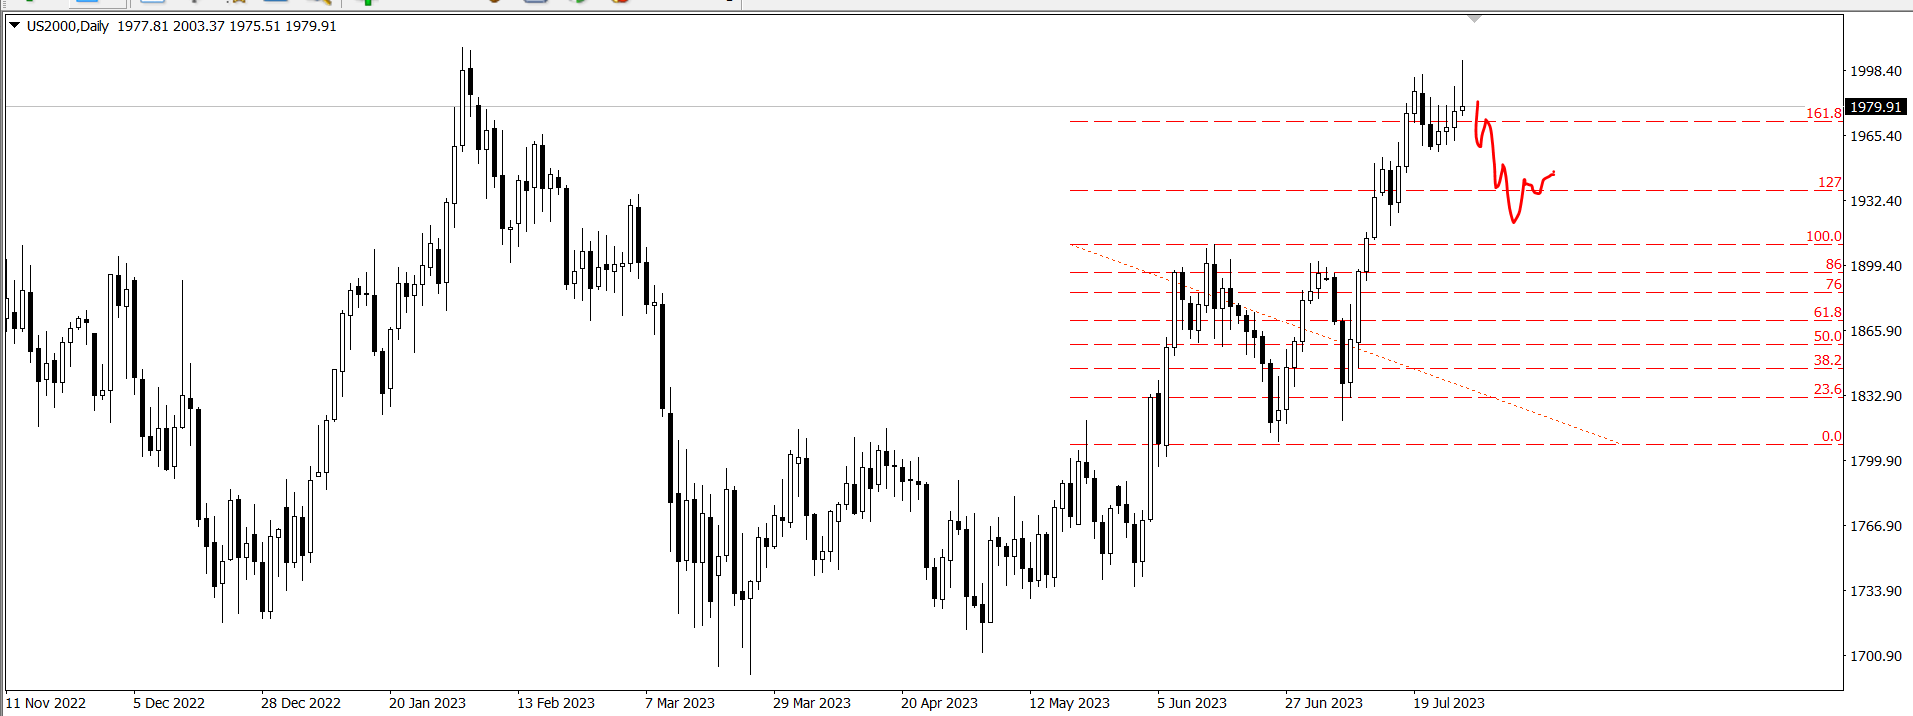
RUT
The odd one out since it is not trading anywhere near big retracement levels. Is testing a butterfly pattern. In a failed butterfly pattern, we often see false starts to 127.
In a grander scheme, these are flagging up failure of the easy bearish continuation trades and implying a spike to new highs is more likely. Short-term, often going to see a hard dump here to retest the break. The nature of failed bear levels is usually to overshoot them a bit and then sharply retest them.
Markets have sold off sharply over the last hour or so but I doubt this is a real high. I’m wary of buying this close to resis but I think this will end up going a bit higher and having more significant time ranging. There’s usually a lot of time to make mistakes before fast moves - bulls have not had any yet.
Prices could range at the high for a week or month and it’d be very unusual for them to not range for at least a couple days on this timeframe at a big 86 level. Bears are usually best to be patient. Initial sell-offs can easily be spiked out or at least the high retested.
If we drop from 4620 - 4640 down to 4500, strong buy area.
If 4500 is not good for buy, next buy level 4300.
Break under 4300 annuls bull thesis.
Break of 86 with no pullback would be very strong.
Strong net bull bias above 4490.
===
I do not think a big fast move up would be good for markets. A rapid rise of 20-25% above the last high is a very common way mega bubbles have popped. It’s starting to look like price is shaping up for this. An exceptional move up with shallow pullbacks would be a strong warning of a bubble fully maturing.
In the first legs of major bubble pops, the initial decline has always been a 50% crash. If there is a blow-off top, that’d be an initial SPX downswing from 6,000 - 3,000. Straight crash. No major retracements on big charts. Coming off a string of bull candles into the high.
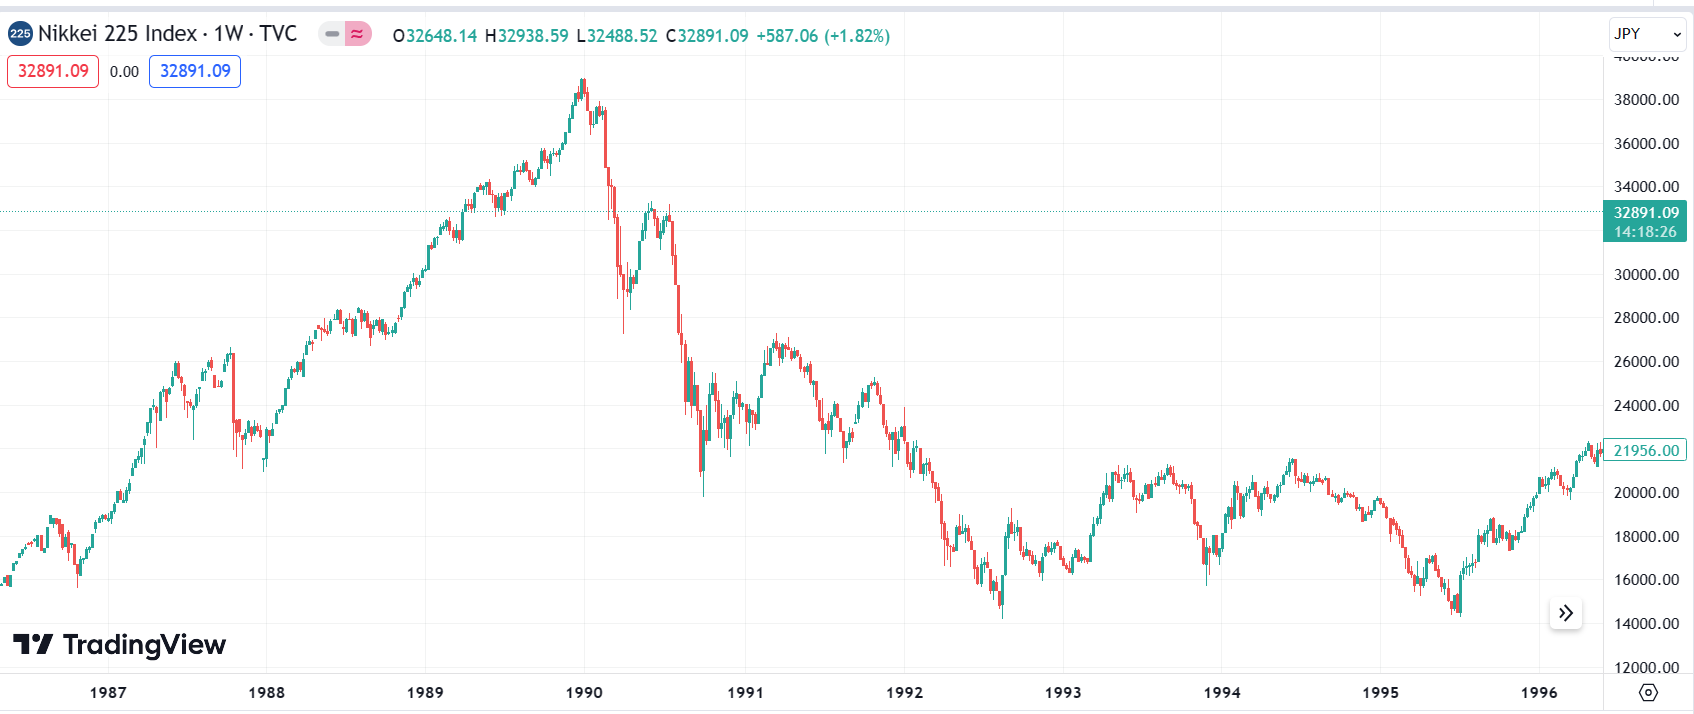
I suspect once such a crash was underway there’d not be a lot of time to prepare for it. So we’ll prepare for it early. Unless something significantly changes in markets we’re going to do a lot of stuff geared towards macro bear markets in the coming weeks/months, but probably be long most of the time while we’re doing so.