SPX Monthly Chart Bull and Bear Analysis
Support and resistance levels, macro bull/bear analysis and current bias/positioning.
SPX Swing Analysis
18th September 2023.
Time Frame Used: Weekly /Monthly
Overview
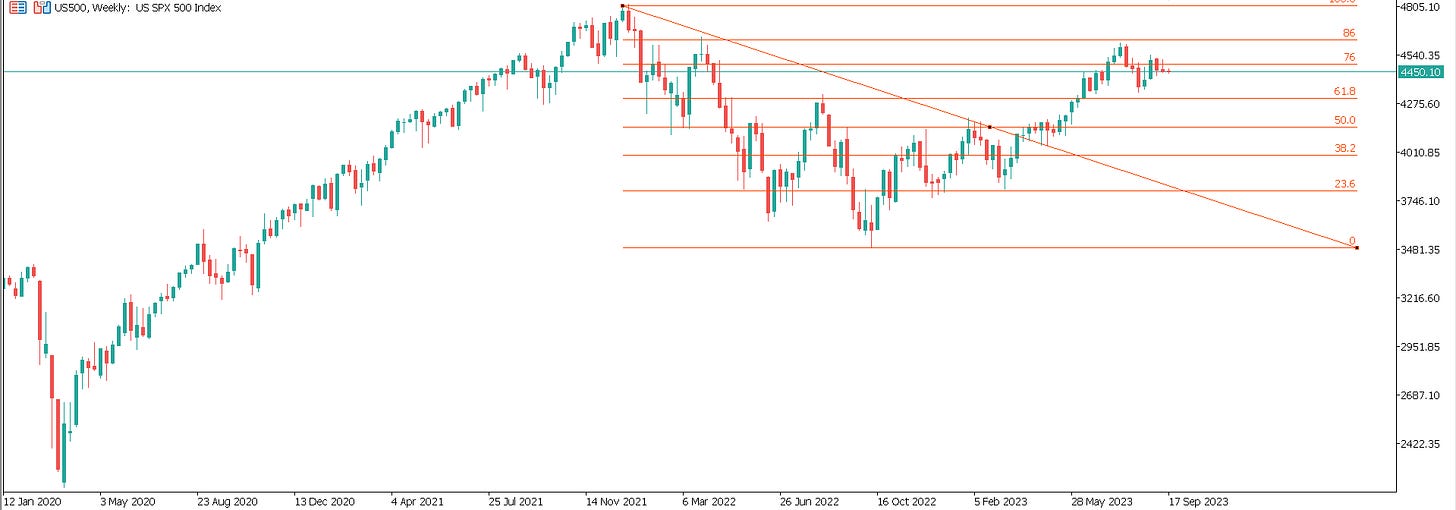
For the better part of 3 months SPX has traded in a range inside of the 86 - 61 retracement fibs of the 2022 drop
.This area is so often the big decision point. In bear moves the 76 can not be broken and when the 76 is broken we usually at least have a spike out higher. We currently trade right under the 76 fib. Usually whatever comes out of this is going to be a strong move. A 76 rejection sets up a big bear break and the 76 - 86 break sets up new high.
At this point it’s really too close to call. This can go either way. Statistically the odds heavily favour the bulls here. About 3/4 times this would be the case. But statistics are highly misleading when it comes to individual events. Even something with only 1% chance of happening is statistically certain to happen once in 100 occurrences.
I think for various reasons the current edge remains long with tight stops and only taking bear trades if we break. Be well prepared to adjust quickly (Breaks can be fast) and be aggressive in targeting for bull trades, because if they do work it’s likely they will work big and fast.
I never like to speak in absolutes but I think it’s as close to a sure thing as we get in markets that we’re going to come out of this 86 - 61 fib range strong. Whichever way it goes it’s going to go fast and pick up momentum. Some of the most explosive moves in SPX history (Bull and bear) have come out of this zone.
If this range breaks to the downside we’re probably going to see 2022 low breaking. This would strongly indicate a crash would follow sometime not too long after. A break to the upside could imply various things but the weakest expected move would be a spike to somewhere around 5300.
We’re in the quiet before some sort of storm. It’s just very unclear which type of storm it will be.
In this analysis we’ll weigh the bullish/bearish cases. Provide primary and secondary trade plans. Major support and resistance levels and real trading signals. We’ll also look at the worst types of moves for the strategies we are using and the conditions where we’d want to sit out and wait for things to get better for our strategies.
Keep reading with a 7-day free trial
Subscribe to Market Forecasts and Trade Plans to keep reading this post and get 7 days of free access to the full post archives.


