

Starting to Look Rather Rough.
Plans for further downside breaks.

Indices don’t look great and crypto looks terrible. The case for us breaking supports and making a strong move down is improving.
Multiple things suggest crypto is heading into a crash event. Various different setups would have the asset in question heading into an area where we usually see free fall action. There a good case to be made if crypto can make the next break it will be a crash event. Sharp down to next supports - probably signalling a larger break.
SPX has closed not green four days in a row. Who’s heard of such a thing?

It does intuitively start to feel harder to expect strings of red days, but they do actually happen in breaks. And they’re actually often extremely bullish in stages.
The above action can build this sort of chart on daily.

Go have a look at breaks and crashes, you’ll probably find candles like this. The big body candles then the wicky candles. Those wicky candles were probably trading up mid day and then went into a slam late day. We had a pattern like that yesterday.
The price action we currently have on the daily is more like a hanging man crossed with a pin bar.

It wants to be a hammer, it almost was but the late day selling spoiled the look of the pattern. In cases like this and in cases where it actually closes like a bullish hammer I find IF you see in the following day a big engulfing candle breaking the stop loss zone of the pin bar (like) signal this is often a firm indicator of further trend continuation.
When we’re talking about this in a big chart sense we’re probably talking big weekly candles. Failure of a a big chart trend is a big deal. But this rule is common to trend breaks. If you’re following an uptrend intraday in a stock or forex or something and it pin bars off support and engulfing candles though, often the trend is changing.
Tomorrow being a big down day would seem significant would be the sub text of that.
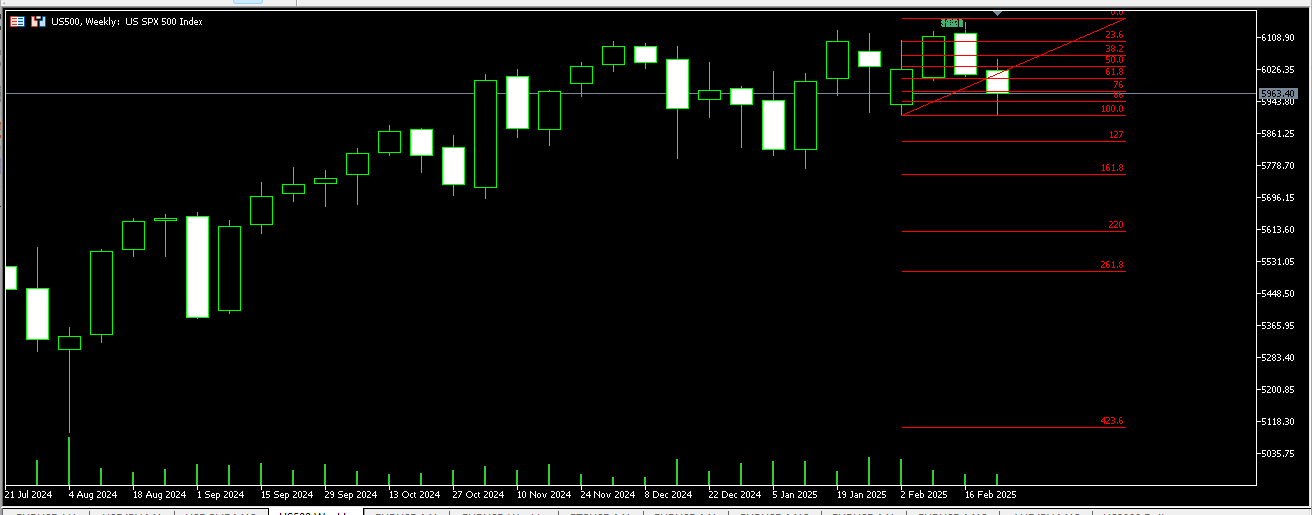
SPX had its first technical trend failure. I almost cringe to talk about this in a 4 month range because it’s always been a failed signal if used recently - but if we’re heading into a trend, this is an important first signal. The common level for a bullish recovery has broken at the 76 level.

In the style common of a break. Sharp move to 86, retest 76 if the 86 breaks again this usually drops hard.
The wick candle back to the 76 looks bullish, but I can assure you as someone who’s tried to buy/sell every 76 I seen for years on end and used to think that 86 reaction was helping me - it might not be bullish. If it’s not bullish, it’ll be pinned by the recent fibs and then slam to a new low.
We have enough swings in now to map out a really good idea of where the key downside levels would be. We’ll get to that a bit later.
For now the key points are we have what looks like a break of support. A pending retest. New low would be strongly suggestive of downtrend.
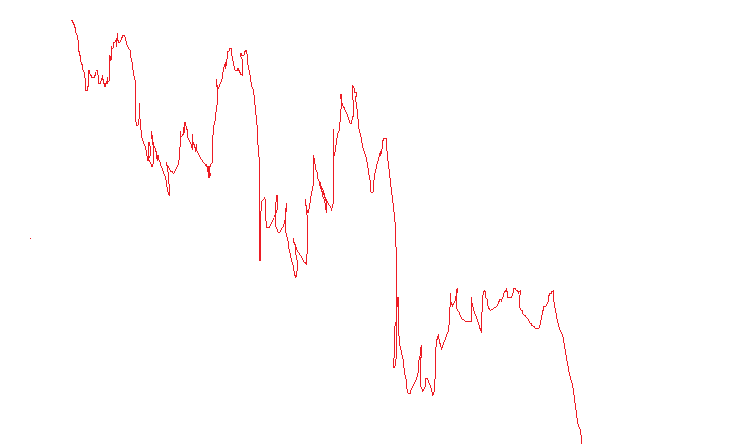
If there’s a big daily break, there can be strings of bear candles - but this is not to say there will be outright capitulation.
If a capitulation setup in indices is coming it’s likely going to be this sort of format. Intraday.

With a series of lower lows and deep retracements. These retracements perhaps getting more shallow but there generally being a feeling of getting in a rhyme of the same thing. Maybe Asia/London selling, US rally late US sell off. Starts to feel fairly predictable. Makes people reluctant to hold shorts into breaks.
Then whoosh. Move doubles what it had done previously in a few candles.
So in that sort of thing we’d be looking to see action like this intraday.

Seeing this would be significant in my option because this is a legit downtrend pattern. These ideas of a bounce on the 2.20 fib to spike out the 1.27 (and or fill 76 retracement) were strategies I learned trading persistent downtrends in Aussie Forex pairs. I later found understanding Elliot helped a lot with these levels.
These are downtrend patterns. Significant, because SPX most often moves down in sharp moves that end up being corrective. SPX does not trend down very often on 15 minute charts. A downtrend with lots of corrective rallies inside of the last leg can be progressive and sustainable - on this timeframe, it builds into a crash like move.
If these downtrend patterns continue to build, the end result is going to be big bear weekly candles building a big red monthly candle.
So we should look at the levels that could go to, right?
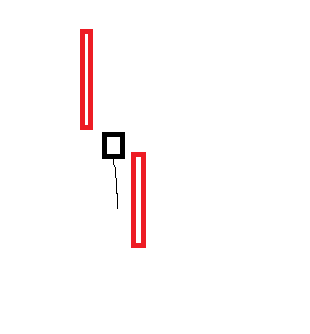
So we have a pending double top.
As a standalone pattern I consider the double top untradable. I don’t really even recognise it as a pattern in real time. The nature of a trend mean there has to be so many instances there’s a possible double top/bottom that it becomes statistically unviable to expect to win overall after hitting the optimal trades.
On an honest brutal assessment, the pattern can’t be traded successful as a standalone pattern. It can help at major levels, but it also will tend to appear in most failures of major levels as SR. It’s something I never bet on - but when we dooo have one, then that can give us a lot of insight into what may happen next.
Because every single time there’s a double top / bottom and the trend structure breaks, we have to have a W or M. And W’s and M’s are gifts from the TA God’s.

Here we know the bull variant of the pattern is something like this. In day to day trading I will use this in many ways. I’ll use it as a trend continuation pattern if I am bullish. Or as a early tell of a break from a high or from a correction if I am bearish and I’ll also use this as my trailing stop level for bull trades if long.
Be it long or short my thesis here is always if the move is a correction, it’ll end around the 1.61. If not we usually move quickly to at least 2.20 and we might be heading to 4.23 - or further, I don’t know - I’m bailing on 1.61 breaks.
A 1.61 break can be a choppy affair.

The above chart would actually also suit the head and shoulder rules. Maybe with a bit more of a spike.
Sometimes 1.61s just break but this would have to be news.

Either way, the breaking of the 1.61 here is SIGNIFICANT.
Don’t make me pull out the 2007 chart.

2007 was what I’d class as a fairly common 1.61 break pattern. This was the first fib pattern I ever traded. If the 1.61 breaks, wait for a spike out of the 1.27 and then get in targeting 2.20. For a while that’s literally I did and I made money for so long as trends persisted - and this looks like a simple expression of that.
Very simple thing to map up a like for like on.
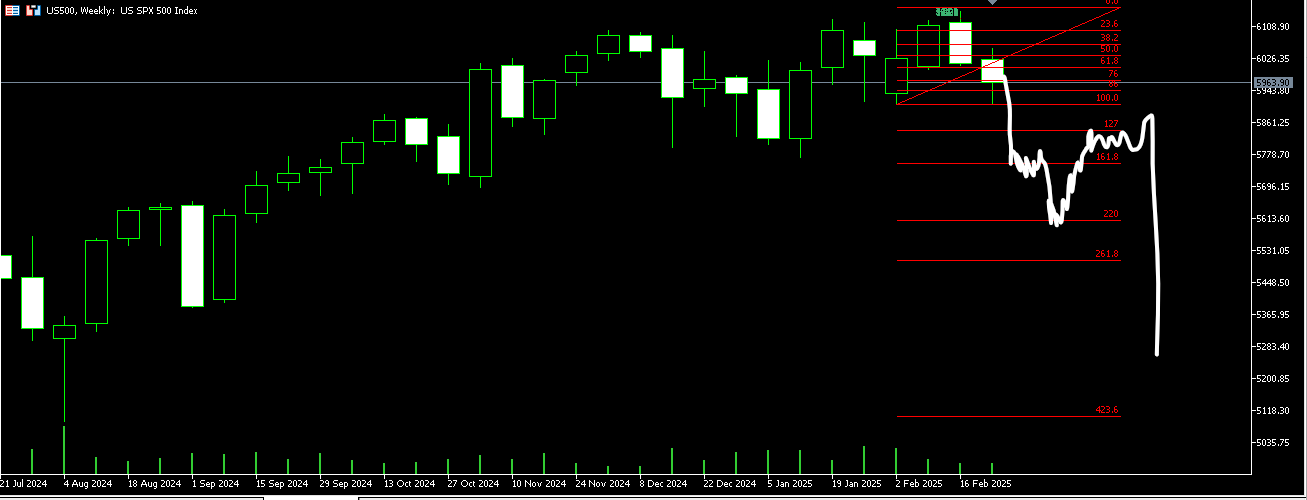
Hypothetically, if we had the same type of butterfly break on a WEEKLY CHART (Yes it warrants capitals, butterfly breaks are big deals on 4 hour charts) the implied full break plan would be fairly simple.

SPX just traded through the fibs to the 4.23 in 2007. 4.23 didn’t hold as a low so we go big sharp moves under it.

That’s really quit easy to estimate.

And would be well evidenced for the moment it was optimal to try to bet on the big break. If we see the 2.20 and then we see the spike out of the 1.27 then we know we can make the extremely ambitious bet that the lower fibs will hit. These will be cheap and they’ll be hyper rewarding.
I previously spoke about options with an analogy of accumulator bets in sports. These really are the only time I’m interested in options. Where I feel like I know if I am right, I am right in a big candle. That it may be statistically unlikely what I bet on will happen but if I am correct on direction I will also be correct on style and end price.
The butterfly break setup would be a very strong version of that. We’d know if the big butterfly break was coming we’d capitulate to the following fibs. Giving us entry into a rally, optimal strike selection, increasing IV after we take our position, a reasonable presumption if we’re right it will be fast and a plan to exit on support during capitulation - which means we don’t just get paid for the move we traded, the big IV means we get paid for the next move people think is going to happen, but won’t.
Would be a good opportunity. Something we can look for markers of along the way.
For now here’s the critical points:
The thesis is SPX is in a downtrend. Specific and important. It means we’re are super bearish but it’s entirely contingent in the holding of the general lower high structure. We expect retracement inside of the last leg. Accept there will be occasional two leg spike outs - but we have very little tolerance for anything outside of that. We are super bearish with the thesis we’re in a strong developing downtrend.
If this is right, being bearish would get easier. It getting a lot harder means get out and we can reconsider after.
We are expecting a lot of big rallies inside of the downtrend. As thing stand we think SPX is at the top of a correction and if the high is made the target is 5820. If 5820 hits, we think it’s highly likely we retrace most of the drop. We are looking for a zig zagging downtrend.
Be aware in those conditions the most optimal of entries tend to lose 70% of their profits in the pullback, anything else goes red. Trail stops at 2.20 fibs.
In the event we see a sloping off of the market in these big dramatic breaks, sharp ABC correction and then a repeat of that - we’re going to have a serious chat about positioning for a significant downside move.
Given we have a weekly chart butterfly I do suspect if there’s to be a big break it won’t be for quite some time. This break would go to somewhere around 5500 (2.20 of butterfly) and then we’d bounce. There’d be some chop on the way down and a lot of chop in the up move. We’re talking weekly candles here. This could be months.
In the context of the butterfly synced with other stuff (Mainly the macro 4.23 being 5500 also) I think the crash would probably not be this year. This year we’d see a sharp move down to the 5500 level. This would be a persistent downtrend with rallies until it began to just dump. 1.61 - 2.20 would be sheer panic selling.
Then an abrupt low and big bull trap with all or most of the advance to a high happening really quickly and then a long period of ranging just off that high before starting to down trend again (Recent BTC is a great example). Which would mean great bear trades for a while. Totally epic bull trade.
Then tricky market. Could go on for some time but some time during this would be the optimal entry.

Essentially zero chance that would complete before late year. Would be in winter if it happened this year. Two really good swings and then a theta market for swing traders for several months. During that time would be the ideal time to be prepping for the big bear break and the optimal trades to make in it.
Major immediate level 5820.
Next level after retracement 5650.
Probably retest 5900 from there.
If the break is coming, those are the swings to make money in. Then chill. Maybe sell some options. Scalp a bit here or there - but realistically if those swings hit there’s a far bigger prize potentially at play and that’s what to focus on. Wait until those chasing breakouts to both sides get frustrated and then slowly build the crash bet.
Local high high and 5830 hitting are next required swings in this pattern.