Supportive work and trade plans for a 2007 style market.
What if it's neither a new bull market or impending crash?
Recently we sent out an update in which we explained the failures of the classic bear market patterns. How our recent breaking of 4100 was breaking the 76 and invalidating what we’d expect to see in a bear market rally. Read more about bear market rally norms here.
Understanding the bear market rally. - by HoleyProfit (substack.com)
I feel the basic bear market rally rules have proven their worth through 2022. Almost invariably we were able to generate short signals into the highs of bear market rallies using the 76 rule and we also managed to escape from shorts early in the rallies using the failure of the 76s. With that in mind, it would seem foolish to overlook the warning implied by the recent break (Which is by far the biggest bull break in the last year).
In this piece we’re going to do some revisions of the primary plan and look at what sort of move would develop if we were in a 2007 style market. For context, the 2007 market was the end of the bull market, but we still made a new high relative to the previous one. We’d be set to enter into crazy swings if this was so.
Harmoncis into highs
A considerable amount of time ago we posted a 2008 style model and raised the issues we had with this being a 1:1 model for the current time. The full post can be read here but to jump to the main point we’re covering here we explained how anyone looking for a true repeat of the 2007/2008 move would not be expecting a crash, they’d expect a nominally higher high.
I’ve never seen this mentioned in any of the 2008 style forecasts I’ve seen. All of them post charting implying this type of move.
But of course, that’s not what happened in 2007 /2008. You can see it right in front of you. The market ran up and spiked out the high. I’ve always had a gripe with this, but since I posted my first version of models of a potential market crash based on historic ones in 2019 and got a lot of flak for it, I was just happy everyone else had gotten on board with this concept of analysis.
Many people started to make this like for like observation when the market was down in 2022 - but a chart geek who looked at all the previous crashes could have had this in mind for a considerable amount of time before. In December of 2021 the first post we did for the “Beat the bear” newsletter went over how a general repetition of old market crashes has been happening since 2000.
Different ages with similar crashes - by HoleyProfit (substack.com)
What really happened in 2008 was there was a dummy sell-off and then the harmonic spike into the high. Anyone who trades reversals as their bread and butter (And is aware of harmonics) will know this happens a lot in day to day trading, a big expression of it in 2007 was not unusual for a top.
This was not a one off thing, the exact same type of spike out move happened in the Nasdaq before the 2000 crash.
And as such, it would not be wise to overlook the chances of this happening again in the current market. This is what our recent posts speaking about nominal new highs have been based on.
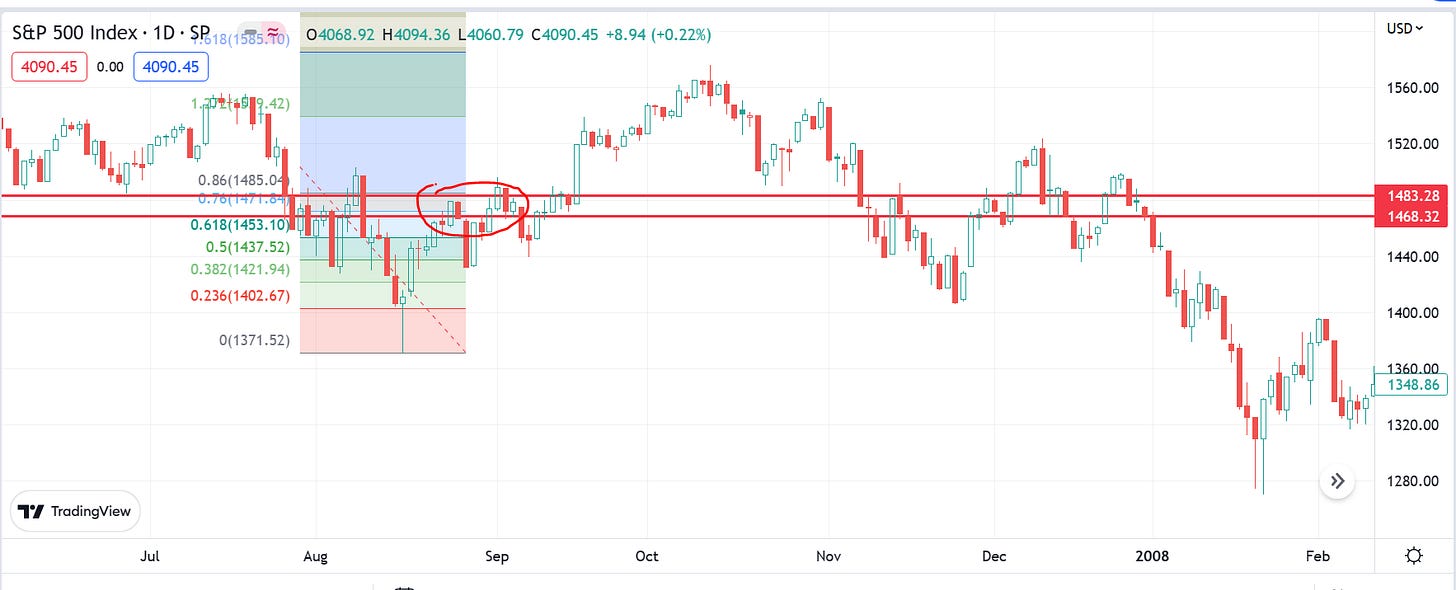
Looking at the failure of the bear market move in 2007.
Side note:
By the way, whenever people say, “No bear market has ever ended with …” - Absolutely all the points they raise are untrue when it pertains to 2007. 2007 bear market ended with the VIX around 20, with no major capitulation and all the other things people say - people entirely overlook that in 2007 there was a bear market that failed. We do not talk about the “2007 bear market” - people only talk about the 2008 bear markets. Wen you discount the bear moves that made new highs, then the “No bear market ended …” narrative fits. But only if you ignore the false signals, which is not wise.
The failure of 2007 bear can be broken into three sections (All of which are common to the failure of a down-move).
Starting from the low:
We have a false breakout of the last low. I’m sure this would have been a time of mass expectation of a crash. (Shown with highlight).
The market rallies, pulls back and fails to make a new low. First big bear trap. (Shown with the short red line).
The market spikes out and bear traps again. Again, it fails to make a new low. At this point the bear has failed, but it will take a while for that memo to be delivered. (Shown in short blue line).
It really does not take a charting geek to see the similarities here.
If we look for where we’d be if this move was repeating we’d be either in the blue circle or the red circle.
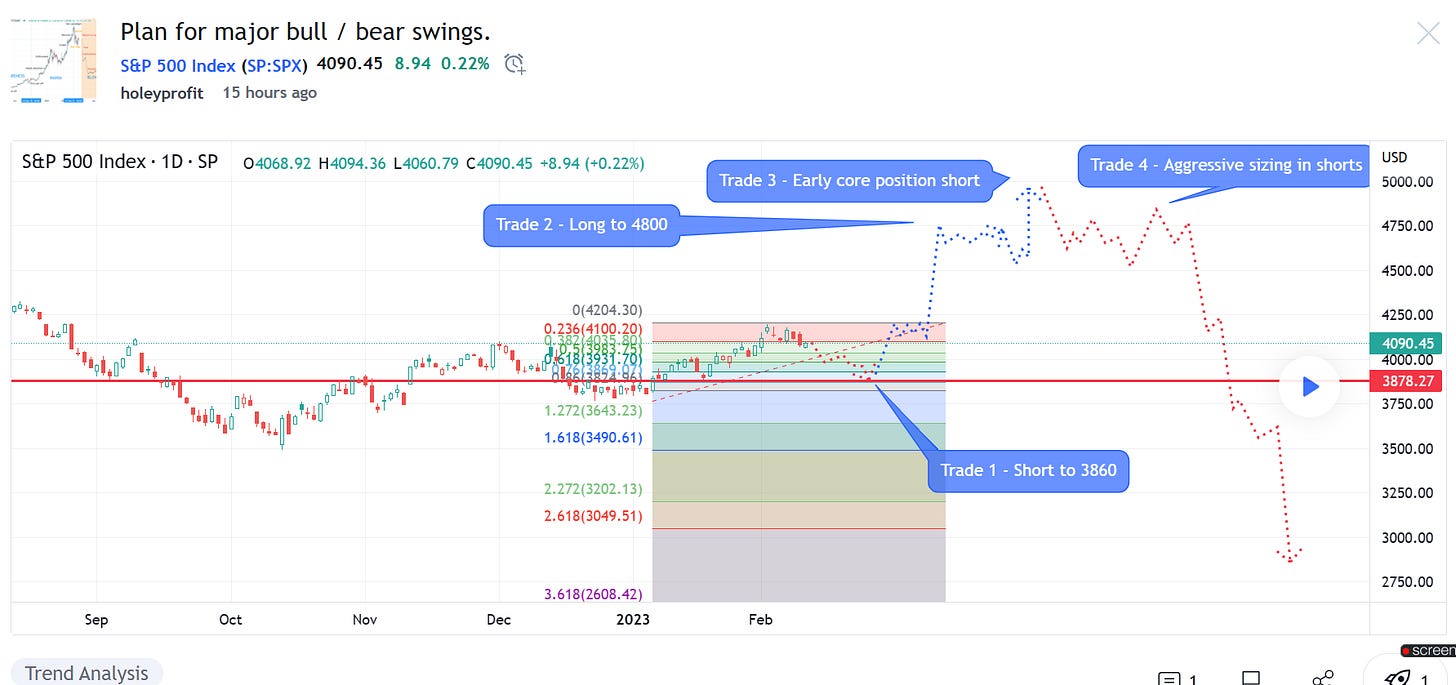
Here’s a plan posted for if we’re in the blue section. We’d be due to retrace the recent rally. Fail to make a new low and the bear market (For now) would end into the next drop. We’ve already posted trade plans for this.
And this above forecast is the possible revision mentioned early in the post. In a previous post we’d said if 4000 broke we’d be back in the bear camp. The revision for this now is if 4000 breaks we’d be short but' we’d only be targeting 3860 or so. Under 3800 is required for the bull to fail at this point.
This would seem a fitting move since it would catch a lot of people off-side. Bears would jump into the drop (And boldly short the first rally) and those who’ve been accumulating longs for the last months will see their trailing stops hit and be kicked out before the real long trade comes.
However, if we’re in the red circle, this is our implied move.
These are not just random squiggles. Let me show you the logic behind the levels and forecast here. The first failure of the 2007 bear would come when the 76 broke.
First there was a bear trap and then the second leg broke.
It’s the same picture.
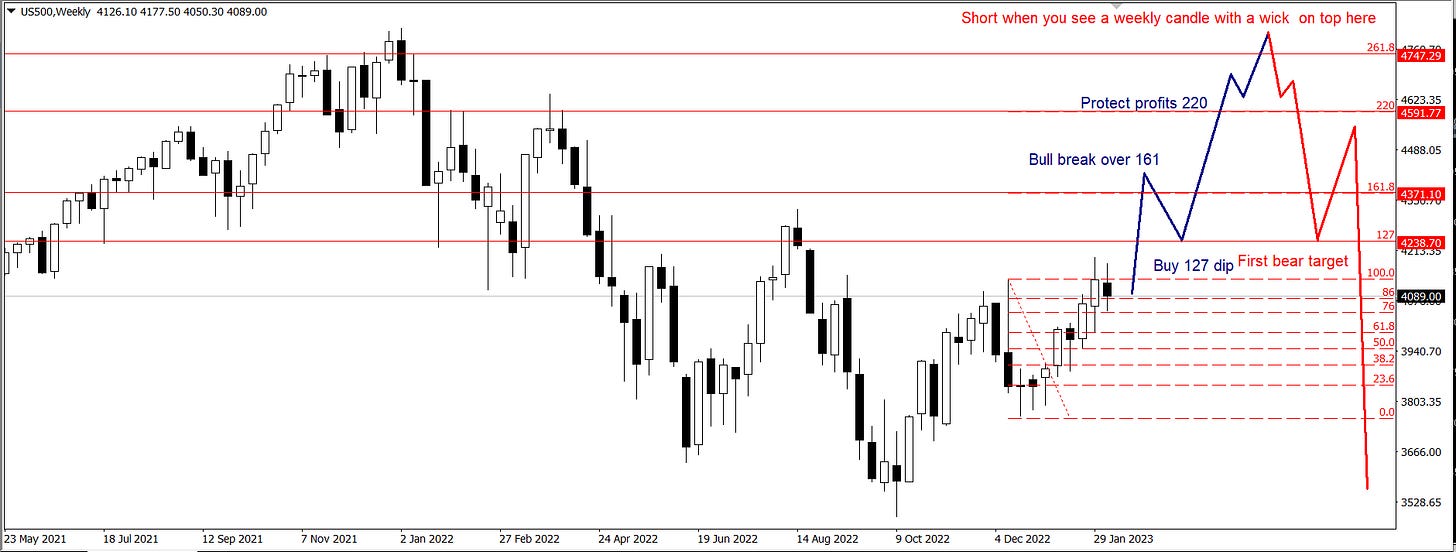
In 2007 all you’d have had to do was draw a fib extension from the high to low of the pullback and it’d have given you the actionable break/supports/resistance levels for the move to come. In blue are the levels/targets of the bull move and then in red are the bear entry levels.
We have a slight bit of indecision since we have the possible imminent breakout or the big 3800 bear trap, but either way we can already define our trading zones to within a very small margin of error. Either the above forecast given, or something like this.
The highlight is where you’re going to see the bears getting hammered if this move forms.
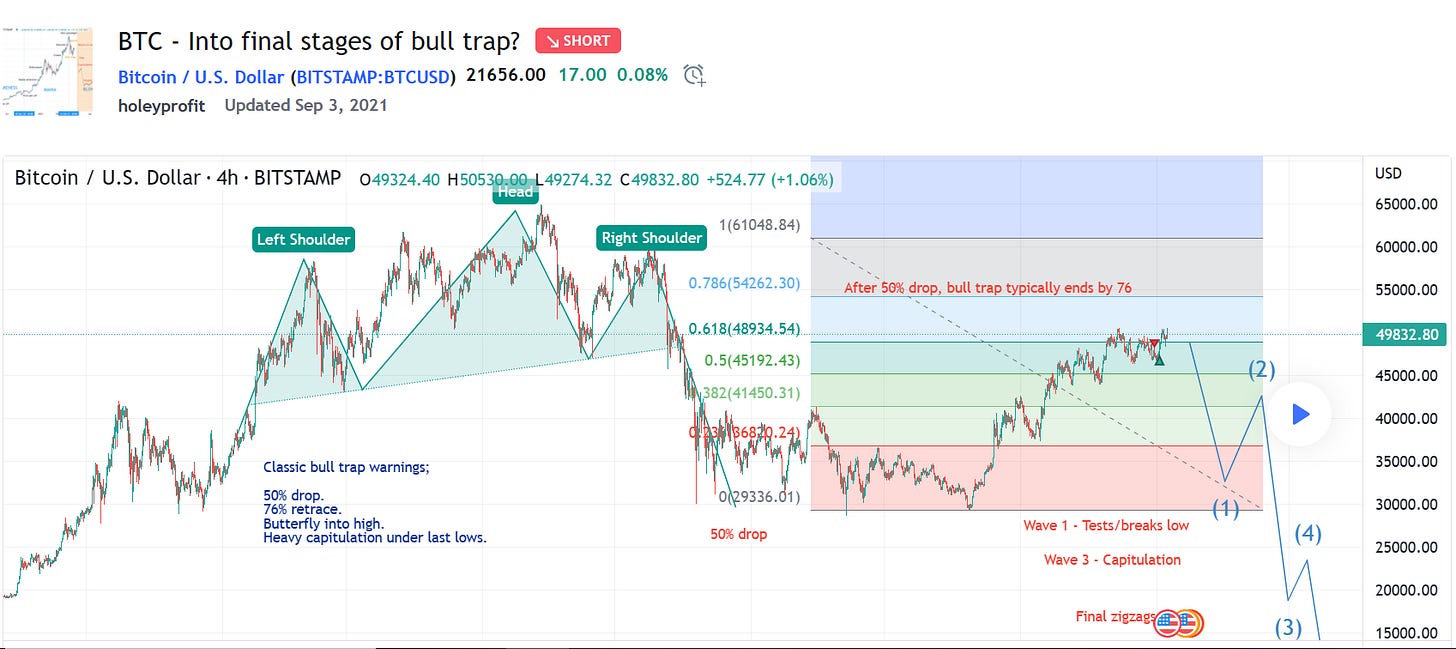
This is where you’d have seen me getting hammered if not for me having learned the hard lessons of this risk while trading the BTC “Bull trap” that was actually a bear killer.
I spent a lot of time going over my mistakes in this move, and I’ve not forgotten. Lessons from BTC tops. - by HoleyProfit - Beat the bear. (substack.com)
Primary bias at the moment is long. We’d put out a short forecast for the 3800 move but upon further review (After sleeping, a lot of the previous forecast was done in the early hours of the morning and upon review today I feel there may have been some errors) it makes more sense at this point to be long and just be ready to ditch the longs as soon as we see any trouble and pivot short to 3870.
As I hope everyone knows, I am not a headline guesser. All my work is TA based and my opinion on the news has no value at all because I’m not even trying. However, a big strong swing is implied here. If I was to take a “Chatting at the dinner table” style guess, I’d say the CPI comes in optimistic and that causes the rally that breaks the 161 of the first pullback. Conversely, CPI coming in ugly fuels the 3860 crash low.
News being news, CPI can come in wonderful and drop or horrible and rally. To allude the “Big Short” film, 2+2 = fish. Please do not put any substance into my fundie based guesses, they are only based upon the expected price swings. I have no idea what will happen and am not trying to make accurate news forecasts - these are just points of note which would be obvious after the fact.
Here is our primary trade plan.
Markets will be fast and there may not be time to write up long-form adaptations to trade plans. We will post real time updates on Twitter.
Follow HoleyProfit for updates on intraday/week price swings.
Follow Dean Black for exclusively bear swing forecasts.
Things that trigger failure of plans and need to review:
Breaking under 3800. That wrecks all these models. If that happens, I’ll be confused and it will be a total rework of analysis with fresh eyes.
Breaking the 161 to the upside and not holding the 127 (With some spike out tolerance). Would imply failure of the nominal high rally and need review.
Market breaking over 5,000. Any new high should be nominal. If we do not reject the attempted run to a new high, the bear thesis proposed has failed and needs review.
The bat spike out thesis makes a whole tonne of sense at this point. While it’s always best to approach the market with varying degrees of uncertainty, this looks like a very probable outcome. It’s a blessing or a curse depending on how you deal with it. For the average bull or bear this is the max destruction move.
For the prepared speculator - these are the time you thrive.


