

TA Patterns and Levels on Oil

Given the news of the weekend of trouble in the Middle East there seems to be an elevated chance of volatility in oil. I’ve been meaning to do a TA post on oil for some time. This is probably a good time to do. Note, everything in this forecast is entirely TA based. News could make oil volatile, that’s as close to a fundie analysis as this gets.
Filing this under “Bear Market” analysis since rising oil prices can have various knock on effects on things like consumer spending and inflation. So it’s maybe relevant. Or maybe not. I just needed to pick a section to file it under.
Oil and Fibs
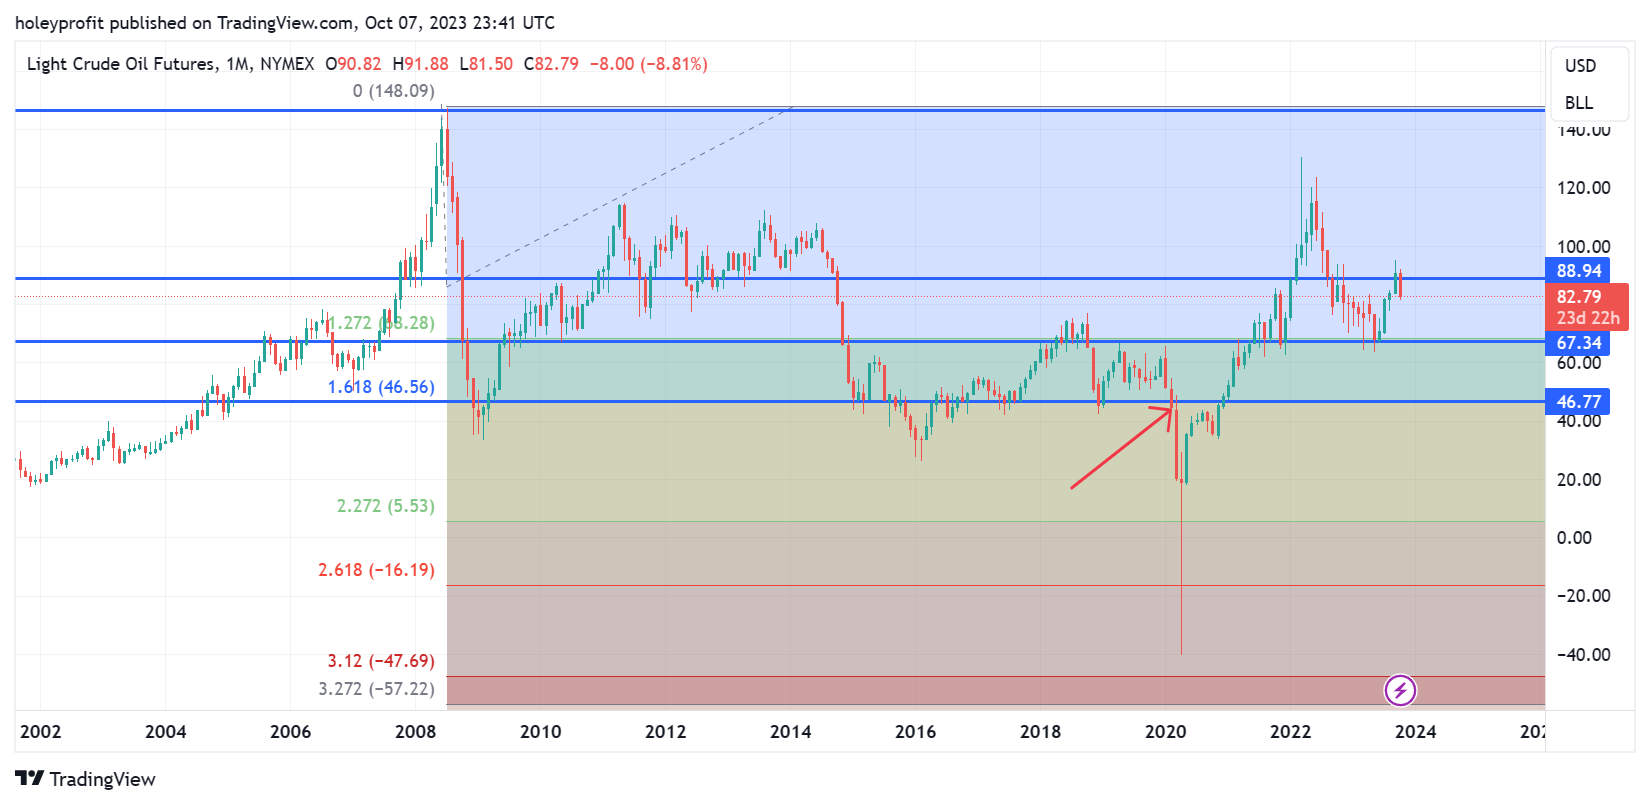
The implied bull levels of this analysis would be far higher than the ATH of oil so to find lend some credence to the use of fibs with oil, let me show you some historical stuff first. In 2020, oil went negative. Which I think we can all agree, was an exceptional event.
This move was preceded by a crash in oil and then a big bull trap. If we fib low to high of the bull trap, the low comes in at 1.61.
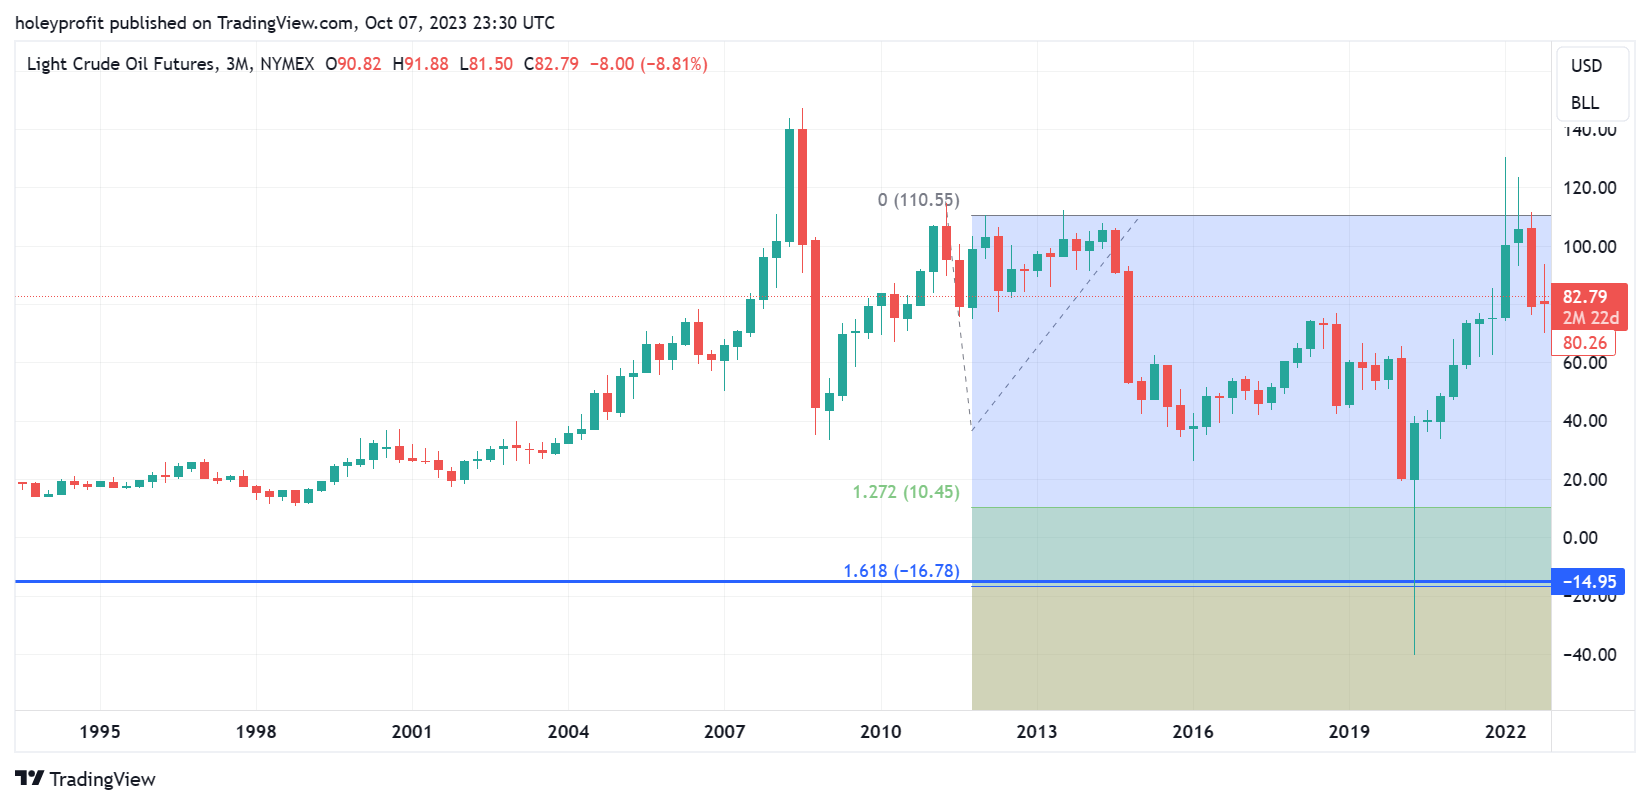
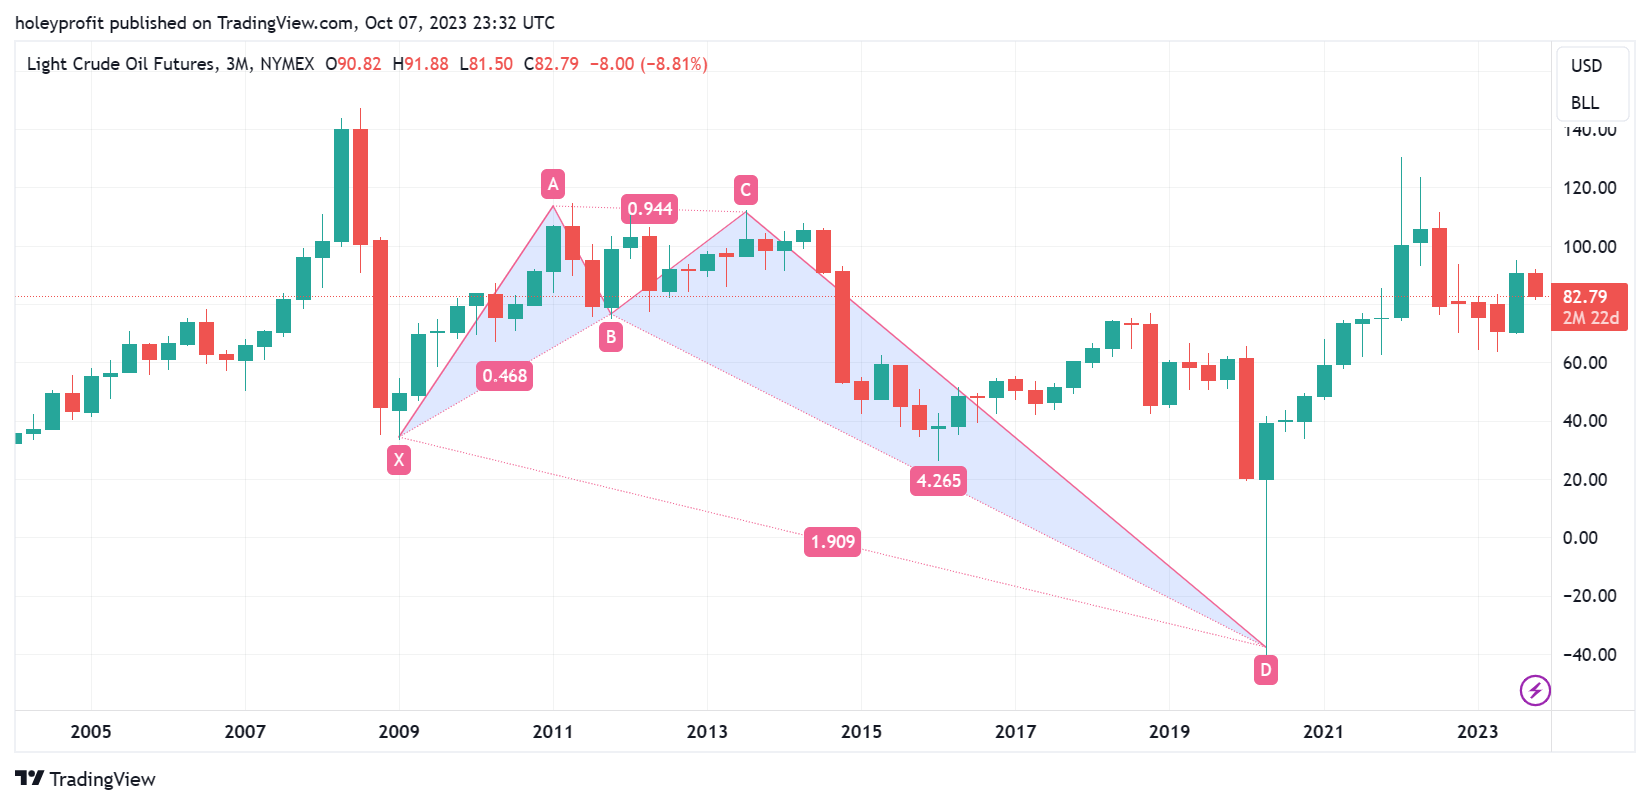
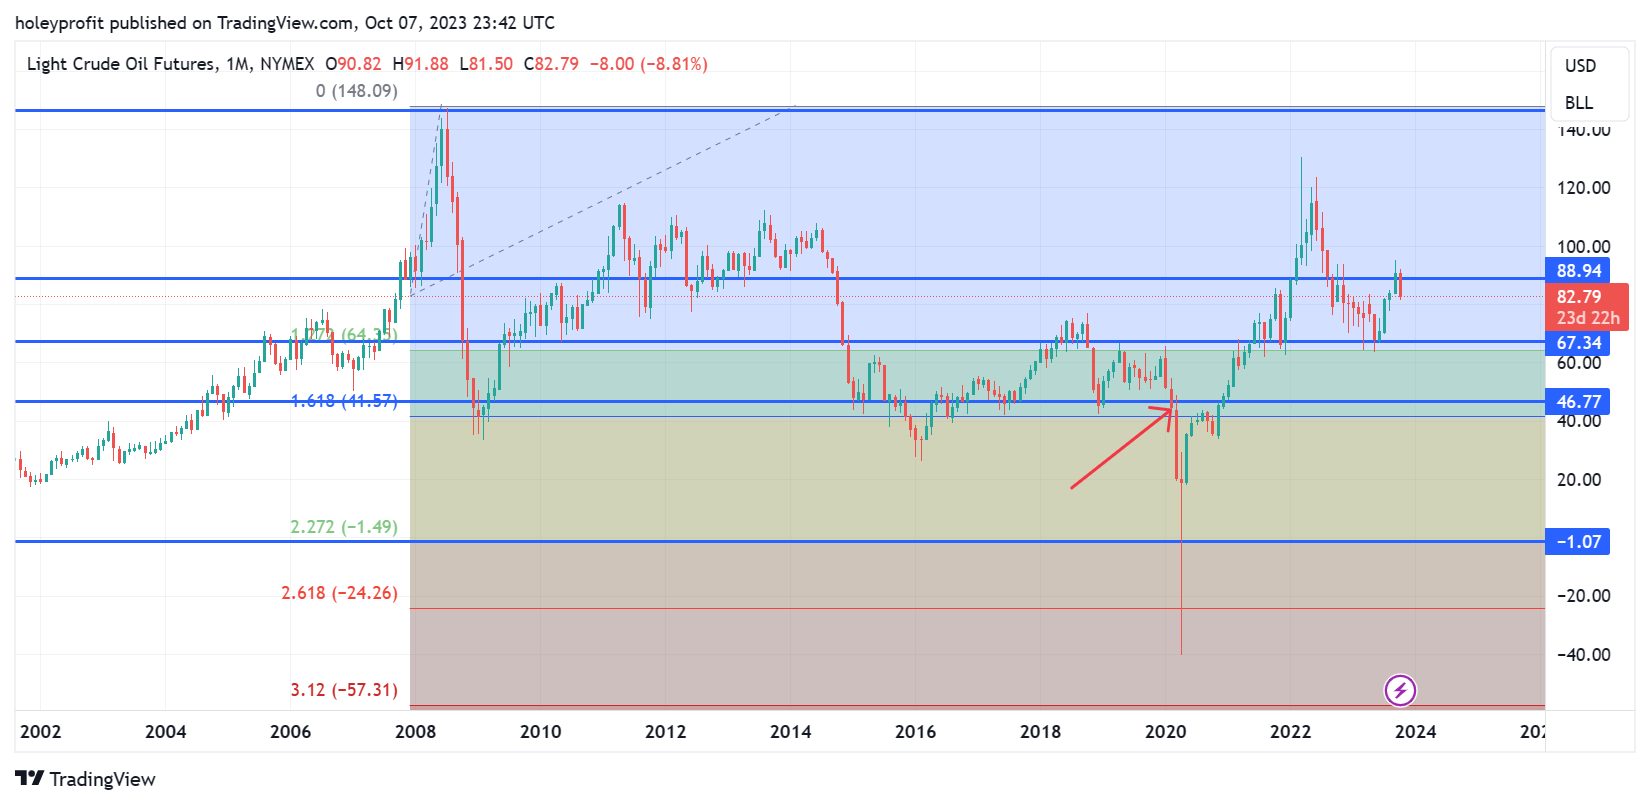
And if we look at the swing inside of the bull trap we have a Deep Crab harmonic pattern extending to 4.23 (Full extension).
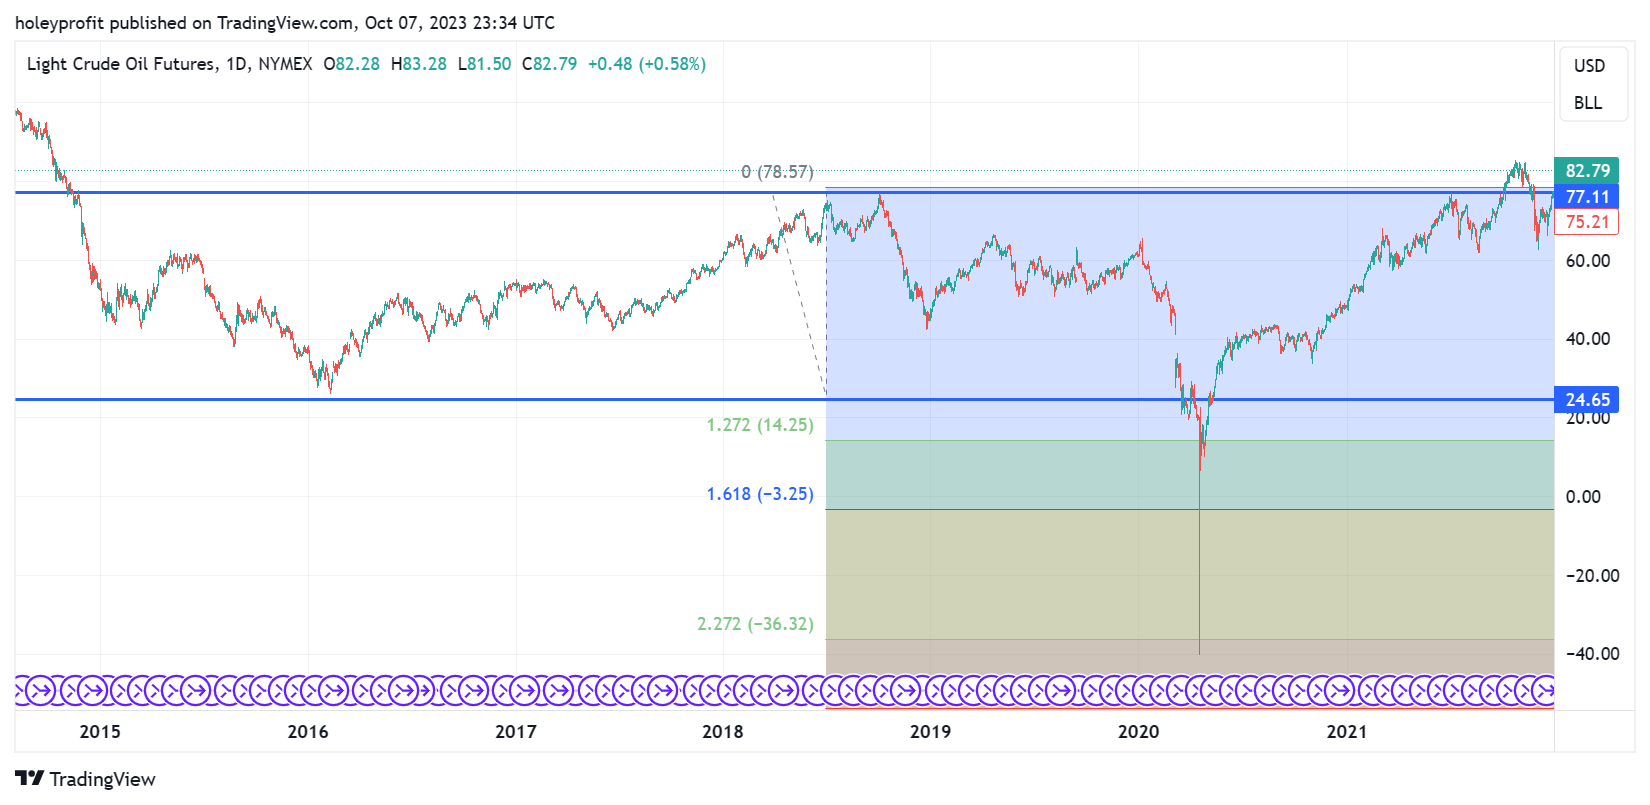
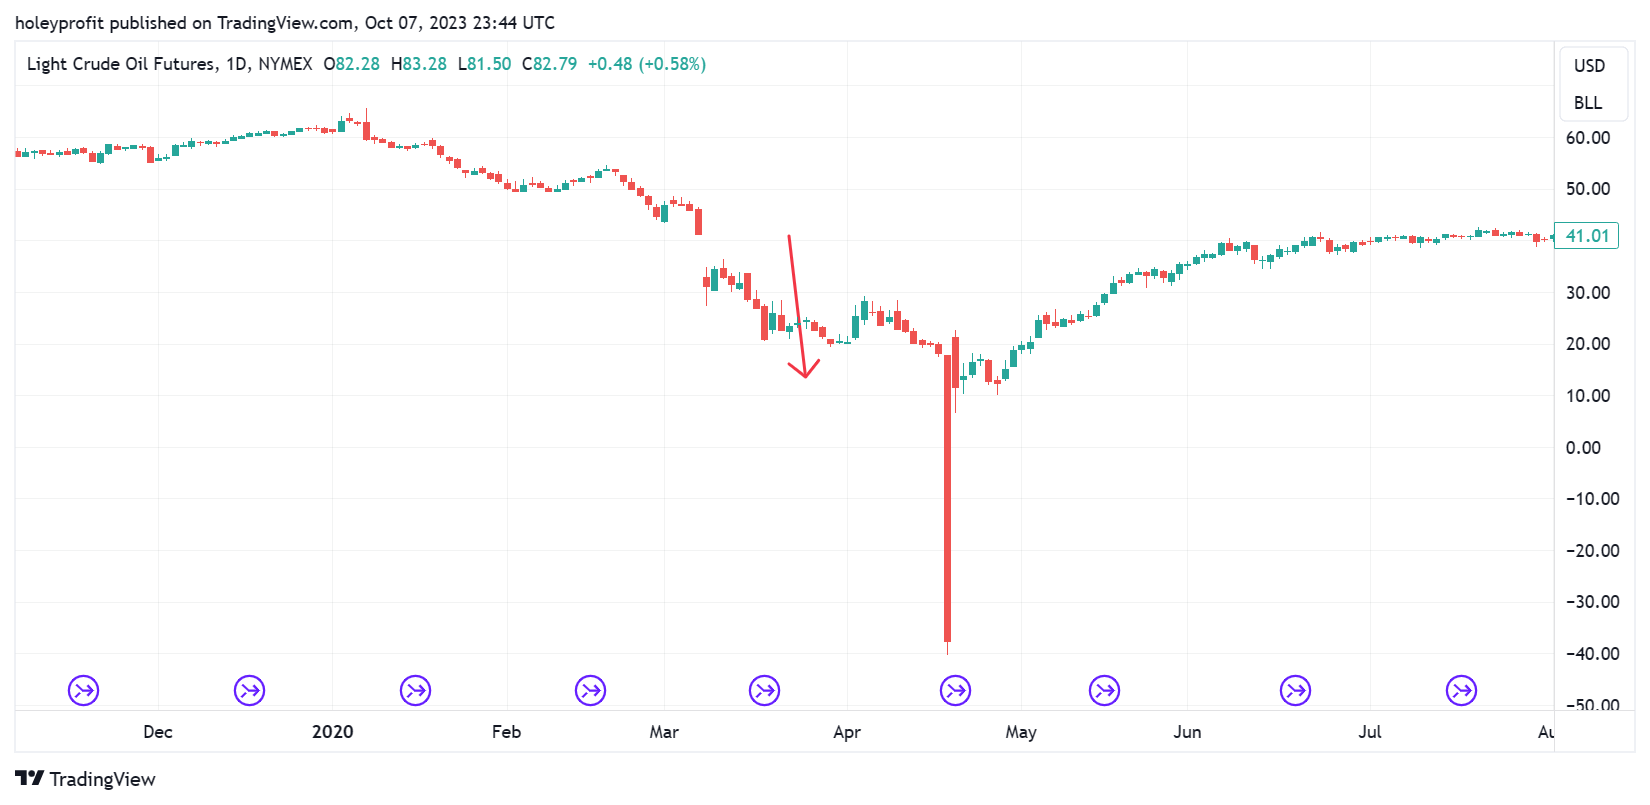
On daily chart if we fib the last pullback we have the crash section of the move under 1.61 and ending on 2.20.
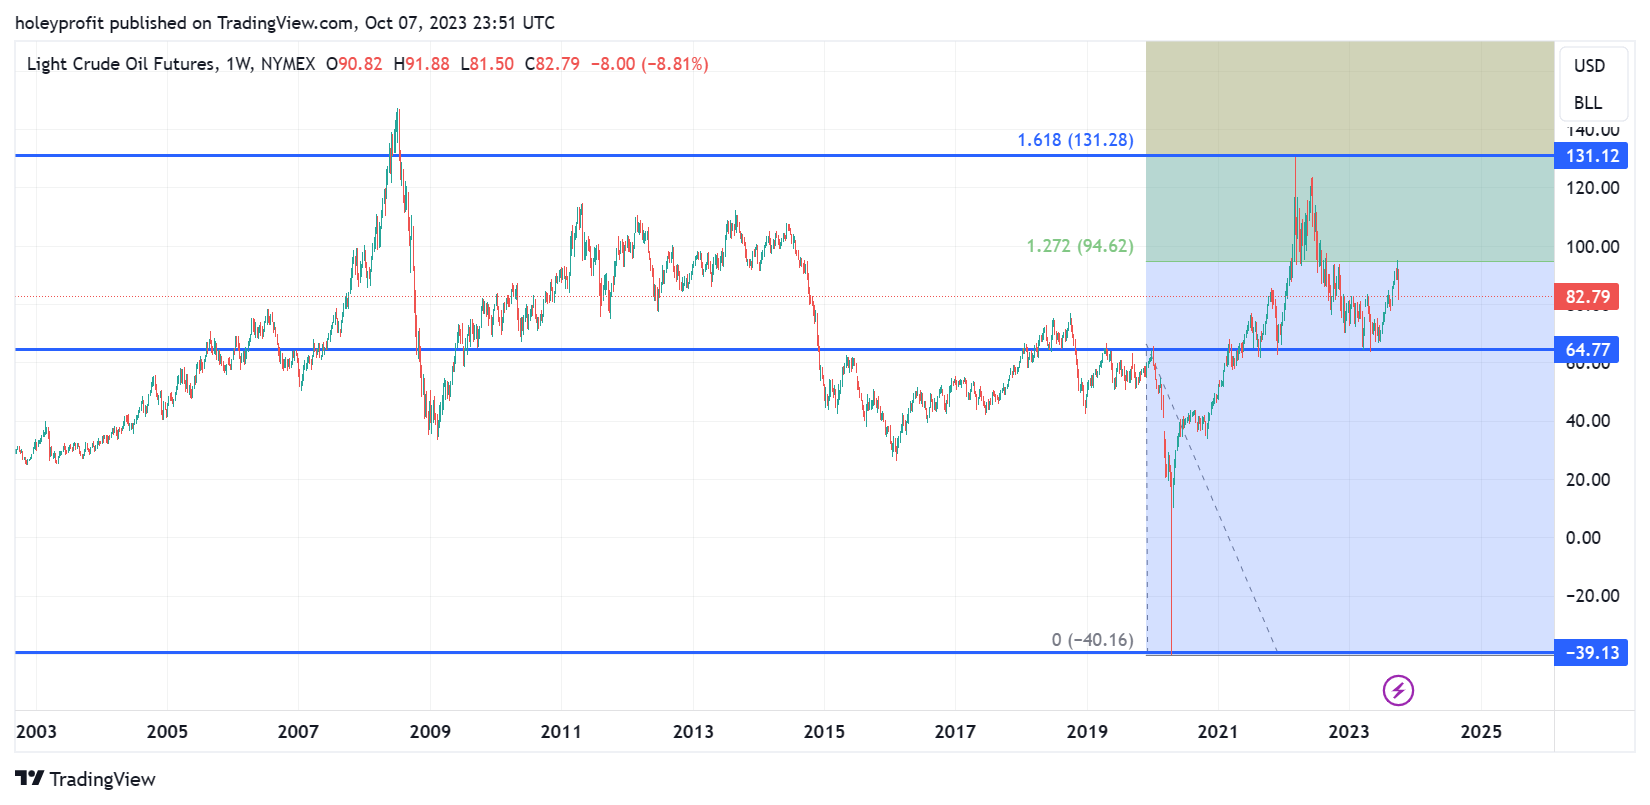
If we fib low to high of the big oil rally we can see once 76 fib broke 1.27 was next.
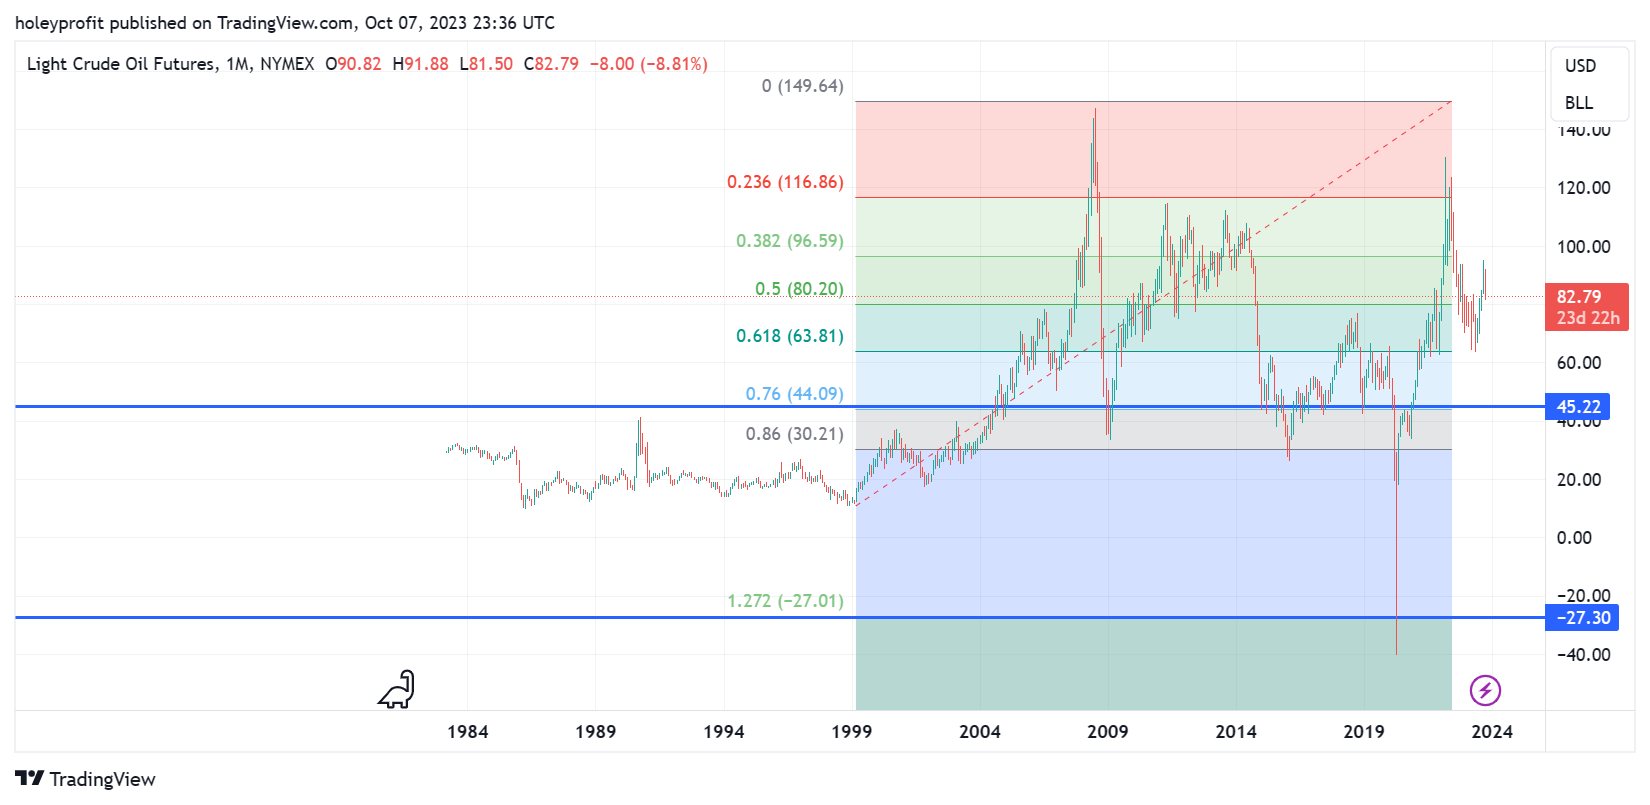
And if we take a 1.61 from the topping swing we can see once the 1.61 was broken, 1.27 was retested and then there was a crash.

All of these are recurring themes we’ve drawn attention to with fibs. They worked very well in the most insane of conditions.
The latter of them being a perfect example of a 1.61 trend reversal trade.
The 1.61 Trend Break Strategy - by HoleyProfit (substack.com)
And I actually noticed this in real time. As we were starting to break the 1.61 again I noticed this break setup.
I discarded it at the time because when I zoomed in to try to get the swing drawn as accurately as I could it kept deriving targets under zero.
I didn’t think that was going to happen!
Did think oil might be a short and a while before the crash I set a limit order. As it happens, that limit order didn’t have a target set on it. I think I missed that limit order by about $5. Wanted to short around $40 and $35 was the high.
Sad personal trader stories aside - this was an impressive show for the fibs.
This would continue.
A fib drawn on the big crash candle would break 1.27, retest. Break 1.16, retest. Then rocket to 2.61 and correct.
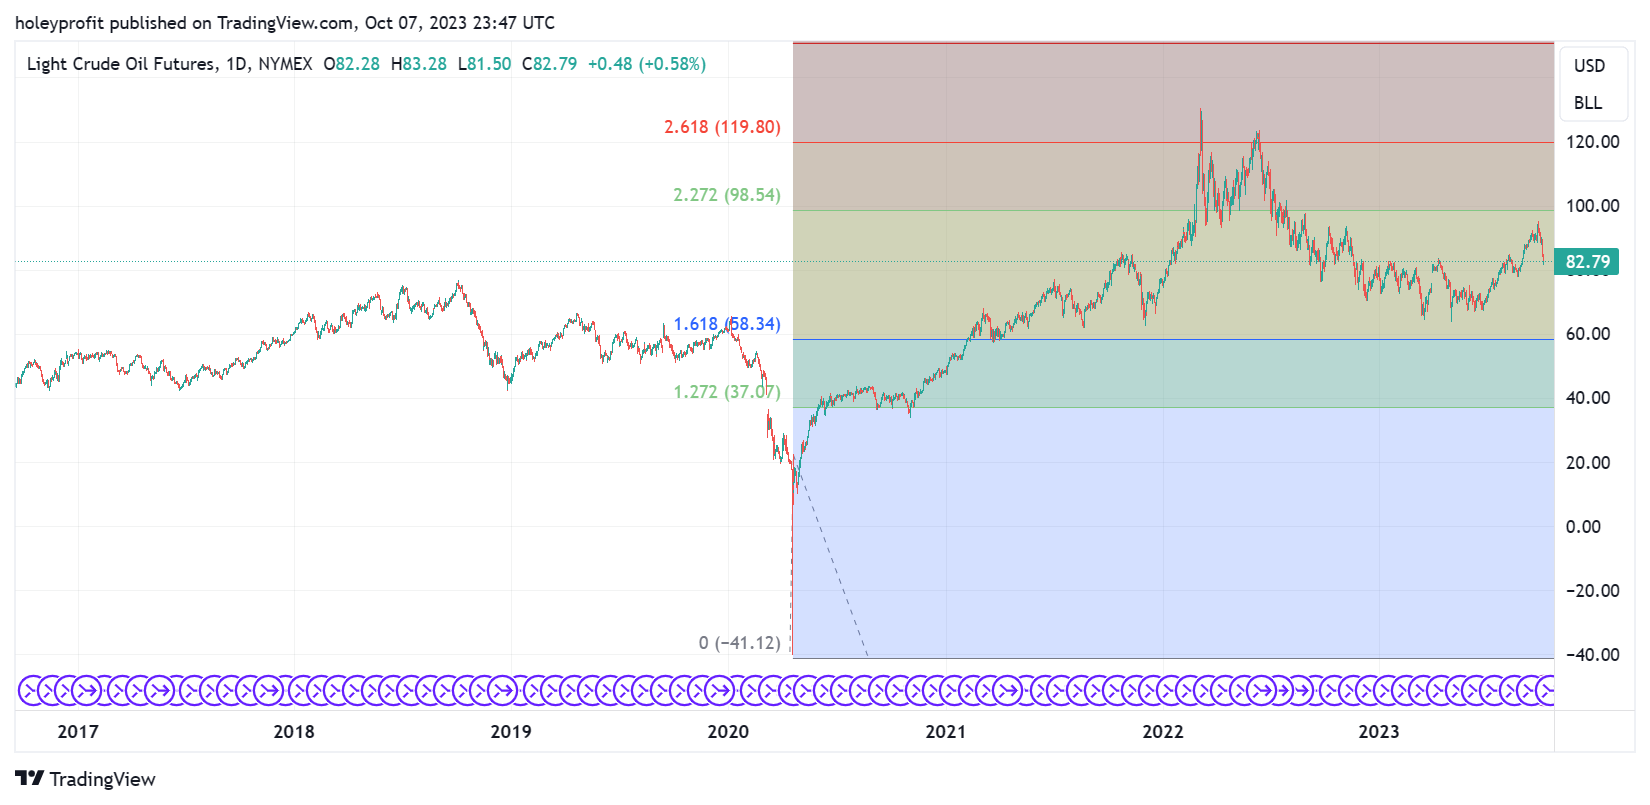
Using the full last swing into the low it was 1,61 (And recent mini crash coming off 1.27).
The high was 86 of the full drop and the current low is on a 61 spike out.
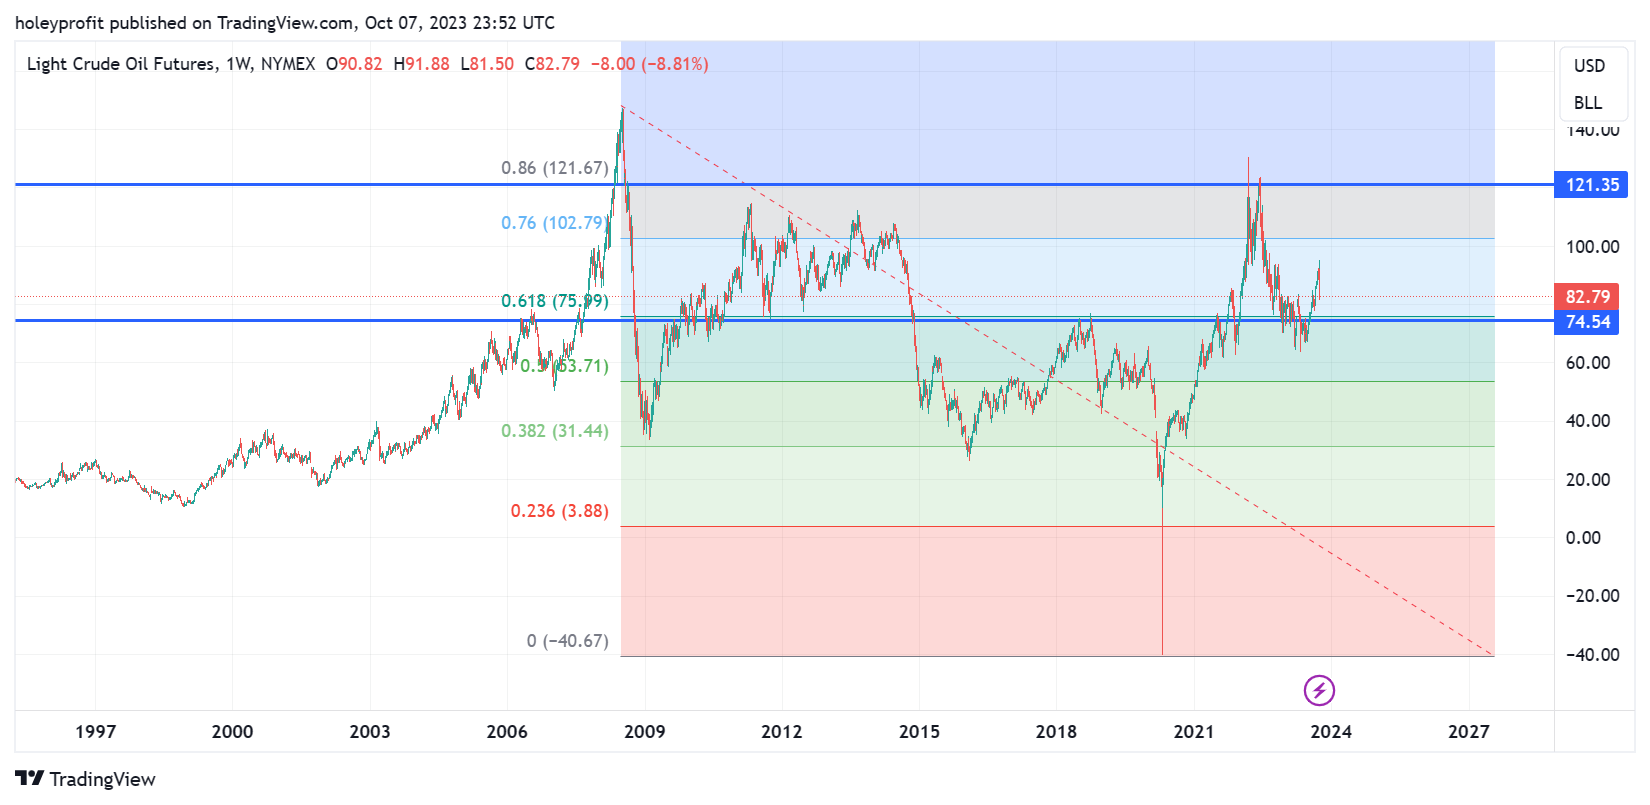
All in all, oil has been very compliant with the recurring fib norms we use.
Now let’s get into how we’d derive entry, stop loss and target levels if betting on bullish continuation in oil.
Keep reading with a 7-day free trial
Subscribe to Market Forecasts and Trade Plans to keep reading this post and get 7 days of free access to the full post archives.