

The Big Bear Plan

I’ve been personally exceptionally bearish during this recent range and made various references to this but I think we now have enough to write up a full bear plan.
Yesterday a lot of interesting things happened. Was also the anniversary of the 1929 high (Just a bit of trivia. I’ve found no notable edge on always betting on certain dates). Let’s look at some of the interesting things that happened and then get into full bear plans.
SPX has traded sideways at the 1.61 level for a long time and yesterday we made a sharp rejection of it.

Looking at this close up it was really ugly action and didn’t look bearish at the high.

But as things stand it really has just been a chop around the retest of resistance. If resistance fails to be support - then that means the failure of the up move.
So yesterday we might have entered into the actual turn of the trend. We got very close to the previous high but when we look at it based on the metric of is the big 1.61 acting more as resistance than support - yesterday was a big tell that resistance has the edge - at the moment. I think a recovery here would probably full flip bias on this.
For the first time, it felt like SPX “Gave up” yesterday. It didn’t feel like it was going to. My bearishness was not based on SPX. I was using SPX as my “Early warning” if it broke too far to the upside to be wary of a broad risk on rally.
Nasdaq
In insolation, SPX looked really bullish. I’d been travelling for a spell of the move into the range zone and just watching SPX and based on SPX I was convinced my next step was going to be pivoting to long. Waiting for a dump first (86 fib correction), but I did think we’d be reverting to positioning for a squeeze move.
But when I looked though all the things when I got back, it has to be said there’s a preponderance of evidence to suggest we have more potential reversal patterns than continuation patterns. Nasdaq really stood out as a bearish signal. I explained this in detail in a Nasdaq/SPX post recently.
Either SPX or Nasdaq is Lying - by HoleyProfit (substack.com)
Initially when I looked at Nasdaq it was around the red circle and my thinking was mainly “It’d not be a tragedy to miss up to the blue circle and pivot after”.

I was still mainly geared towards changing net bias, but while the Nasdaq was at the 76 it wasn’t the optimal time. Because it could be the worst possible time …
Which it was and Nasdaq went into quite a clean downtrend since then. SPX, not so much. It was like a boxer. Baiting you into swinging, slipping you and bopping you in the nose on its way out. Circle around you and repeat. Fun times. But actually manageable if the was to short spikes (And not lows).
The Nasdaq previously broke the 61 fib and it got close to the 50 fib. This was the best chance the Nasdaq had to make a low and begin to uptrend. Instead, it marginally spiked out the 61 and then yesterday we had the big mega bear candle crashing through the 61 again.
That could be the 61 given up as a level. And if it is, we’re heading a lot lower.
NVDA
There’s a news thing with NVDA. I’m not going to pretend I know anything about it. But the TA is glaring. NVDA macro bear patterns were covered in a recent post but here’s a couple things most notable. NVDA trades a little over the 4.23 fib. And last month NVDA closed with a big doji candle.

The 4.23 is a polarising area. Usually there’s a sharp correction off it and in the times 4.23 fibs break it really can be a wild continuation move. Major decision level. Always a rule. Big and small charts. At 4.23s, a big decision is generally made. The doji candle, is an indecision candle.
A doji is a candle that trades up and down but closes at the price it opened. “Should we rally? Should we drop? IDK, let’s just finish where we started and decide later”. This is the general psychology behind the doji. It tells us to look for a decision coming soon.
If my YouTube research of candle patterns back in the day was true, the rice traders who first invented the candle stick patterns gave the rules, “Doji at a top, sell. Doji at a bottom wait for bullish action because the weight of the market can drive it down more”. Something like that.
But they didn’t have to deal with stop hunts as much so pinches of salt and all that.
We do know the doji is an indecision candle and we do know the 4.23 is a major decision area. Then it drops 10% in a day.

If it sells more, it’s going to be breaking back under the 4.23.
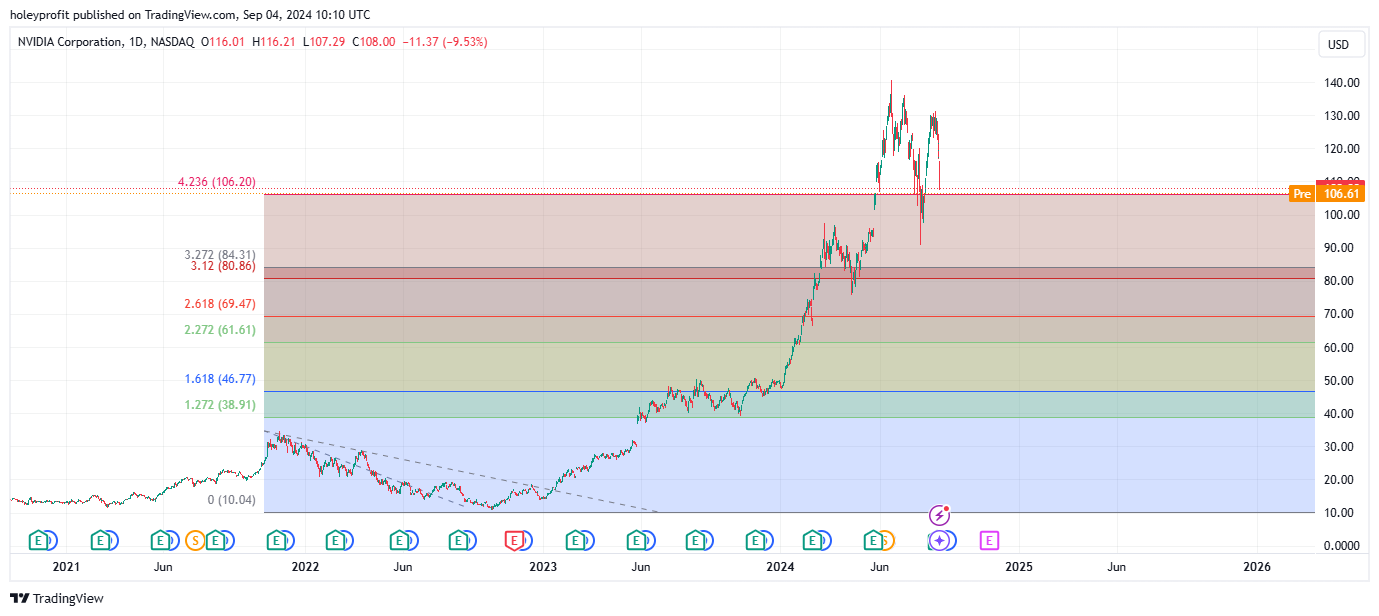
Perhaps denoting a 4.23 false breakout. I trade false breakout patterns a lot - you’ll have seen what happens in the times I am right about them. “Nothing good for NVDA” would be what would usually happen.
76 rejection - BTW.
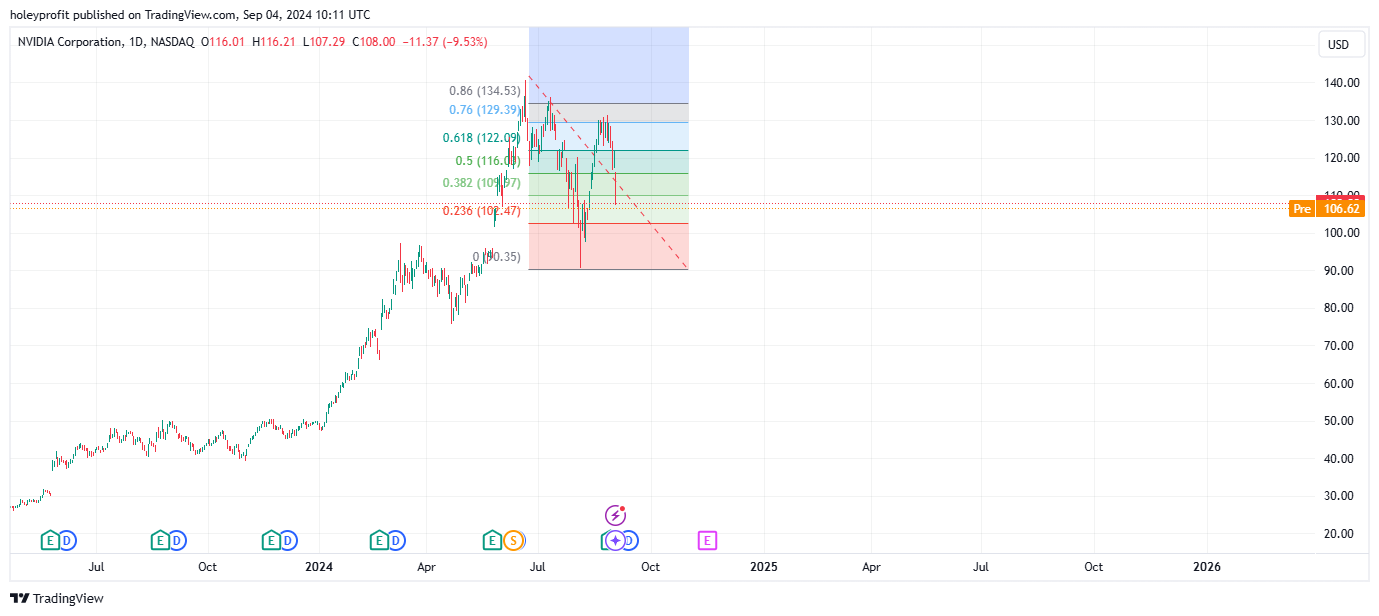
How weird will it be if after all this mayhem NVDA ends up just going down as per the textbook rules we have for uptrend transitioning to downtrend.
RUT
I honestly have to say not withstanding the Nasdaq thing, I really did feel I was probably going to be forced to at least dump my attempts to short SPX (Maybe focusing on something like COIN instead) into the final rally. The bear traps and spikes really screw with your head - even if you know that’s one of the ways a topping market can screw with your head.
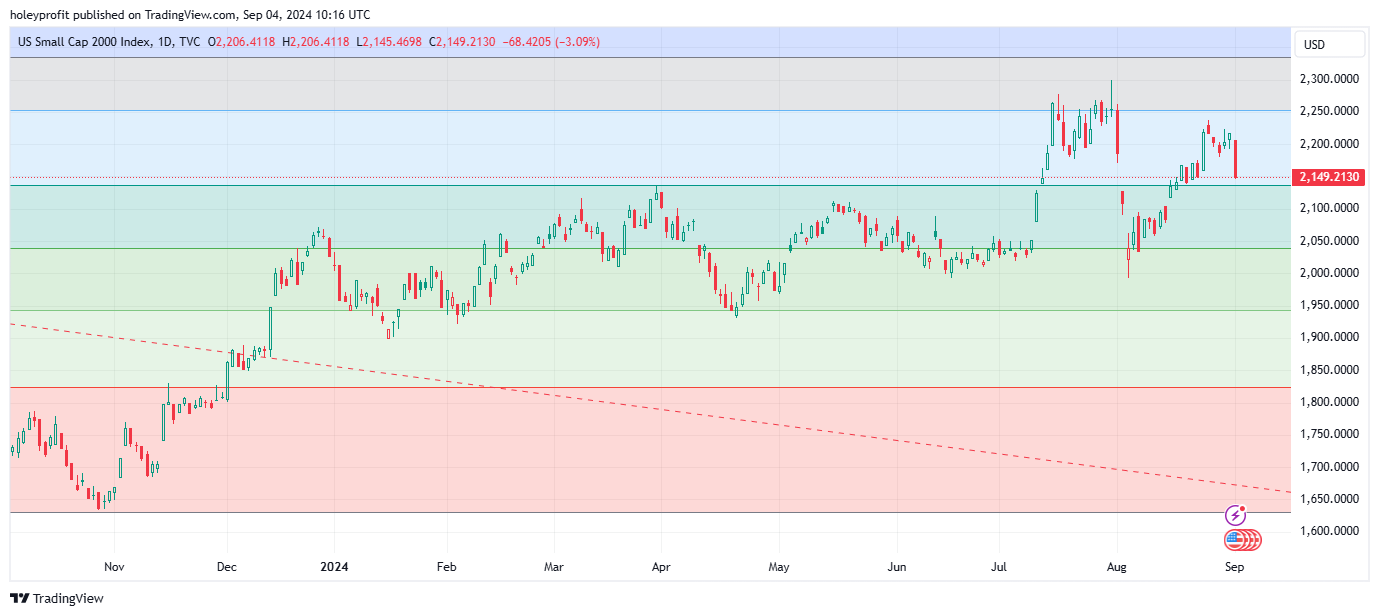
But then I was looking at things like RUT.

How can I not be bearish on RUT when it looks like this using the rules I use. One look at this chart and we were sending out IWM swing puts. Setups don’t get much more obvious and betting on these is Spartan law where I come from. Sure, a lot make you feel a bit silly - but a few of them are mega jackpots.
Like Nasdaq, during the last rally RUT had its best chance to shine and make the breakout. It didn’t happen. Now we’re almost back under the 61.
This is a lot of things to support that we might be early in a bear break. If we are early in a bear break, we have a very high probability of being able to determine the levels and style of the move. Full bear breaks are exceptionally rare but I’ve looked at a lot of them and almost none deviate from the basic fib levels of a break.
With a combination of some Elliot wave and our sets of strategies, we can now plan all the major parts we’d expect to see in a bear market.
So let’s do that now.
Keep reading with a 7-day free trial
Subscribe to Market Forecasts and Trade Plans to keep reading this post and get 7 days of free access to the full post archives.