

The case for a macro bear has now fully developed.

I intuitively feel bullish. It’s hard not to with the intraday action. I’ve got eyes. However, I know from (Bitter) experience when my intuitive nature wants to bet against pre-made plans, the plans usually vastly outperform my opinions. I know when it’s time to short I should not want to.
And it is time to short. The confluence of short signals is impressive, and the tolerance zone for moves against them is now so small the risk:reward is huge.
I feel by the textbook rules, we have the most obvious short signal there could be. Honestly, if you know a few things about a few things; if seems like a lay-up. The setups seem so obvious I can’t help but worry it’s a honeytrap. Something tricky like a bat would seem a bit more “Suitable hard”.

We’re going to a deep analysis now but the case for a macro bear market which is topping imminently (Risky word to use, and I do not use it loosely), but we will very quickly nope out of this if we do not see the things we need to see. We have almost no tolerance for a margin of error now.
If the bears are going to do it, I expect to see them prove it! It can’t be subtle in the yank. Buyers have to get enticed in and they have to get sharply rugged in the first break. It’s just how it always is. And if we’re not seeing this, we’re probably not seeing a bear top.
Let’s do a top down analysis on SPX. We’ll start with the thesis of a macro turn of trend and then we’ll scale into nearer and nearer term action to look at what the smaller swings would be (Either along the way of a super bear or a more minor crash/correction).
I know the scale of moves proposed here seem a big reach to be able to forecast with TA. And I’m not saying I know anything will happen. We all find out at the same time. I just want to document it beforehand so, if it happens, it may be useful later. I feel forecasts to date have gave some efficacy to the models used.
All analysis is descriptive and not prescriptive. It’s just an extrapolation of crash norms onto current charts.
Different ages with similar crashes - by HoleyProfit (substack.com)
A 50 Year Bubble
Bulls are fond of the phrase, “When in doubt, scale out”. Honestly, it was scaling out that scared me. I thought the market was due a correction when I first presented a bear thesis, when I started to look at a larger context I seen we may be due to correct a far larger rally than the recent ones.
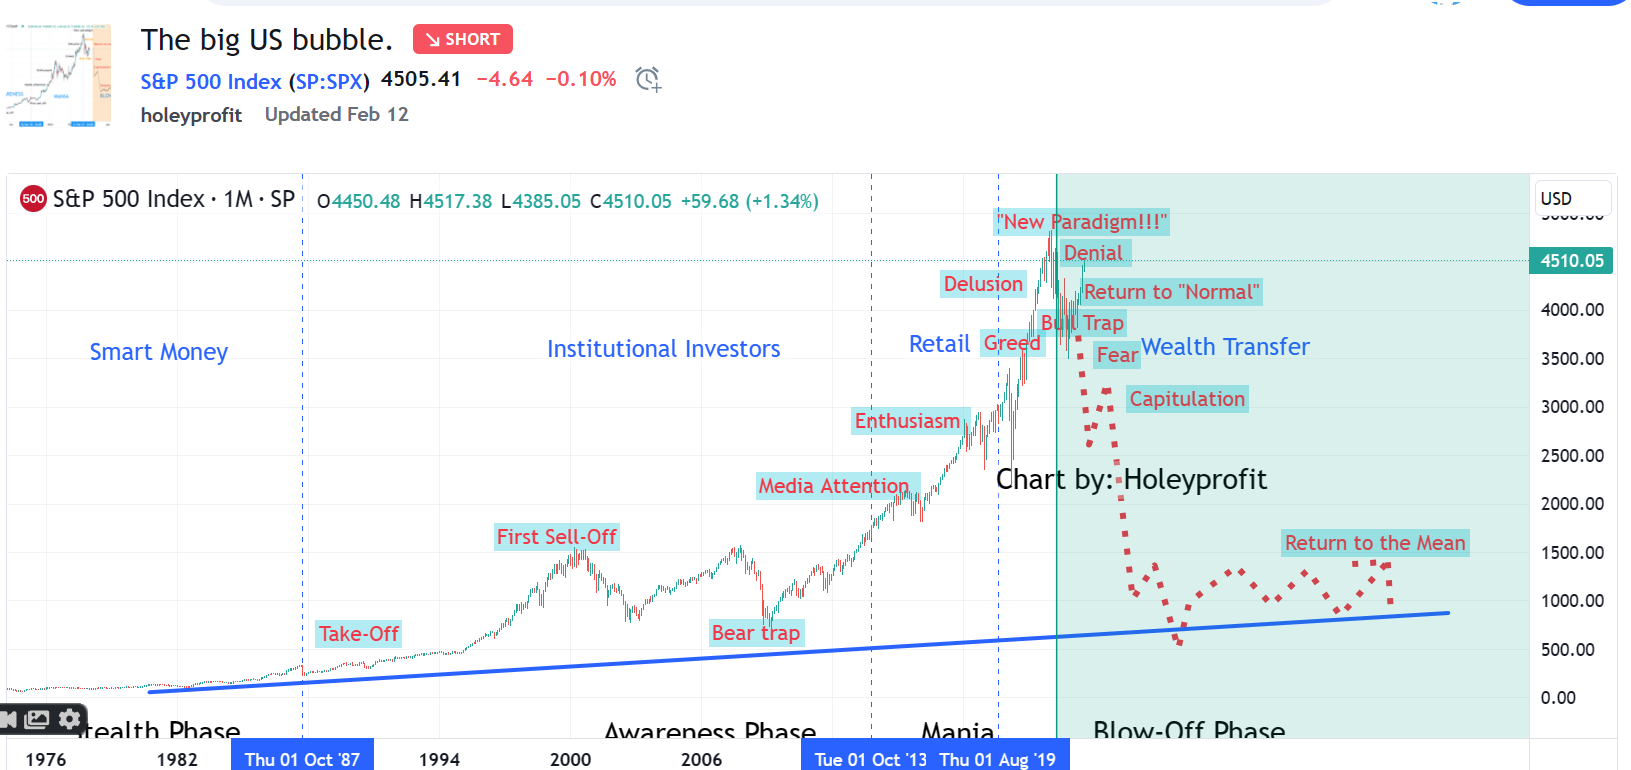

This template is awesome, when it does not suck! In the end, all bubbles end up essentially looking like this. However, something that looks like the “End” of this can appear many times. There’ll be charts of this for AAPL at 10, I’m sure. It’s easy to think you’re seeing mania long before you are.
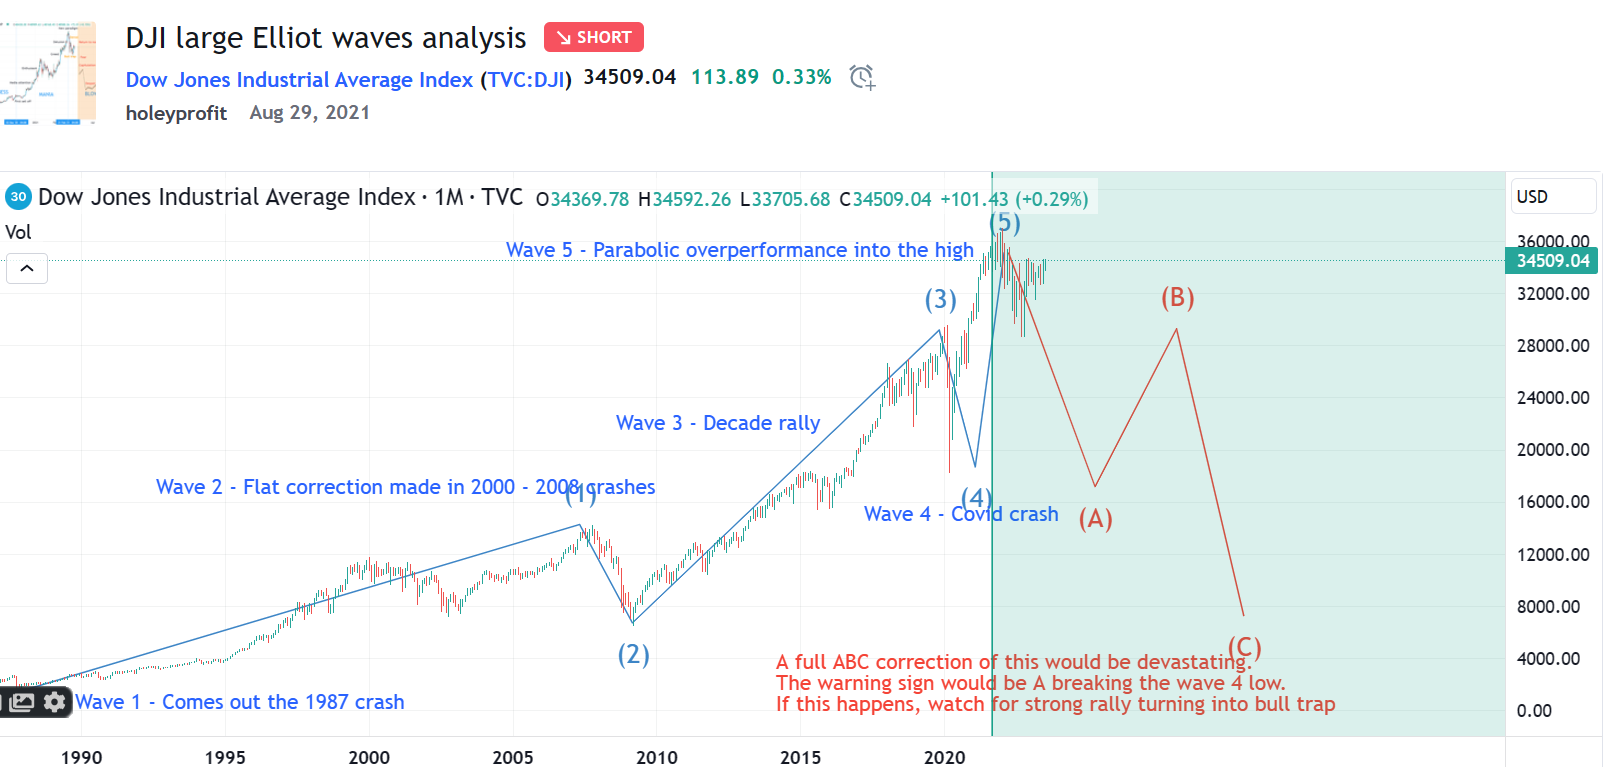
But another way this overall model is expressed is the Elliot wave pattern. Elliot looks like this once it’s made a full cycle up and a full correction. In the EW model we have more rules and guidelines by which to qualify or rule out us being at the end of the cycle. Here’s some:
Wave 2 is a sharp correction or range bound with a false breakout.
After wave 2 the market will go into a stead uptrend.
The steady uptrend will be the biggest of the legs.
Wave 4 will feature a false breakout of about 30%
Wave 5 will be a parabolic rally with no pullbacks.
Wave 5 will extend to a 161 extension of wave 4.
That’s quite a lot of things, right? Have to see all of them and they have to be in the right order. And here they are:

And further to this, since this was posted the market then went into a 9 month downtrend off the implied topping level.
This would support us being in a “Return to Normal” phase.

A lot of people modelled crash analysis on 2008 through 2023. I think for break/capitulation period it may act similarly (Most markets act the same in this stage) but the move before 2000 and 2008 is not like the move we’ve had up to our current high.
2000 and 2008 all in all was just a range and a 76 correction of the last rally. The move from the last breakout was not as big as the current one. Conditions like this really are only seen in the market of the early 1900s building into the 1930s bear. During this, we had a first climb. Series of choppy crashes. The boom. Bear traps. Spike high.

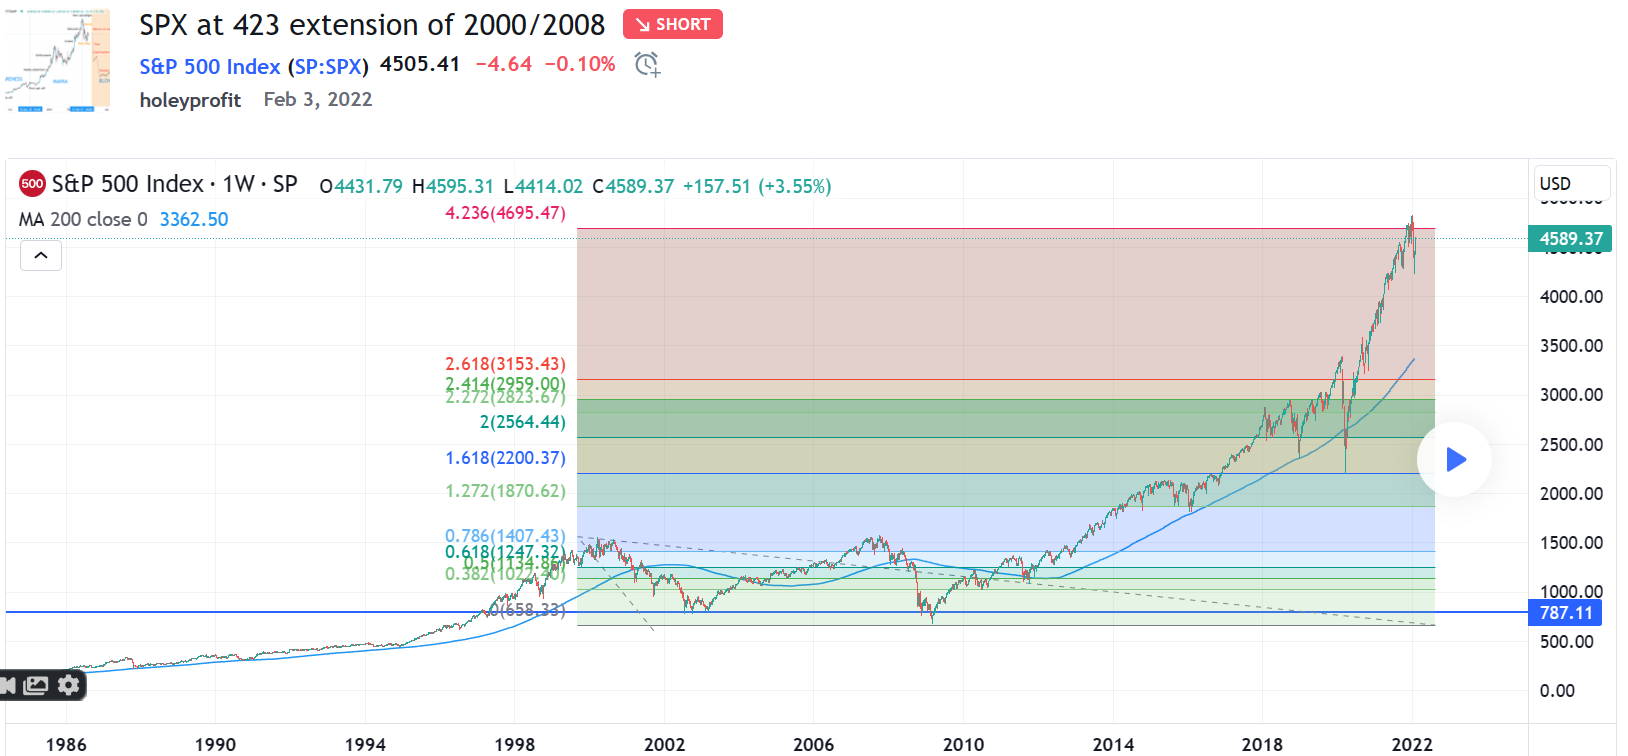
What’s further interesting, is currently the highs made come from a 4/23 extension of the 2008 drop (This means the market went up a bit over four times what it dropped in the 2008 crash). And the only other instance we have of a 423 extension from a 50 crash is the DJI of 1929.
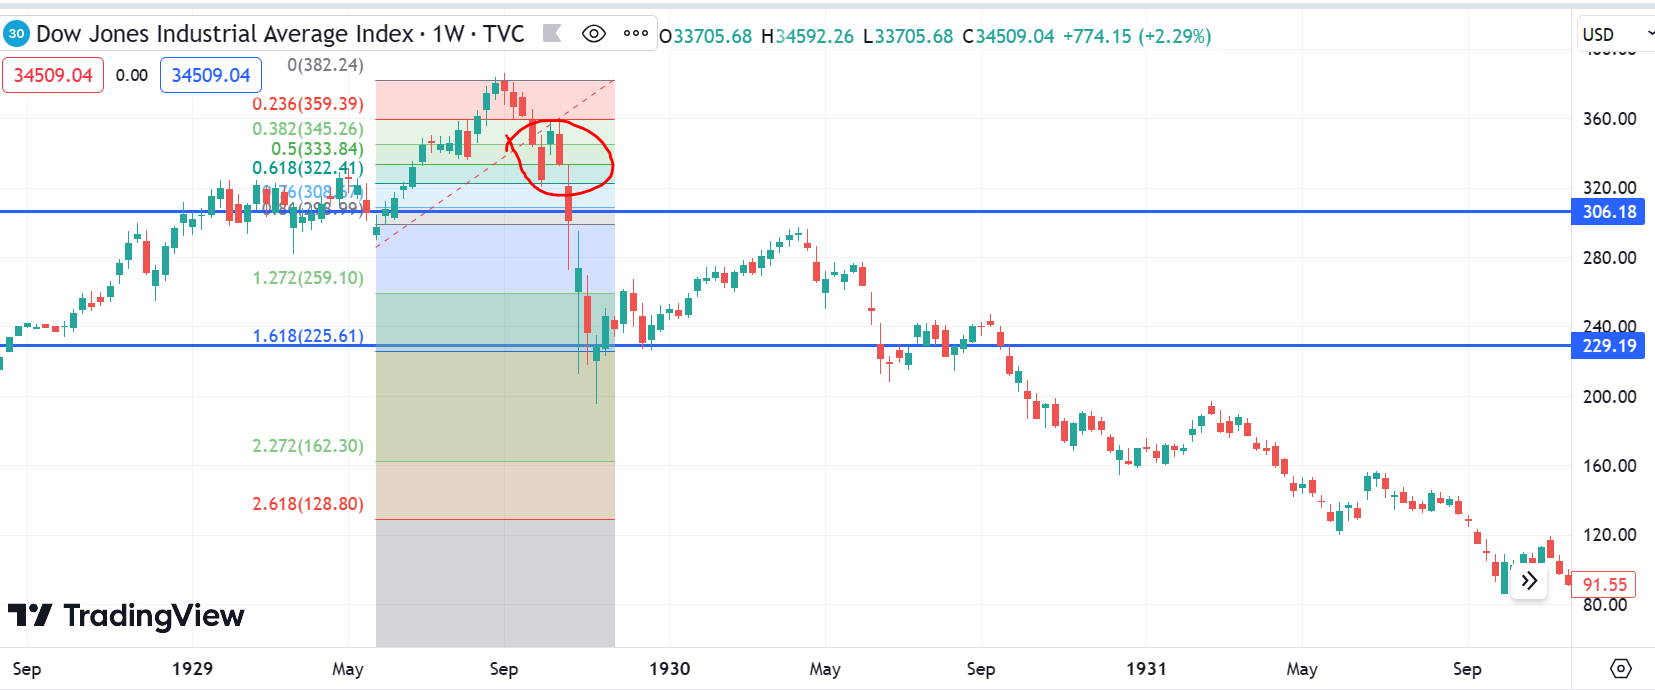
Here it is in 1929.

So here we have a juxtaposition of a seemingly unforecastable event using an analysis method that ignores all real fundamentals of the market, yet being able to see clear instances of accuracy in the implied forecast. Not over little swings, over ones building up over years. Not in hindsight, using historic models in real time.
Something like this would be a horrible event in the real world but when it comes to charting up, the Depression move certainly left clues. For example, we can use the same fib set and see a 423 high, crash to 220, bounce to 320. Market goes into the brutal bear grind under 220.

The extrapolation is simple.

This is the full risk scenario. The technical case for this is essentially flawless. Every -precondition you could have put forward in 2009 forward for a boom and bust using the 1029 model has completed over the following 14 years. Rough around the edges, more spike outs etc - but eerily accurate in the big swings.
A good thing to do is look for confirmative patterns in new price action to support forecasts generated from old action. These levels could have been defined a decade ago, so surely if we have something perfectly complimenting it forming over, say, the last year or so, that’d be interesting. Not likely by chance.
And if this is a top, interestingly enough the implied bounce level would be right on the 161 of the recent rally. This is the point where (If the market drops from here) a bullish butterfly would be tested. Often in a bull butterfly failure, we dead-cat off it and then break strong under it. Agreeing exactly with the DJI forecast.

The butterfly is a complex pattern. For this to fit the rules of a butterfly all the swings since the 2019 breakout had to be just so.

Lesser, or Intermediate Crashes
It’s hard to be bearish on SPX when it’s rallying. There’s the simple fact that out of all the incredibly smart people in the world who have bet against the SPX the result has either been they stopped doing that or they got nailed. Invariably! It’s something that haunts you when you’re shorting and it’s ripping.
But I think it’s really unlikely SPX is not due some sort of bigger pullback. I feel even when we go with the most optimistic forecast of the 2020 bear being a generational pullback and start of a new trend, this would dictate we’re due to visit the 76 fib of the 2021 rally.

2008 was this style of 76 correction. As you can see, if we were going to have something similar there’s a lot of scope for trickery and spike outs but overall the market will reset before starting a new trend.

This 76 is the first target zone. If that breaks, we’re looking for a secondary break. When a 76 breaks as a trend continuation pattern the market will usually go to at least 127 in a crash move (And can go further, 161 is also a viable target). Here’s this break in the DJI of 1929.
This gives a second crash target of 1500.

The 161 of this is around 500. While this sounds absurdly low, this is close to exactly the percentage of the drops of DJI, 1929 - Nasdaq, 2000 and Nikkei 1990. This price figure would agree with the average expected drop in an index when experiencing a depression style crash.
Looking Local
For anything to happen something has to happen. We need to see markets rejecting their current attempts at a breakout.
We need to see sellers take control on the 76 fib. We maybe bounce on 61 and retest the 76 (And maybe not) but we need to see sellers clearly driving price from the 76 to 61. Sellers have to dominate the next 200 points.
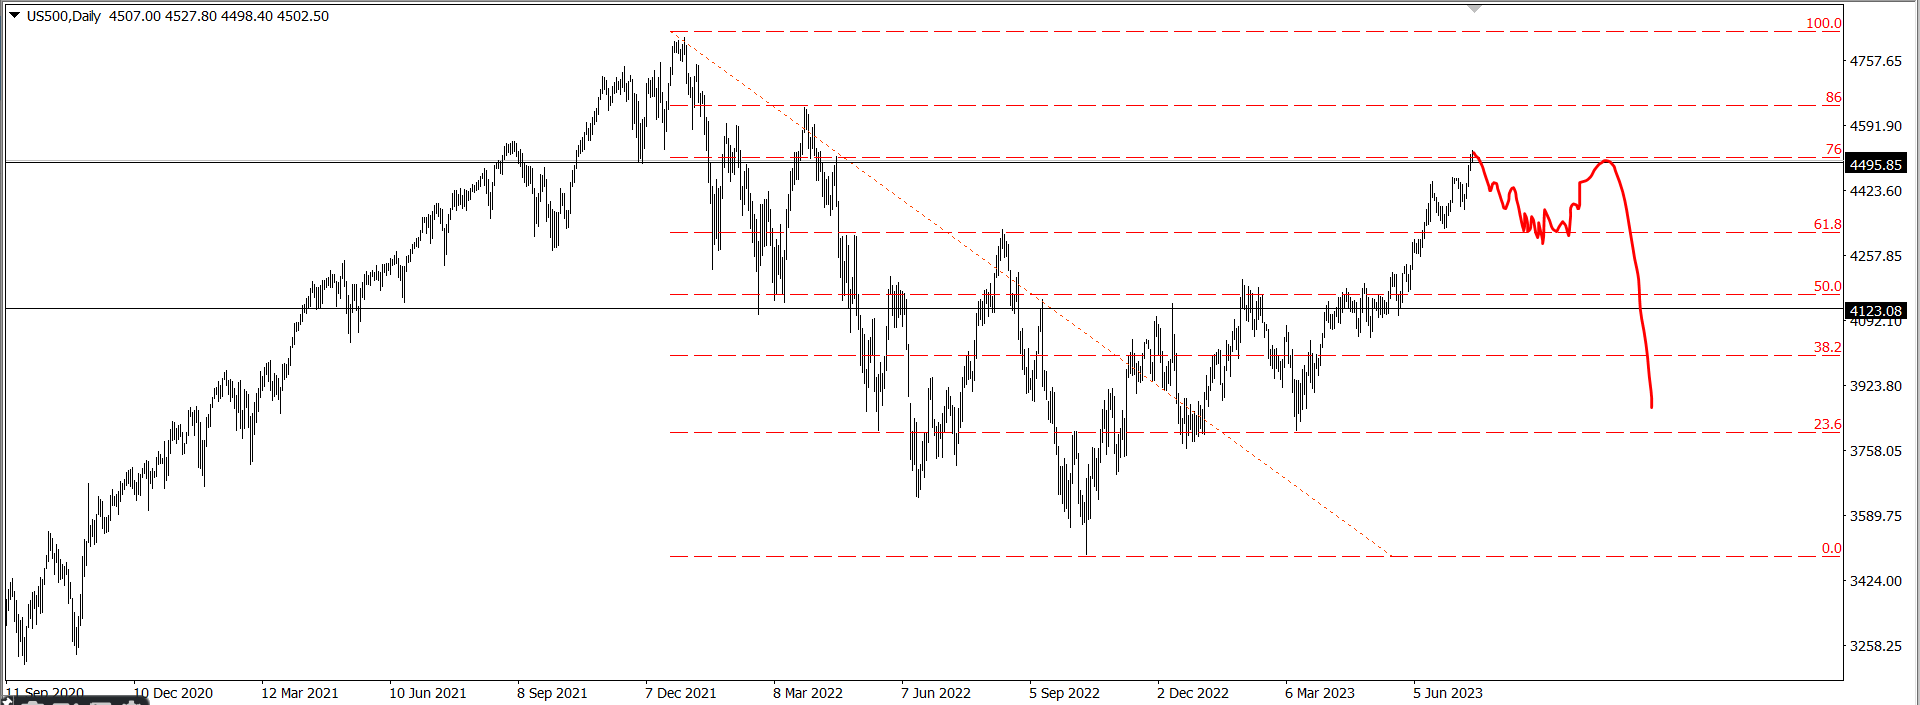
We need to see local 76 supports breaking. Big strong breaks of them. We close hovering just above the first big one.
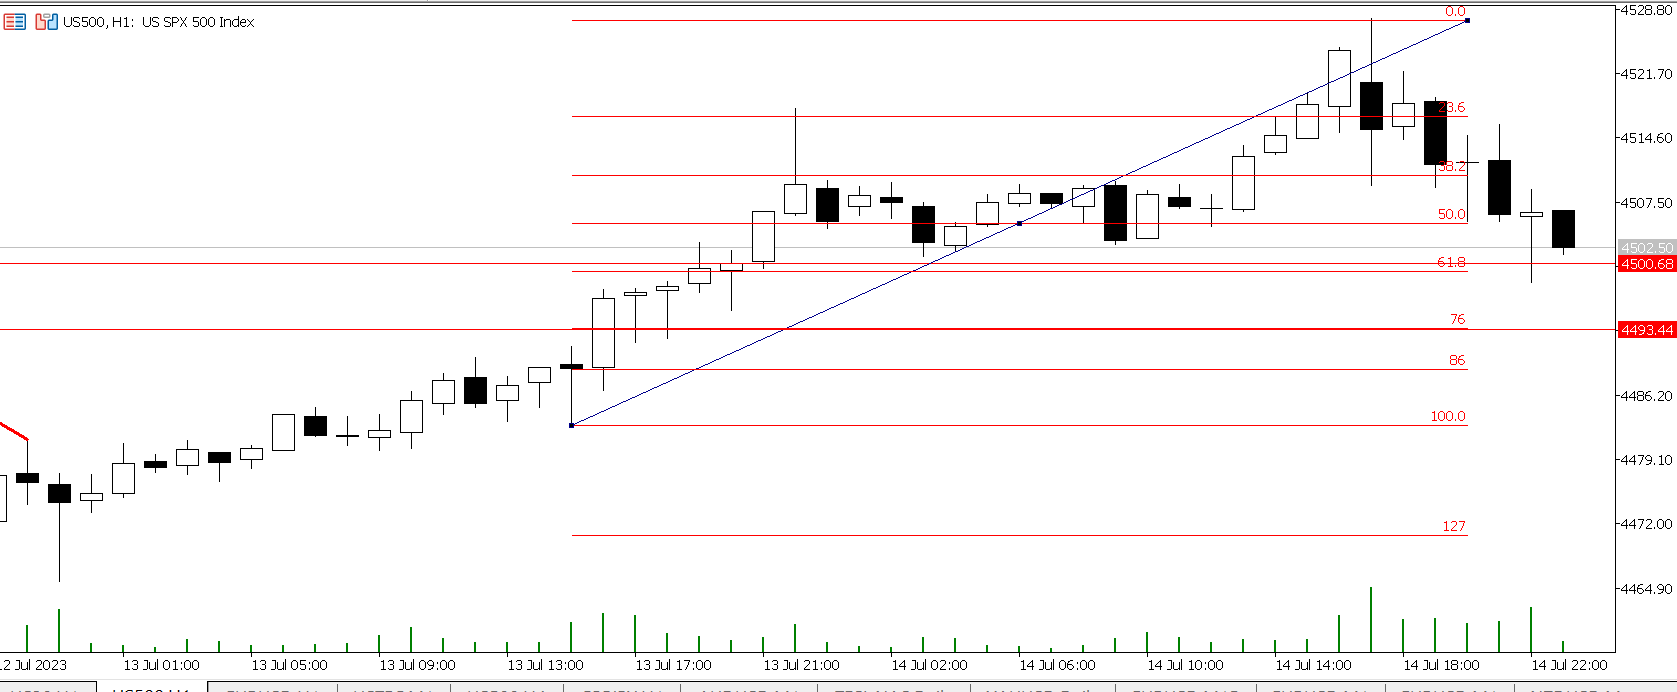
Given we’re into this test area at the weekend, it’s possible the break is made with a gap. A gap under 4493 would be telling (Note, this is also the price the full 76 fib is at - we have old info agreeing with new info).
We need to see the 161 of the topping swing fail as support.

In a strong uptrend, when the 76 breaks we often drop to the 161 and then the trend resumes. We need to see sellers being able to take this level.
If we see sellers taking the local 76 and 161, the odds of us seeing them take the big 61 (200 points) are really good. And if bears can win those next 200 points, there’s a really big shout for a break setting up. A break that would have a conservative target of 3000.
The high of the day on Friday was 4527. If price gets above there and sellers lose the next 80 points, this is probably too early.
We must see strong evidence that we’re not the only ones wanting to short these levels in the near future. Most of the time, we’d be having some sort of news event. I am not one for the news. I literally don’t know what the FED has done since Feb (And it’s not mattered, at all) - but I’ll say if we get bear news in this area, it has more weight.
On news, of course we have earnings coming up. And of course these can lead to big swings. Either way. Please keep in mind risk against bears should be considered parabolic. Bears have a very strong case and a super high risk:reward trade, as long as they use sensible stops to get out the way of a train.
============================================
From a textbook perspective, everything is perfect. If the market goes down here - it will have done it in a textbook Elliot wave/harmonic/fib manner. My suspicious nature makes me wonder if it’s “Too perfect”, but I’d just kick myself if the market laid up the optimal setup that I well understand and I bet the other side.
Massive bear again now. Did a lot of shorting during Thurs/Friday. Very small tolerance area for being wrong. I know my plans would usually fail big if they fail at all. The market needs no “Reason” to blow-off. Never underestimate the market’s ability to move just because it does not like you and your bet is market food.
But this is it. If you were waiting for all the pieces to click together - the charting books would all say now is the time. Tiny area of risk. Perfect agreement of signals.
Wow! Incredible research and profound thoughts. Thank you so much for sharing! I'm wondering the market makers/FED...would just let the history repeat and see the market drop that much? Or is it just something nobody can control?