

The Case for Being on Brink of a Tail Event

In this post I’ll attempt to explain why I think sensational market moves are now a highly probable outcome.
This post will build more on a concept I started to talk a lot about back in August of 2023. Where I first laid out the case for it being only reasonable to believe stronger and stronger moves would come and these would build into a spectacular tail event.
Approaching a Fat Tail Event

A lot of stuff in recent posts has been laying the groundwork for this one. In this post I’ll make my case to backup a number of very ambitious seeming forecasts and hopefully convince you they’re entirely logical and not just hyped up speculations.
My analysis is mainly TA based but let me just cover a few fundie things.
A “Tail event” is just something exceptionally unusual. In a probability distribution (Such as % PL of a index in a year) there’s going to be the bulk of years falling inside of a middling range (5 - 15%) and there’ll be exceptional ones with moves dramatically outside of the standard range.
These large moves as known as tail events. They can be positive or negative, the defining aspect of them is they do not happen often.
The Progressively Fattening Tails
Heading into the 2018 high there was a record low in volatile in indices. Prices has risen so steadily for so long and then went into a steeper incline.
During this time, all time lows in volatility were set.
There are various studies in which it is suggested volatility is mean reverting. This has been suggested by various sources. There are studies from the National Bureau of Economic Research on this.
In 2018 there was a blow up in the short vol funds. Since then, moves in markets have gotten more and more aggressive. We went from the chaos of 2008, to the grinding stability (mostly) of 2009 to 2017. Into a bit of a take off in 2018 and then the ATR started to increase massively.
After 2018, it became common to see moves that were inconceivable (up or down) in 2017.
From the record low in volatility, we started to enter into an expansion of volatility. To visualise this, the vol of markets (measured by ATR) relative to the mean would be something like this.

In 2018, there was a reversal of the trend. From markets becoming more and more predictable in terms of direction and percentage of price moves to less predictable with it being much more reasonable to expect bigger swings.
Things that happen in current markets would have been massive events in the 2017 market. We can swing more over the space of a few hours than we did in a week previously. Exceptional events are becoming more common (‘tails fattening’). Which makes a lot of sense inside the context of volatility expansion.
Mean Reversion Overshoot
If you accept the thesis of mean reversion in volatility and that markets are getting observably more volatile, then it’s not a big jump at all to start to think this is probably what the logical conclusion of the vol reversion would look like.

A record undershoot of the mean leads to a strong trend back to it and then a blow off over it. Mean reversion tends to overshoot to extremes on both sides when stretched.
Elastic band pinging … that sort of idea.
If that is true, then the outcome of that would have to be this section of chart looking tame relative to the next section.
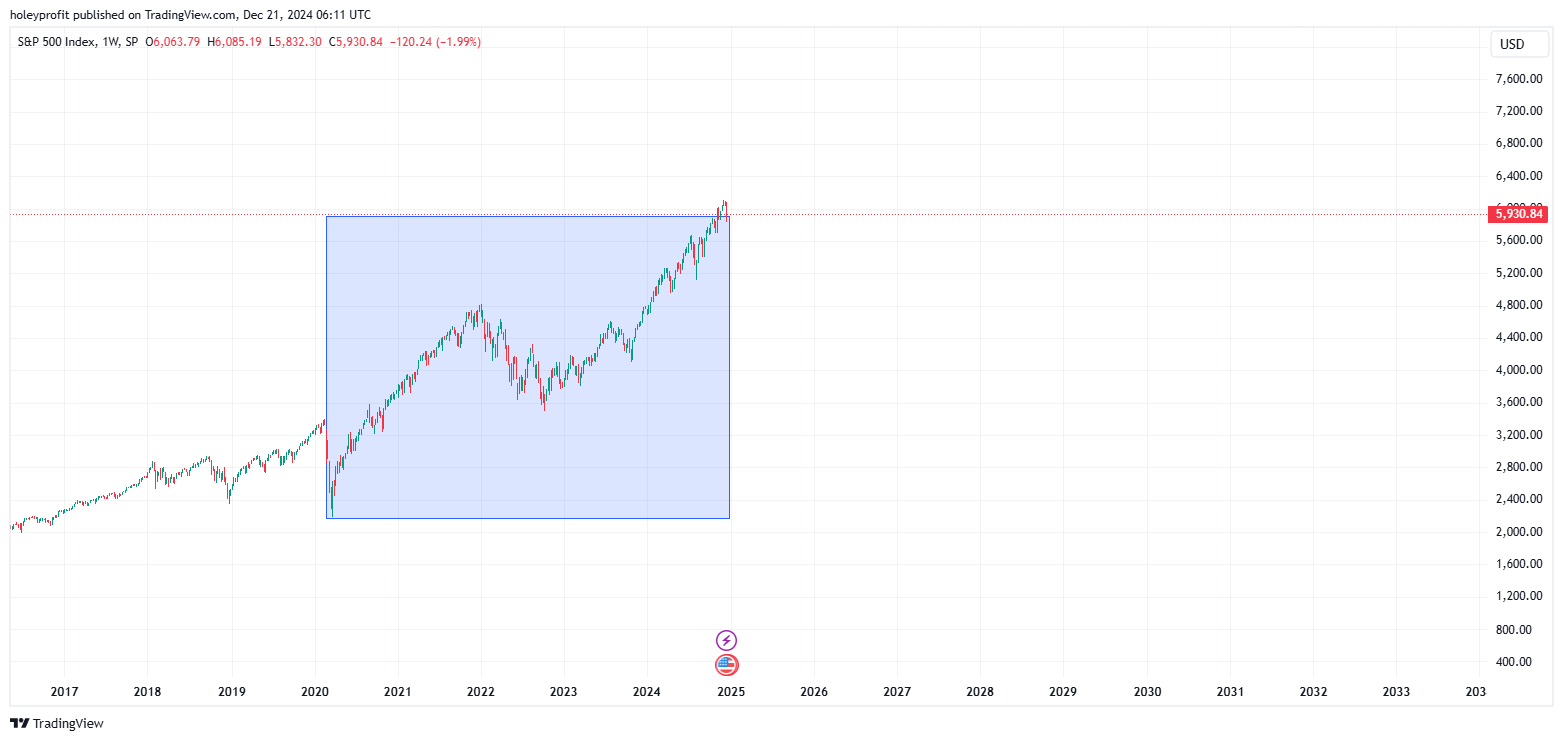
Logically, that could only happen if markets either started to close to straight up or straight down.

How this would work in a crash setup is very obvious. In 2018 we entered the expansion of vol. Since then we’ve been up and down increasingly quickly. Now we’re heading into the spectacular crash event where the short vol trend reverses and overshoots to the upside.
Makes perfect sense. Whether you think it’ll happen or not, would be a logical conclusion to a volatility reversal and blow off.
However, the same thing also would make sense inside of a developing bubble. Where we head into an exceptional move up, this move takes us back a bit over the mean and then sets up the big hyper vol event (the drop).

If something like that happened, after the dramatic swings the market would probably begin to range for a long time - bringing the reversion to the mean (and probably the inevitable overshoot under it).

I think the case for us having entered the start of a “Volatility bubble” in 2018 is good. If that were the case, what would be predicted up to this point would have been increasingly wild market swings (check) and more and more unrealistic seeming things hitting. Which has happened to now.
The forward looking forecast of that would have to be building into a fat tail event. With this series of odd things we’ve seen recently being the building blocks of something far bigger and odder.
The TA
All of the above is rather academic to me. I think it helps support the thesis but it’s actionably useless because it’s hard to determine how one would know if they were wrong betting on this - or even what direction to be betting. But this does also sync up with the TA, which implies a massive inflection point.
Here’s an example:

One of two things has to be happening here. NVDA is either inside of a W spike out above the major resis (implying a massive drop) or NVDA has broken the resis, used it as support and we’re inside an extremely strong uptrend.
The 4.23 is such a major level. If this is a massive W top above it then this heavily implies there will not only be a decline in NVDA but it will be in a spectacular style.
But if the 4.23 is breaking … then the thing to do usually becomes draw extension fibs on the last big pullback and start again.
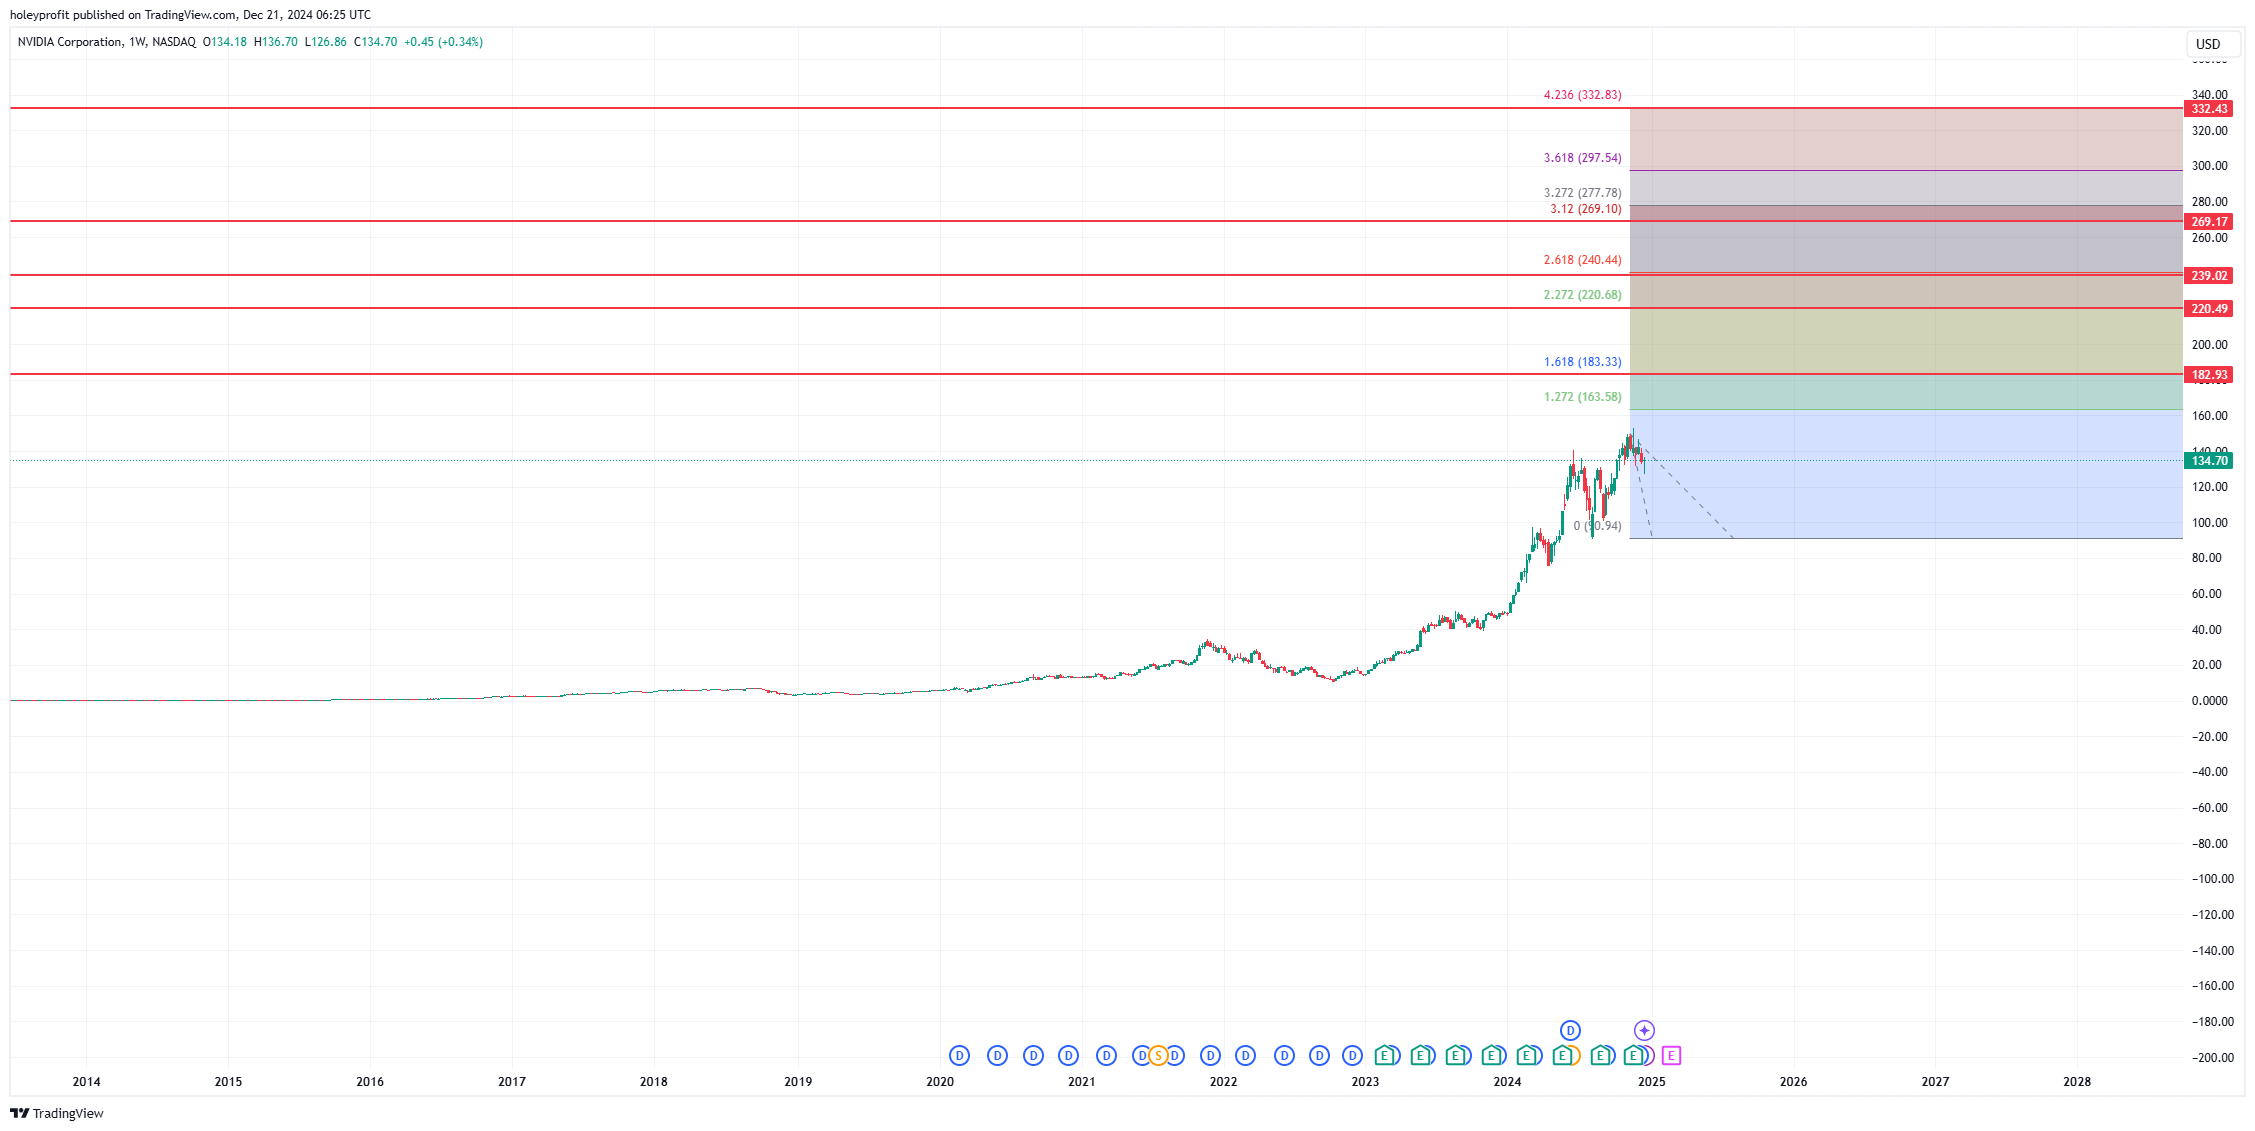
Maybe we run all the fib levels and the next 4.23 produces the 1.27 correction.

If the reversal comes here in NVDA it will be a simple butterfly.

Easy risk to spot. Simple trade plan to make for the breaks to the downside.
But if this fails, then this all looks a lot like this spot to me.

That was the point I noped out trying to fade this rally. I’d faded the common resistance levels. All of them were okay for reactions but they all broke.

When that butterfly failed, I dropped the bear thesis until we hit future fibs.
That really is the case now with all the big pending harmonics we have. I shorted into them (because they’re usually good for at least a reaction) but if these fail, I think the bear case in indefensible and all the things I find useful predict markets begin to go parabolic.
Interestingly, that was also the price we pulled back to in 2022.

Lots of different things all suggest the same story here. If you take the bear perspective on NVDA, this has to be a head forming.

If you take the bull perspective we have to be inside of Elliot wave 3, which would be expected to get increasingly stronger.

A butterfly top = Crash.
A head and shoulders = Crash.
Failure of both those patterns = Strong up.
Elliot bull = Strong up.
Or, Elliot Bull = Crash.

I think this creates a polarising decision where later it will be seen we are either at blue or red.

In this post I’ve focused on NVDA because it’s such a perfect example of the pending things. It’s a perfect 4.23 spike out range. Ideal butterfly structure and all fits inside of easily chartable waves from either a bullish or bearish perspective - but these big decision points are on everything.
Technically, the case for a major decision to be made in the current areas is flawless. There are so many big levels (fibs that could have been drawn years ago) all filling on different things at different times. To me, it seems incredibly obvious a big decision has to be made here and the following trend dictated by it.
And I believe it would be illogical based on the TA norms of a trend to not see the action in the next leg of moves surpass what would seem like reasonable expectations now.
Upside or downside, I think we should see extremes.
====
Please note this theory is not to be blindly bet on without a plan and backing analysis. The main purpose of this is to bring context to speculative bets we’re likely to take based on the possibility this tail event thesis comes to pass. Either move would be a great opportunity.