

The Confluence of Huge Bearish Harmonics

The recent rallies have brought us to very interesting levels for indices. And we concurrently have pending bearish harmonics in various big stocks.
Let’s first look at the indices and the big levels that could have been foreseen as a pending harmonic level as early as a couple years ago.
Here’s an excerpt from a late 2022 post talking about the possible AB=CD

Original Post: Could be a critical week for the bear case.
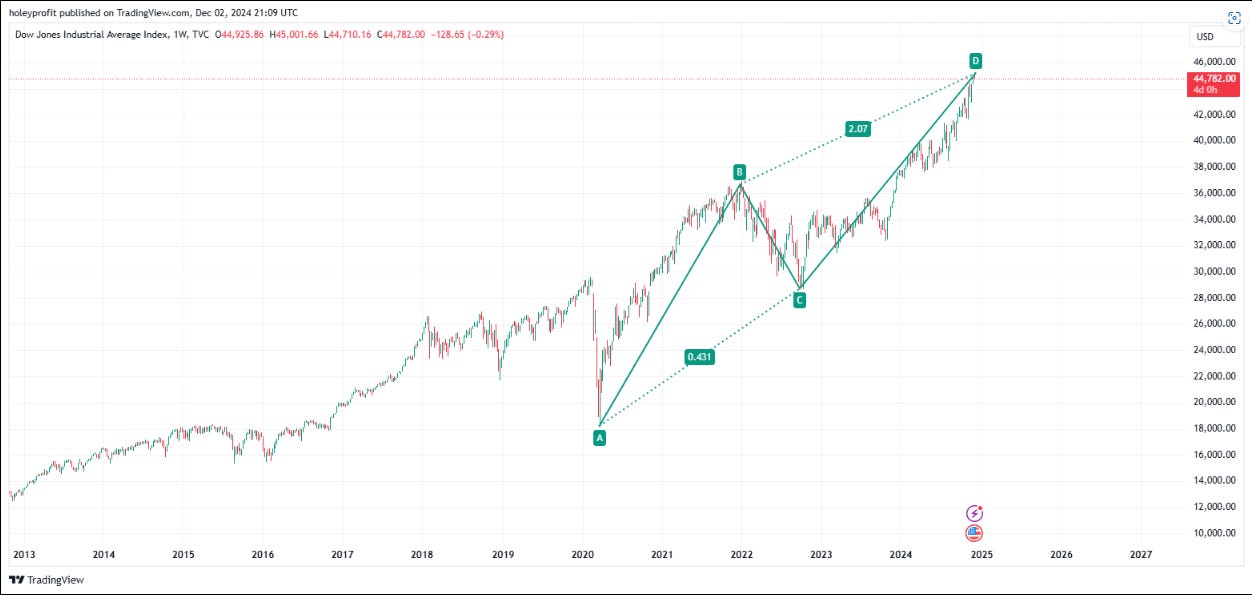
I’ve seen big reversals with AB=CDs a lot. Where there are “Twin spikes” that act a lot like each other in terms of size and style. With the second spike always tending to be more aggressive (because it’s a D leg, and D legs are always most aggressive). Never anything on this scale, the big pending AB=CD is a huge setup.
T "could-be “Twin spikes” are at this point.

Both not only the same size but the same style (A style that was not common previously) with the second rally being a little more aggressive than the first. A bit steeper in the climb - which is incredible, because 2021 was a hell of a climb. The condition to surpass that in the D leg was not an easy one to fit. But we have.
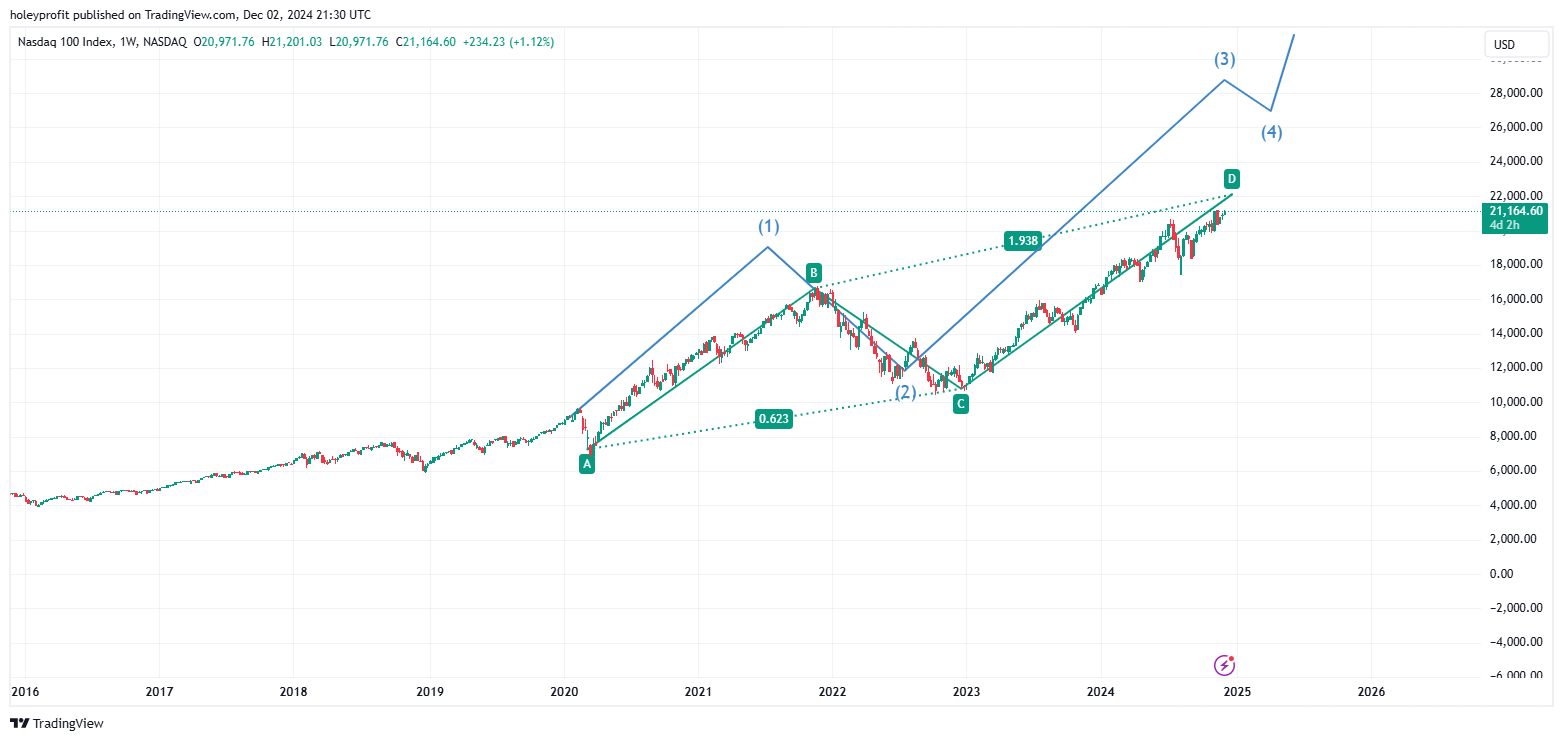
We have the same on the other indices, too.

Let’s be clear on two things.
a) The AB=CD would be a hyper bearish pattern.
b) By necessity false AB=CD moves appear in a developing uptrend.
The potential AB=CD could also happen inside the middle of wave 3 in an Elliot wave uptrend. Inside of a new Elliot wave it would be a given a failed AB=CD would form. Required to, as per the EW rules. There has to be the wave 2 pullback and wave 3 is bigger than 1. Thus during this at some point a AB=CD will form and fail.
But in the times the harmonic pattern does produce a reversal it’s usually hyper aggressive into the reversal zone and then far stronger in the reversal.
We can’t really put too much into the AB=CD thesis’ on the big chart indices alone. They flag up important inflection points. In a broad picture they tell us levels that could be important but using big charts gives a wide range things can happen in and the AB=CD will form even in an uptrend - so we can’t rely on it.
What we can do is we can look to see if we have other interesting patterns heading into it. From these we can identify more specifically levels where important bullish breakouts are made and where the high RR fade points are. If we have smaller harmonics formed more recently inside the big harmonics range - we use them.
And we have a lot of interesting harmonics on weekly charts in different big stocks. We can use these to give us a good idea of where the next big swings would be likely to go in a bull or bear move.
Let’s look at the biggest stocks, sone of which have picture perfect harmonics.
When harmonic patterns form, they almost always lead to a major trend decision. I really can’t think of any instance of that not being true in my experience of trading. Even when we’re talking 5 - 15 min charts. There can be bluffs and indecision, but when the harmonic succeeds or fails a clean trend move comes.
The formation of large harmonics is always a great thing. The odds of making good money when they have formed is very high. It’s usually possible to forecast not only the direction of the move but also the style of the move (strong trend, shallow pullbacks) and you can estimate where the move goes to (common fibs).
Here are some really interesting ones.


The rules for how the harmonic top should form here are unfortunately fuzzy. Book rules are very clear. If you try them a lot you’ll find they’re fuzzy. The best thing to do is to prep to short inside of where might be spike outs of important levels. Having tiny stops and big pay off. Long breaks and repeat at next fib.
Classically the 1.61 extension is where the butterfly completes. I’ve seen many instances of parabolic head fakes to the 2.20 and even times when it’s spiked out the 2.61 or ran all the way to the 3.xx fibs and reversed there, resembling more of a crab pattern than the original butterfly.
Again, the key to deal with this known variance of where the possible true reversal level may be accounting for all known risks is just to plan to trade inside of the possible spike outs of the resistances and have a long bias heading into them - at least avoid being short before a major fib hits, they usually will hit.
Harmonics enthusiasts could have long detailed discussions about different formations and evolutions of patterns. I find that stuff interesting in theory but in practice I don’t care all that much for that as much as just using the ideas to help me work out what fibs may have higher or lower odds (or be more important breaks).
Based on that, here’s the generic things to look for in spots like this when we have clearly defined, built up over many candles (can be any timeframe) W structures in an uptrend. If there’s going to be a reversal, it will typically be;
Slightly past the 1.61: Some head fakes. Maybe a head and shoulders etc.
At or slightly before 2.20: Hyper parabolic jump to 2.20 in this setup, then turn.
2.61 spike out: 2.61 will usually spike a little but make a strong reversal if it holds.
2.61 is a polarising level. Most of the time, price is going to move fast away from 2.61 (after ranging for a while, usually). Does not matter if we’re in a bull trend that will go on and on, a bearish reversal starting right now or inside the final stop run before a bear trade comes - in all instances, the move from 2.61 is usually a fast one.
2.61 reversals will tend to at least retest 1.61 and more often spike out 1.27 (which is a big move relative to the risk zone shorting a 2.61 spike out) and breaks of it will typically go parabolic with pending resistances 3.20, 3.61 and 4.23 (4.23 will usually fake a reversal, spike out and then reverse).
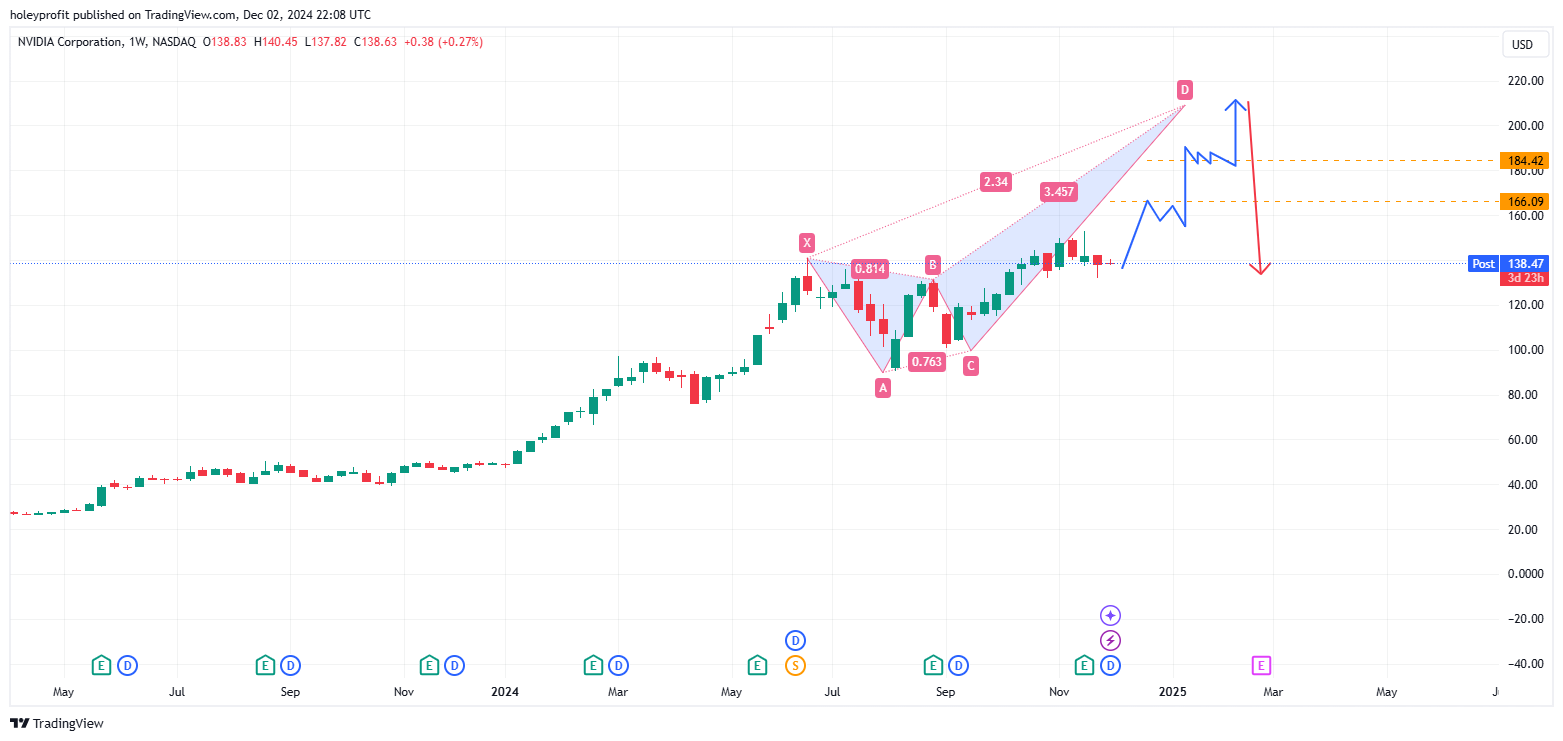
Let’s convert all of that into an easier to understand format by running through a real pending example. NVDA currently has the classic 1.61 top. This can be the top. Very hard for me to believe after all this it’d be that simple on NVDA, but the 1.61 is the first big possible top level.
If 1.61 breaks > Usually see parabolic to 2.20.
One possible bear trade plan is after that has happened and we begin to reject then we can bet on the high being in using stops right above 2.20.

If the 2.20 is a total non event or s shallow stall we usually see a strong spike to 2.61.

Note, these biases of the 1.61 break leading to the 2.20 rally and the 2.20 - 2.61 move being a strong one if it happens are apt no matter what the overall setup may be. They’re valid expectations in bullish trend or bearish reversal. It’s very common the move between these levels will be strong (and usually fast).
When the 2.61 is hit we’re at a major inflection point. There are a few paths we can take to get to the 2.61 (variances mostly around 2.20 pull back or not) but when we get a little past the 2.61 we’re always thinking about the same polarising setup. Either it’s strong continuation or strong reversal.

When we have a bear setup that is blowing off, this will typically be a 3.20 - 3.61 spike and then reversal (crab pattern).
Even in a bullish trend by this point we’re usually close to a pullback. This is commonly wave 5 of Elliot and will spike out 4.23 and pullback.

(Exceptional breakouts if 4.23 is not resistance).
The most bearish thing one can hope for when short a 2.61 break is there’s a parabolic D leg to the 3.20. Making it a spot to be very cautious as a bear. Do not be stubborn or unprepared on where the stop loss should be.
Frustratingly enough, this is also the spot where it can be highly rewarding to be a bear with just a little bit of tolerance for head fakes. Some of the best, easiest and most obvious (if you like fibs) turns come around the 2.61.
In the 2.61 reversal we commonly see there being the spike out. We trade above there for a little while. Often with a smaller harmonic or head and shoulders. Then we return quickly to under the 2.61. Hold a retest of it and then we’re starting to head into a move that will become capitulation.

Key take Away Points on Pending Harmonics
All of the complete underlying theory to this as it pertains to my understanding of book harmonics and book Elliot wave combined with my rules and observations from trading fib levels could get really dense. The breaking down of all the things that suggest it’s “Quite likely” we’ll get reactions like this around the fib levels when big W’s form would be a very detailed subject (far more than covered above).
Really the only thing that it’s important to know is where the potential reversals could be and understand that if you’re wrong the predicted move would a sharp and strong move against your position. This is the actionable thing you need to understand to know how to short where there is high RR but deal with the momentum risks.
There are very big differences in the implied future outcomes of a 2.61 breaking in a bearish crab pattern than a 2.61 breaking in a bullish wave 3 - but both of these just predict the same thing. The market will be consistently strong until (at least) the next resistance level.
In this post I’ve pointed out some of the big obvious W’s on the big charts and you can easily go and find similar examples and draw the fibs on now. It does not matter if your bias is bullish or bearish, or what way the market goes, these fibs will usually be useful for breakout, target and reversal levels.
And Back to Indices
The above segment is entirely generic. It’s just a set of rules I use every time I see a W (or M in downtrend) pattern and I find these norms happen more than chance would suggest they should. It can be equally applied to the NVDA weekly chart as the EURUSD 5 min chart.
Or the current SPX chart.

Do we have a parabolic jump to 2.20 on the 1.61 break?
When started, is our move to 2.61 strong and consistent?
Now we’re at the 2.61 level.

This is where we usually have a polarising decision.
2.61 shorts can be lucrative but are logistically tricky for many reasons. The 2.61 is usually going to spike out so if you want to fade momentum you have to be willing to short above the 2.61 accepting the risk of the crab or being fully wrong on the trend direction producing hyper strong moves up.
There are ways we can plan for more developed short signals. For example if we got a 2.61 rejection here we could see a big head and shoulders.

With a clean trade coming on the 2.61 retest.
I think a 2.61 reversal usually looks something like this.

What I like to do here is accumulate bets that will do extremely well if the big reversal comes and make nominal losses otherwise. This might be via deep OTM puts (usually via spreads for theta) or lots of little shorts that either have tight stops or I am concurrently trading long and exiting longs at resistance for short exposure.
This is my main plan for the coming weeks/month ahead. While we’re a little above the 2.61 but we’re not going parabolic, I’ll look to accumulate a speculative short position to benefit from a drop of over 20% and make nominal losses if this move does not develop.
I’ll build this up incrementally and likely buy dips to big support levels if there are any intraday to offset shorts into spikes.
Whichever way it goes, there’s a high probability that we’re going to see the polarised decision now the 2.61 has hit. One direction or the other a big clean swing is likely.