
The Giant Harmonics Are Filling
The Giant Harmonics Are Filling
Fate of the overall trends likely to be decided by the harmonic patterns.

Time and time again during the running of this newsletter I’ve proposed the idea that when harmonics form, a trend decision almost always follows. There has not been a single instance of this concept failing in the time we’ve ran this newsletter. Over many years of me using it it’s proven to be most reliable thing I know.
The swings over the previous years have now started to form into weekly pending harmonic structures. If the tendency for harmonics to mark major decisions plays out, we’re now into the spot where we have the market setting up to reverse or a breakout is going to be made which would heavily skew the bias towards continued bull runs.
Harmonics are the most accurate method I know of for forward looking forecasts of where swing highs and lows form. They’re useful on small charts for day trading and they are particularly interesting when they form on big charts. Reversals from harmonics happen in quite precise areas, apart from the wick risks.
Here’s an example of a successful harmonic at the high of the GOOG move heading into the 2020 crash.

This was a really obvious pattern to see setting up in real time. Here’s a forecast I made on GOOG during the formation of this pattern.

Accurate in terms of the high. Some errors in the drop and the target low was not quite met.
In the rally out of the 2020 low there would be big failures of potential harmonic continuations and these would result in a strong uptrend.

So here in 2020 when we first sell from the attempt at a new high, this was fair game for a harmonic reversal. When this failed and broke back over the 2.20 fib, the case for a bearish reversal was heavily diminished. A strong sign for bears to be more careful (And in retrospect a good exit signal for bears).
The warning of failure of bear patterns was consolidated by the failure of a potential harmonic at new highs.
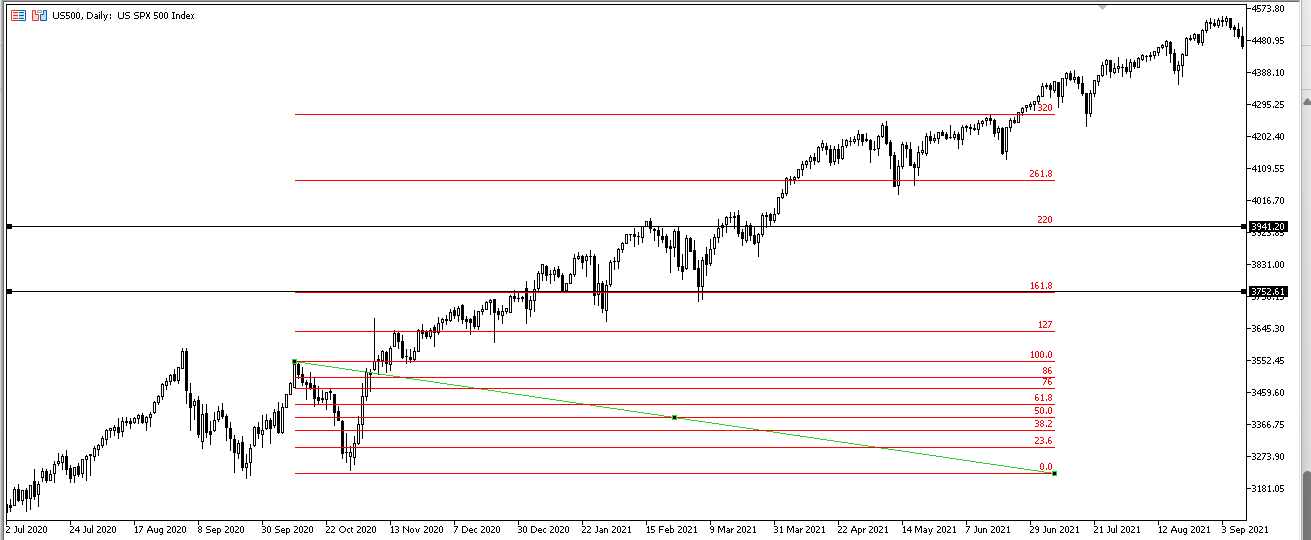
Once these harmonics had failed, the trend was clear and persistent in the other direction.
And this is what we can reasonable expect from harmonic patterns. We’re going to see a strong reversal in compliance with a specific style* and contained inside of predictable levels. Or we’re going to see the reversal pattern failing and the failure of this pattern is confirmative of a continuing uptrend.
*Specific style being it will be extremely strong into the final leg but the reversal will be stronger than the rally.
Harmonics are our friends.
But unfortunately there are some other things we have to expect from harmonics that can cause a lot of strategical difficulties when it comes to trading based on them. For one, you may have noticed in the failed versions of the harmonics we covered there were various false starts. It looked like the harmonic was working.
Major resistance levels can cause reactions that are not reversals. Which can be very problematic. Especially if the strategy used is to short after a confirmed sell signal. Because you end up shorting the lows. I prefer to short into rallies. That’s problematic in itself, but at least I can lock in profits if price reacts but does not reversal off levels.
We need to keep this idea of reaction rather than reversal in mind if we do start to see bearish action off the harmonic reversal zone. Tricky spots can emerge in the future if it’s a false start and you take the perspective of the market must be reversing and it’s time to pile into shorts.
Let me illustrate. If you know (Made real time forecasts and trades) that a big harmonic pattern can do this:

What does this looks like?

The low or the load up point?
You’d be quite within reason to be thinking we may be here.

A big bull trap before the aggressive second section of the drop. You’d know to expect a rally but you’d think that rally was a prime opportunity to scale up.
If you scaled up into the rally using good retracement rules, you’d be feeling really good about it by this point.

Maybe add some more here. Right? Clearly working out.
Then this:

During this time you have to make some really good decisions and you have no time. The way this move happens always tends to be incredibly abrupt. Here most of the move to the new high happen over just a couple of days. It looked really bearish right before the biggest up days.
The break of this was a great exit signal for bears.

Now we have clearly defined what it is reasonable to expect from harmonic patterns and also the risks we have in false starts off harmonic patterns, let’s look at the current harmonic patterns and how we’d apply the usual harmonic rules to them and where we think the major decision levels are.
Big Chart Harmonics
Big chart harmonics do not form very often. It takes multiple swings to build up harmonics. Volatile up/down action. Extreme volatility into the completion of the D leg. The build up of a “W” shape has to have a lot of aggressive turns in it. When dealing with trending assets, big charts rarely form these.
So it really is a point of interest when they do.
Big chart harmonics present spectacular opportunities but they also have a lot of challenges. The main one being the potential reversal zone is quite wide. Both in terms of distance price can travel and time it can take to do it there’s a lot of space to be wrong while being overall right.

Compounding this problem is the known trait of the D leg being parabolic. Which means you absolutely have to factor in that if the level you’re betting on is not the high it’s almost certainly going to make an aggressive spike to the next important level. Progressively aggressive spikes are most common.
And that’s talking about the times when you’re right.
So you can see how it’s important to put some thought into how you’ll go above betting on things. While being right, you can expect to have various challenges. If wrong you can expect to be spectacularly wrong. You have to keep this in mind especially when it starts to feel like you must be right based on recent action.
There are two things you can do, and both have their risk. You can short into the resistance zones using smaller chart signals for entries. Or you can wait for a big sell signal to form and then get in after that. One has the risk of there being no weakness or aggressive stop hunting and the other of flipping bear close to a low.
To summarise, our main issues to deal with are;
Large potential reversal zone.
Known trait of extremely aggressive final move.
High probability of counter-trend if signal fails.
Convincing false starts. Complying well with bear signals, initially.
These are the things we need to deal with to be able to convert theoretical harmonics knowledge into actionable viable trade plans.
Let’s now look at how we can have the best chance of dealing with all of these issues in the current large chart pending harmonics in indices.
Keep reading with a 7-day free trial
Subscribe to Market Forecasts and Trade Plans to keep reading this post and get 7 days of free access to the full post archives.