

The Macro Case for Indices Having Reversed.

During the last month we’ve seen SPX trade 100 points swings everyday and never once breaking the downtrend during this.
That’s pretty much unheard of. I’ve never seen that. I have been short during every major SPX decline since 2019 and none of them were this easy. This consistent.
Look at it.

Now, I want to share you with the full context of where this is happening and why this might be very important.
Let’s start with the overarching swing analysis. If when the 2007 high had broken out you’d know to draw a fib from the high to low of that move, the projected levels of that would have hit every single major swing in the following decade.
4.23 Extension

People can, and do, write long and detailed explanations of how all of these events were caused by the fundies - usually wildly unforeseeable events.
But ….

This general structure, is something I know. I use this roadmap of a trend for day trading (and other time frames).
If you read my work often hopefully you can see all my classic trades in here. The 1.61 break. The 1.27 retest. The pull backs 2.20 - 2.61. Hyper strong in the 2.61 breakout. And in this template, the big resistance zone is the 4.23.
4.23 Exhaustion Reversal Strategy - by HoleyProfit
Excerpt:

=======
Now … this template is not done based on the SPX weekly chart. I’ve been using this since before 2020. Long time before any of the stuff happened at the upper fib levels.
In this template, the implied area we’d be now is here.

In the stop run of the 4.23. If you were a reader of this NL in late 2022 you may remember me both showing how the current top was 4.23 and speaking about the blow off risk of it. That move has now complete.
Let me show you some big 4.23 turns to help add context.

2009 was a 4.23 low. Flipping the chart, it looks a lot like SPX now - right?

1929 DJI was exactly the same.
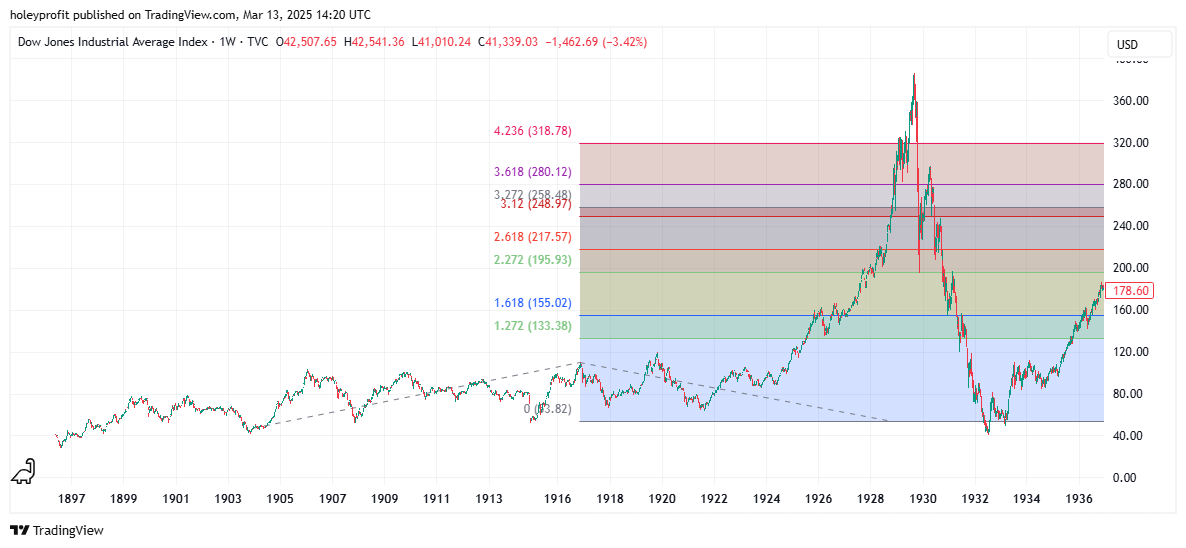
Here’s something to look at … let’s zoom in. We’re looking at specifically the candles coming off the top in the DJI back to the 4.23.

Notice anything about those? Notice how those were solid candles (probably bouncing a bit intraday) and this was a totally different tone in the market from previous sells. The market had dropped before but always more jaggedly and/or quickly and recovered - this was the first time that solid selling was present.
The early warning, if you will.
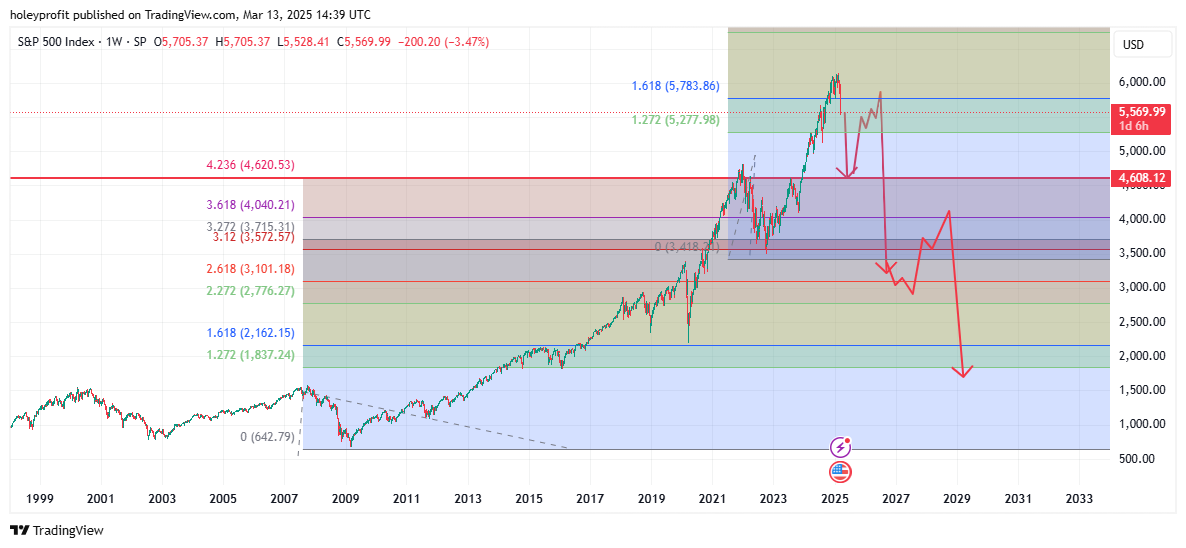
And now we go back to our beloved SPX.

Hypothetically, if SPX was copying the DJI model … what would be the first thing we’d have to see? We’d have to see a top in the right area and the EXTREMELY UNCOMMON condition of a consistent downtrend. We have these in place now.
In the copy model, this would continue until 4500.

Bull trap and then trend failure.


That’s the 4.23 thing. Which COMPELLING. To not think the 4.23 is going to be an actionable decision level here you have to be unaware or ignorant of the fact that we’ve made the predicted reaction on every previous fib level for the last decade (though all the news storms) - or you’d have to believe for some reason the 4.23 (which is the most important fib) would be meaningless- despite everything working before.
Which would be entirely irrational, to me. I’m not saying now we’re at the 4.23 the market has to crash. I’m saying 4.23s are binary decision levels and if the market rejects the head fake of this, this is entirely consistent with reversing markets. So we’d not have to worry about it, unless everything got really weird over the 4.23 ….
Macro Elliot
Bulls like to say, “When in doubt, zoom out”. And that’s very comforting if you don’t know the structure of Elliot wave. But if you do, you can look at this and see perhaps EVERYTHING inside of the last 50 years has been Elliot development. If that’s true, we’d be in wave 5 - the end.

This is a perfect expression of the Elliot pattern in all ways.
Use the log, bro.
When I cover this stuff someone always tells me to use the log chart. I understand the theory as to why, I’m just not willing to ignore the tangible evidence before my eyes. People who say you can’t use standard charts to make useful forecasts on these big timeframes - simply do not use the methods I present.
If you do, you can see they’ve worked all along and all along people will have made the case for it not working. The fact people don’t think it’s a thing, has not stopped it being a thing.
Were this to be Elliot wave 5, we’d concurrently have the final leg of the uptrend and the 4.23 spike out. Both of these would be exceptionally strong in the last leg and then turn into surprising weakness. Given the previously strong trend, everyone should want to fade this weakness (which is happening).
The 1.61 Head Fake
Soooo, if you have the 4.23 fib draw and if you’ve been in doubt and zoomed out and noticed the entire chart looks like a fully matured trend leg, the thing you’d have to ask yourself is if this is a spike out, where will it end. How can I determine the spike zone for a breakout - because I don’t want to short an actual rally.
And of course our go to for this is to fib the last pullback and see if the move rejects at the 1.61.
Exactly what happened.

I ask you, as much as it seems far fetched to make extreme bear forecasts on SPX, would you agree if you knew to draw this fib, knew the basic structure of Elliot, knew the 1.61 spike out and also knew in a rejection from a 1.61/wave 5/4.23 spike out has to be strong and consistent … what do you think the odds would be of seeing all that?
The market going in this specific zone. Trading sideways for 4 months (Odd, in itself) and then entering conditions where SPX moves 100 points a day and makes zero bullish progress. It really doesn’t even move enough to scare bears using simple SR levels.
What are the odds?
The Big Picture
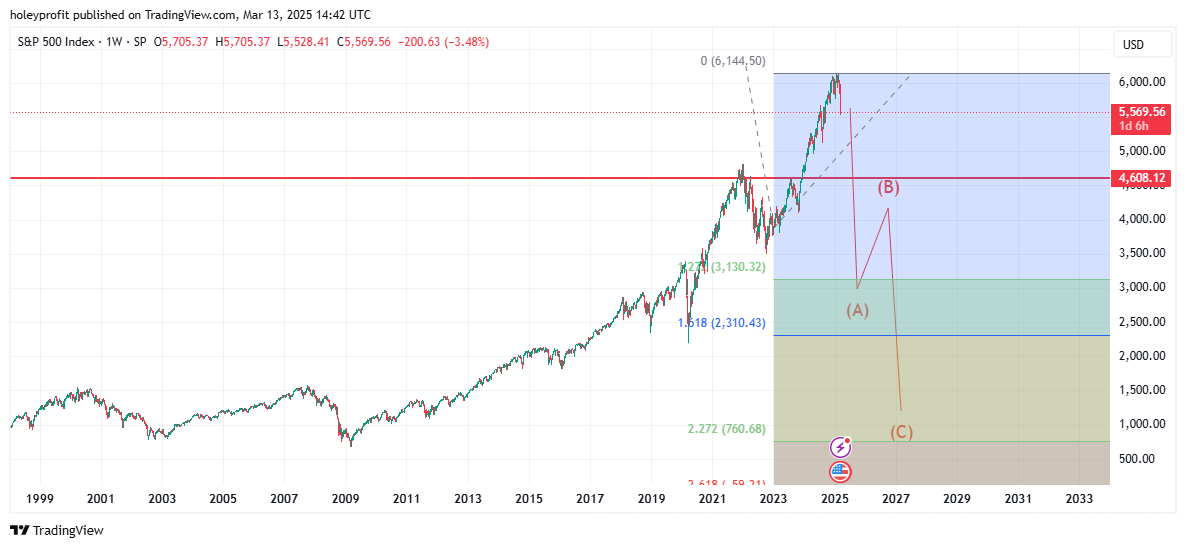
A full play out of this move would have the first major (and note “Major”, there will be insane bull traps along the way) bounce would be the 2.61. And then from there down to the 1.27.
This is very simple charting;
It agrees with the Elliot ABC thesis.

It agrees with the 4.23 topping norms, which is to trade at least the 1.27 again.
And if we assumed a high was made and mapped in the topping swing this agrees with the classic 1.61 bounce, break and crash setup.
If the condition remains true that we are just outright dumping from the 4.32 spike out, it should be considered something might have changed.
It’s very important to understand almost everything people use as a reference for what to expect in SPX comes from the action before the 4.23. But if one were to take the thesis the market gets stronger and stronger into the 4.23 and then it reverses, this would mean all we have seen does not tell us what we will see.
In fact, it would be grossly misleading.
It may be the case SPX has made the parabolic breakout. Traded sideways long enough to slowly sell off into the bulls (We did dump EVERY TIME we hit a certain level, everyone thought it was fun while we bounced back …) and now we might be in the actual unloading period.
Where everyone who did the big bullish things a long time ago sell their stuff to the people who feel they’re qualified to tell you what bull things to do now.
It’s possible we’re witnessing only the early stages of a dramatic underlying shift in the market. One where everything that was, now is not.
This is a very serious thing to consider.