
The time to panic may have arrived.
The time to panic may have arrived.

SPX Swing Analysis
22nd September 2023.
Time Frame Used: Daily / 4 Hour
Overview
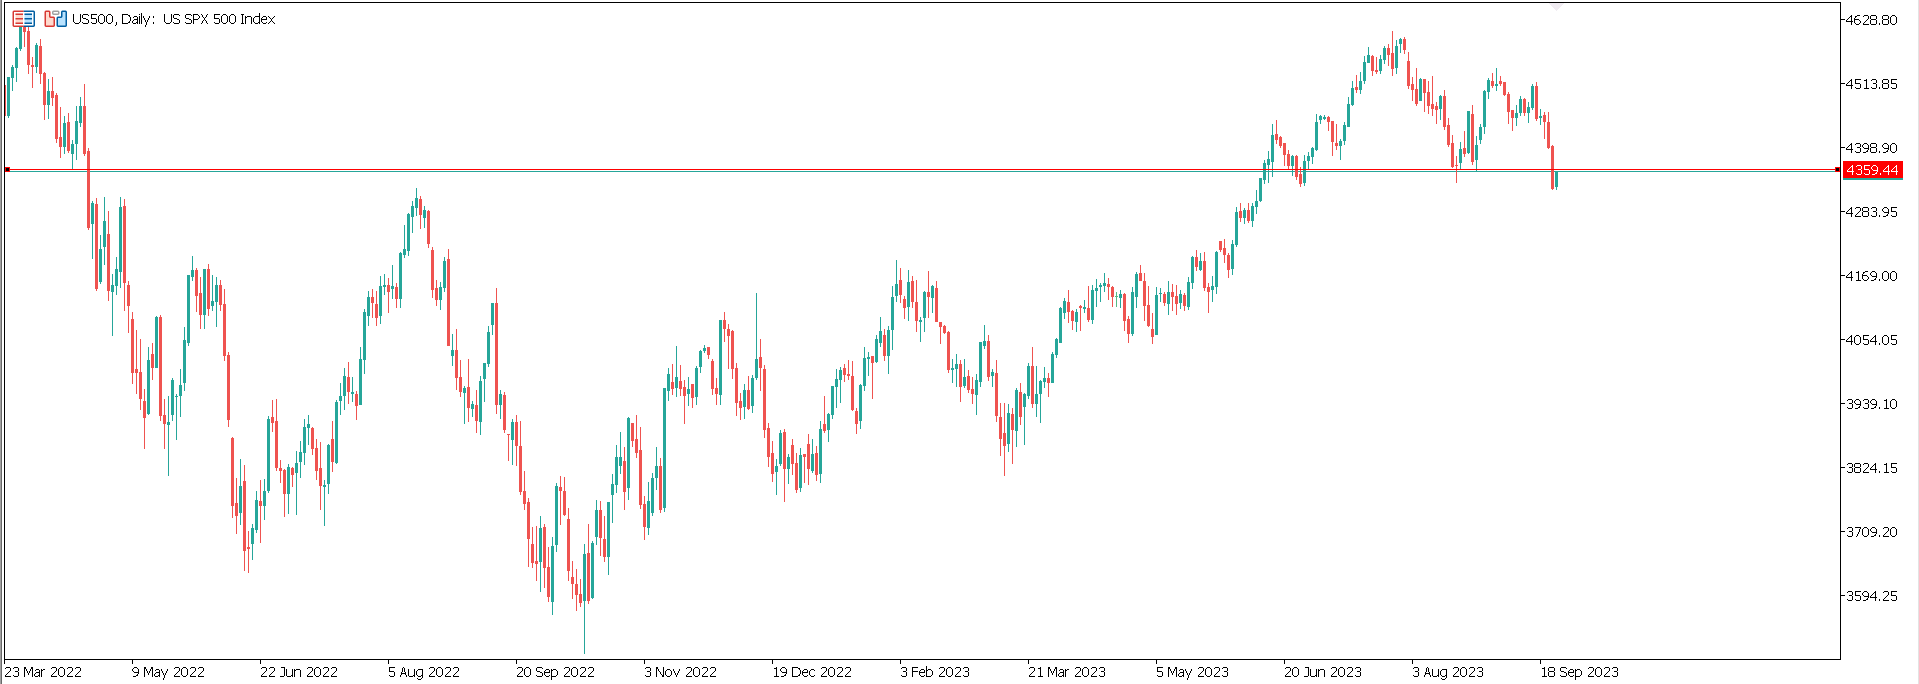
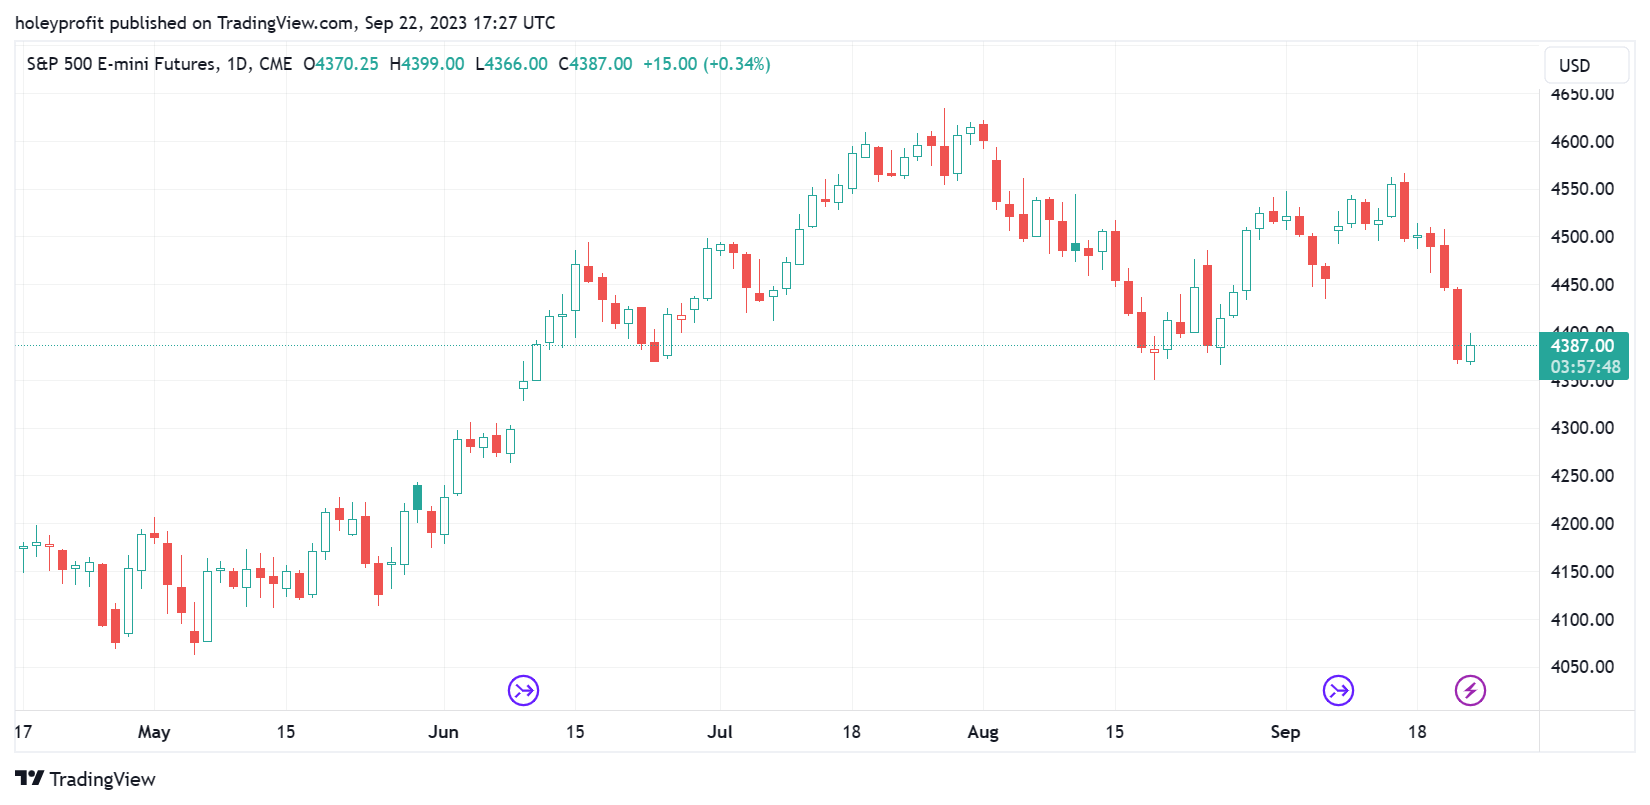
We’re at what is frequently a critical point. In the below chart we’d usually be seeing a bear leg entering into wave three or a two leg correction in a bull trend. Both of these are trend setting moves. In theory, the direction of next 500 - 1,000 points should be being made in this area.
Odds are firmly tilting to the bears after this recent drop. Here’s a full breakdown of bullish and bearish considerations.
We have really interesting action recently and inside the context of our major SR levels this has a lot more potential to become vey important. I’ve made the case previously for the scene being set for some sort of fat tail event and us seeing this on the daily chart could be the first really big hint.
It’s possible we’re in the early stages of a bull trap failure. In all previous crashes it’s been possible to get a good idea of how far the crash will go based on ratios of the bull trap. The size of the crash has always related to the size of the bull trap - 2023 would have been a very big bull trap.
The bull case does not look good now. A bull case hinges on this being a tricky false breakout. It would seem very technically unlikely at this point, but I’ve learned with SPX a good rule to follow is if you always assume you’re going to get spiked out you’ll be wrong eventually.
Either way, we’re now trading inside of the zone where I think we have our best chance of forecasting the next 1,000 points once we see what happens here.
Both sides would point to extremes. The angel of the SPX rally in 2021 was 70 degrees. Angels never soften in an uptrend like this, they steepen. The implied move if there’s any type of bullish move (Be it trend, nominal spike out or something in the middle) would be insane.
If it goes the other way, we’re very early in what would become a generational defining bear move.
In this analysis we’ll weigh the bullish/bearish cases. Provide primary and secondary trade plans. Major support and resistance levels and real trading signals. We’ll also look at the worst types of moves for the strategies we are using and the conditions where we’d want to sit out and wait for things to get better for our strategies.
Bullish Points
The bullish points really are not all that great at this point. Bears have firmly taken the technical edge recently. While two leg corrections happen all the time, not usually in this area and in this context (76 fib rejection). To be blunt, the SPX bull case is SPX can make it very tough to be a bear.
From the setup we have here any move higher in SPX would be considerably likely to a very strong one. Multiple different things suggest that a move that would be essentially vertical would be most likely. I know this sounds extreme - but it really is just based on the most common outcomes when various things converge.
If SPX were to go into an 80 degree plus uptrend, that would obviously be a high RR event. The known is the market might go up and it might go down but we have it strongly implied that if it goes up it’s extremely likely to be fast and strong. Since 2018 all new highs have got more volatile, this would likely continue.
The potential for hyper RR on with the right type of bets where you can lose pennies but make a lot if it hits is attractive. It’s attractive enough that one could reasonable make a good maths based argument for continuing to make speculative bets on a new high through several 100 points of SPX dropping. Would make sense on paper
In practice as far as I am concerned SPX needs to rally very soon in such a way that breaks the litany of huge bear red flags (Which we’ll cover next) to have any bullish bias. The only positive thing that can be said for the potential for this being a bear trap now is SPX can have really horrible bear traps.
But I think we need something to prove to us we’re in a bear trap now. It’s best to act as if we’re not.
Bearish Points
We have textbook bear stuff. Honestly, SPX has made me so cynical that I find it hard to believe it could all end up coming together in such a simple way. It always seems to have one more trick. Of course, the final trick may be no trick when everyone is expecting one - like BTC 100K.
If the bear move comes off as it currently looks like it may, this will be the time you get the best of this newsletter. We’ll be in a textbook bubble popping in a textbook format and I know a lot about that. The amount of hours I’ve spent researching basic bubble structure and designing actionable trade plans is … vast.
You’d not be reading this if I didn’t know how to do that. I only set up the “HoleyProfit” username in 2021 to talk about this. I came to teach bear market strategy and chew bubble gum, and I didn’t even bring bubble gum. Chunk Norris consults me before he ever buys anything.
If we have a crash which conforms to the historic norms, I know what to do. Years or prep have went into specifically the SPX/Nasdaq trades and the strategies designed have been extensively stress tested and shown their worth during the 2021 memes/crypto crash, 2022 everything crash and not being short the 2023 rally.
I never make promises about what the market will do, but I can promise you if we go into a classic crash - I know what to do.
And the case is looking great. In a previous post I posted the below chart saying this was the swing bear case but it needed to see some serious selling to support it.
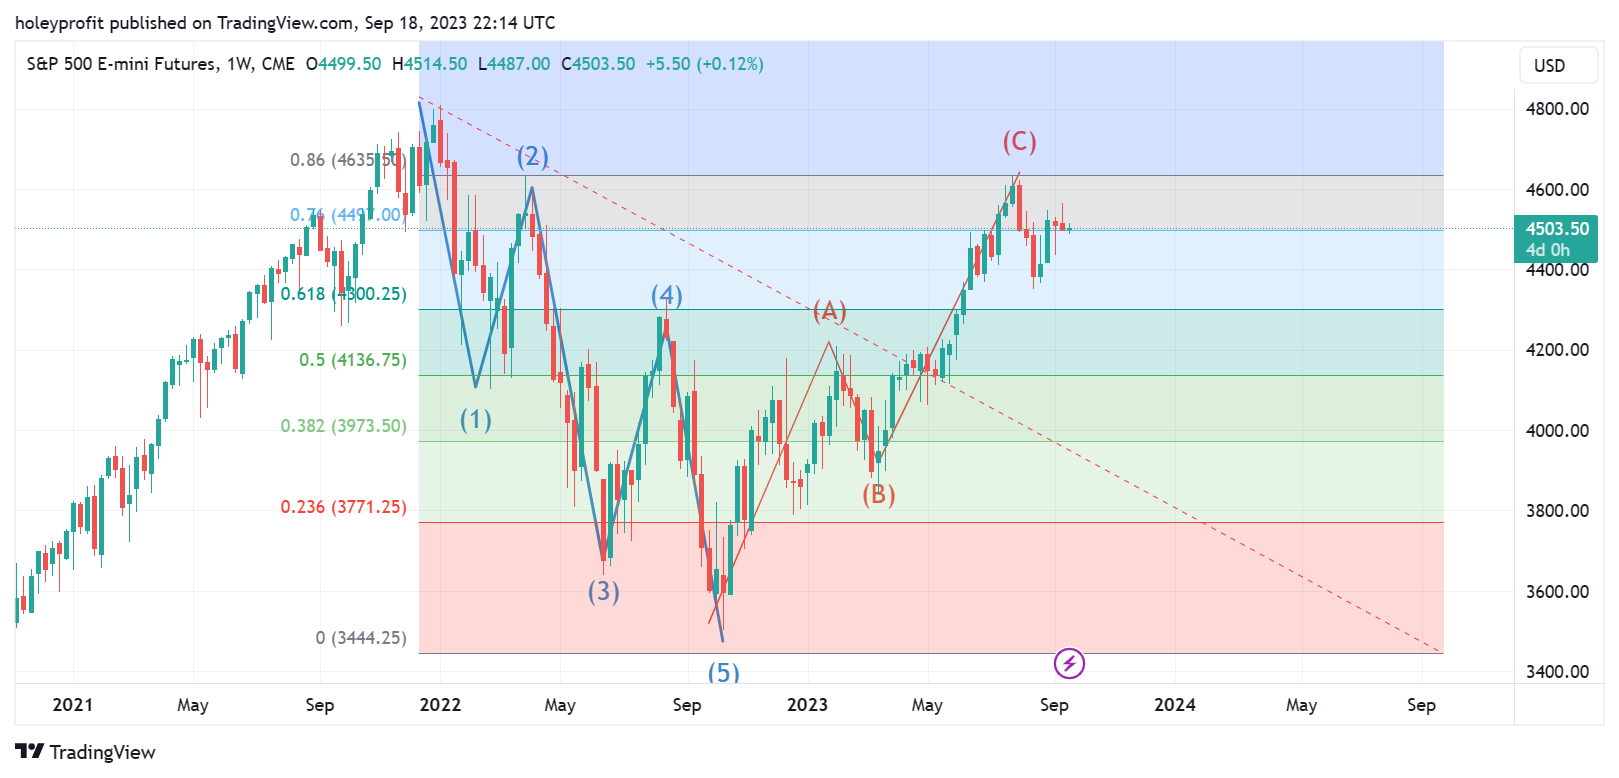
Since then we have!
The macro forecast would imply we’re in wave 3 of a weekly downtrend. Which is really an incredible thing. For this to be proven correct what we’d need to see was steady selling with all the rallies staying inside of previous highs. Bear breaks gaining a lot of ground and not giving up much in retracements.
Very rare and it’s exactly what we’ve seen recently.
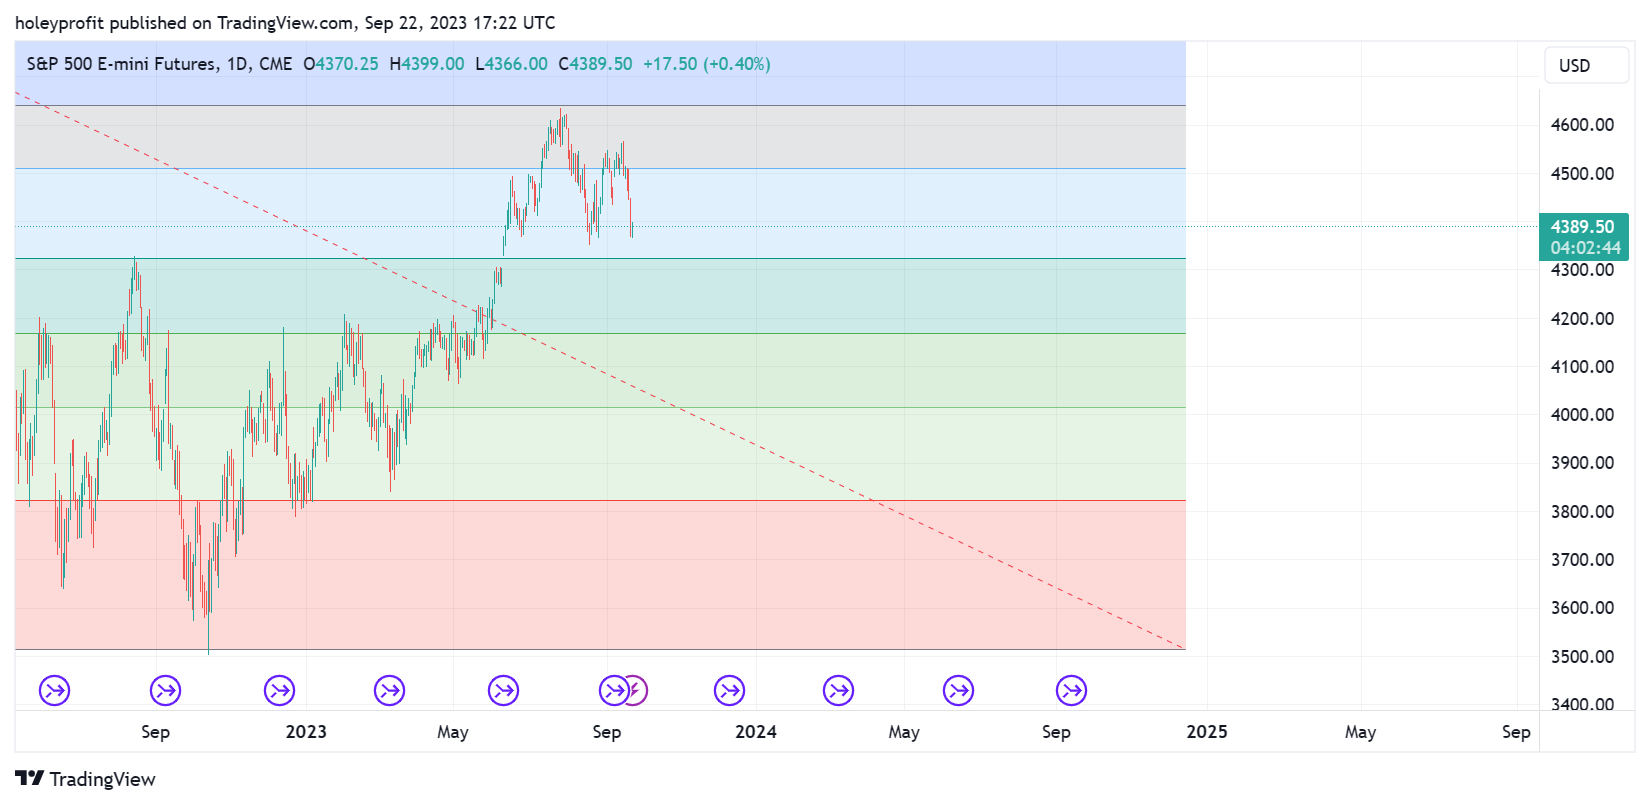
For the bear case to be further proven it demands this condition stay in place. We only have shallow rallies inside of the local drops and we then make strong bearish advances to new lows. What we should see in wave 3 is very specific. If it happens, we should follow it using stops above previous highs where the downtrend would break.
Previously I’d said these W like shapes worried me as a bull.
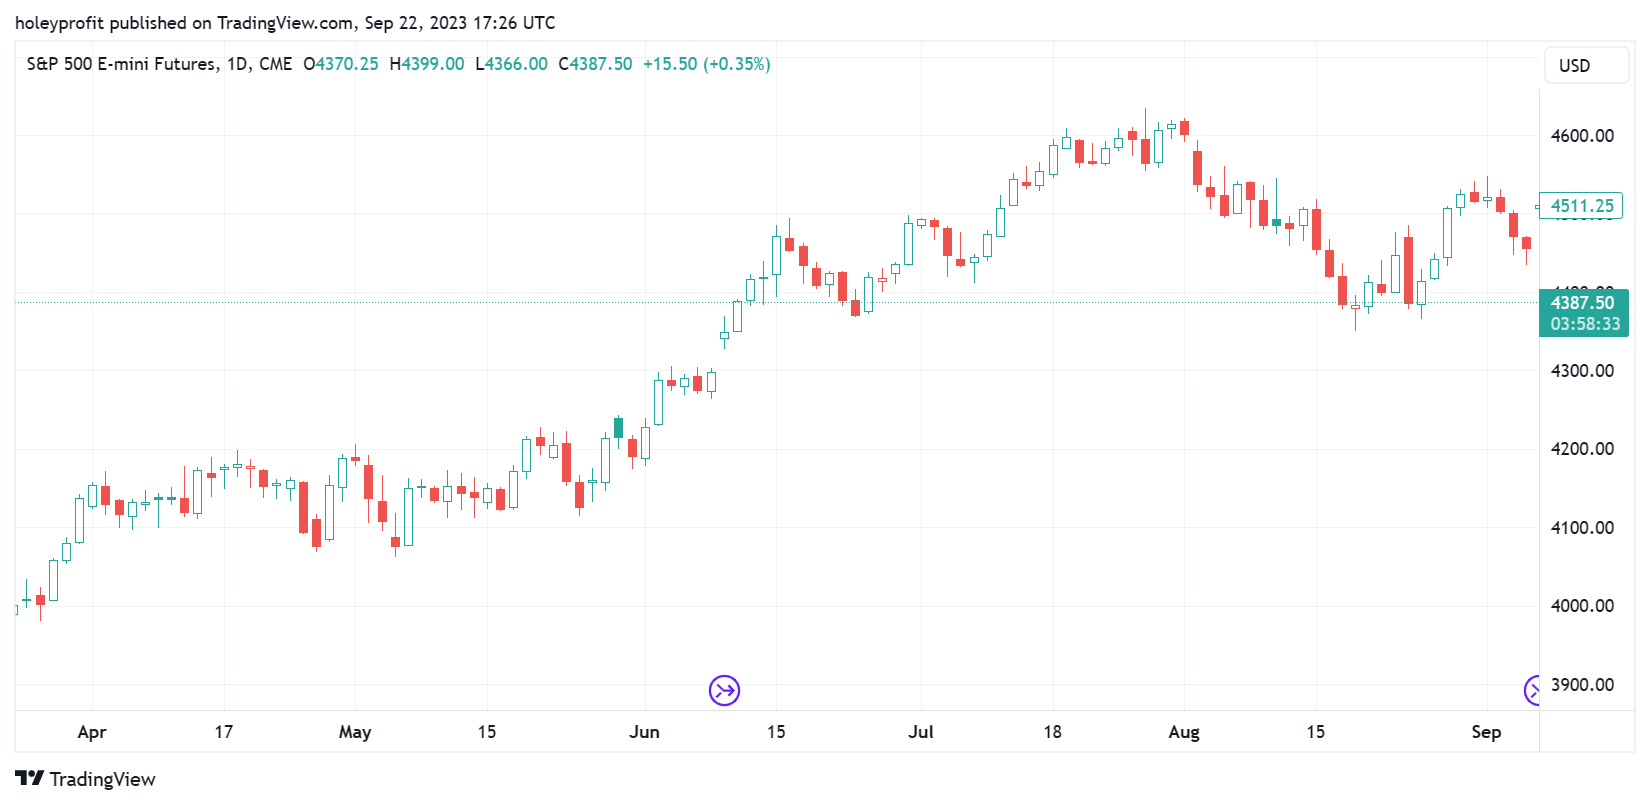
We rallies and I really did think I’d been overly cautious thinking a break might come but this does not “Worry me” as a bull, this knocks the bull right out of me.
This worries me as a person, because these shapes come before some super sketchy moves. Ones that would seem to have real world effects. As a bear, this is starting to look like prime big trade hunting conditions. Because these shapes really can foreshadow the most spectacular of moves.
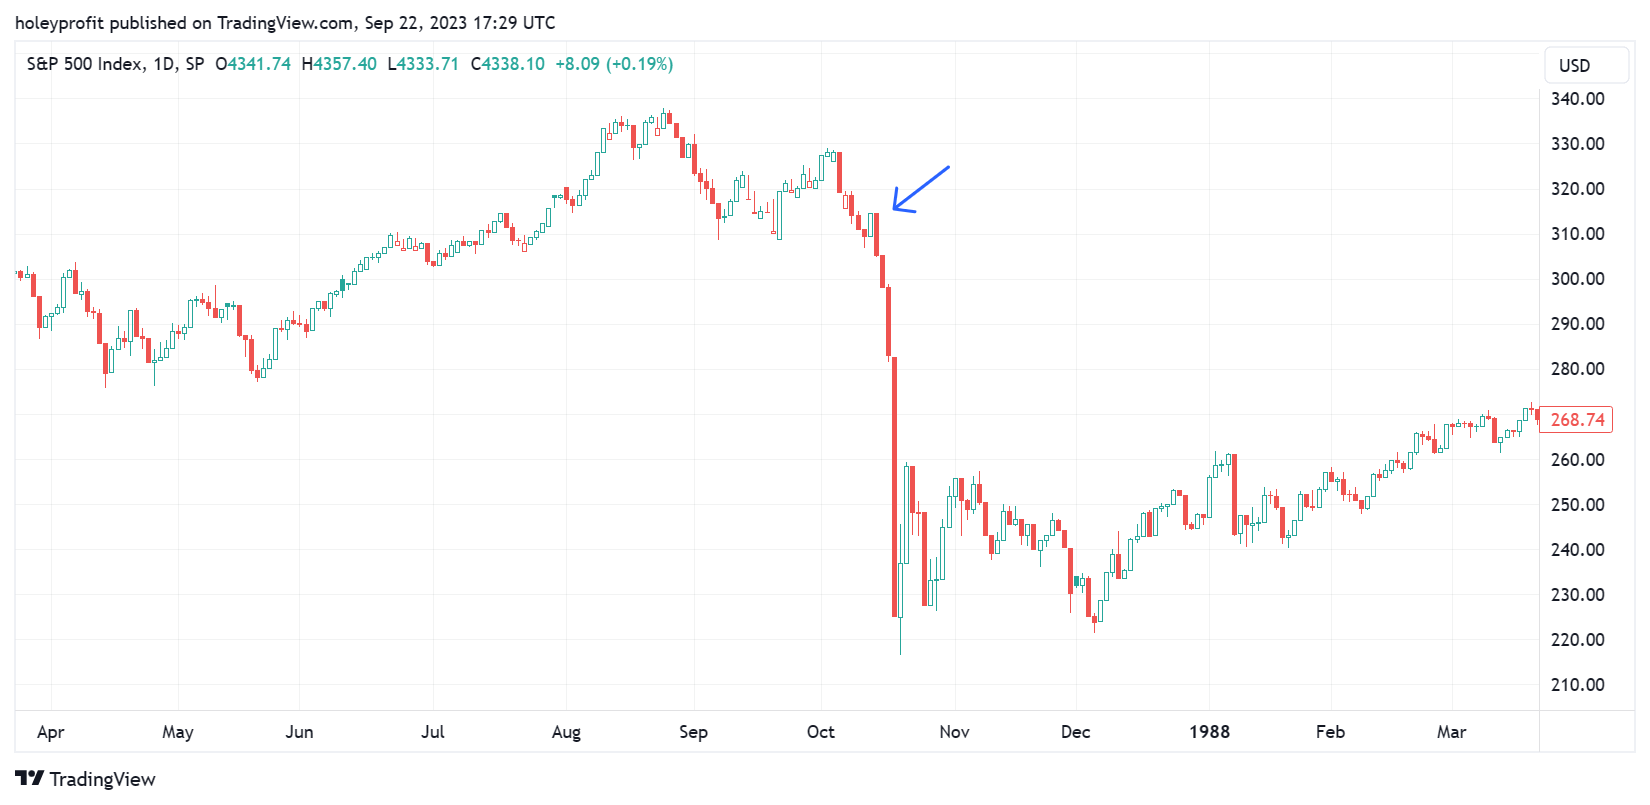
Do you think we could have used the 1987 “W” like shape to help us with downside targets for the crash? If you answered you no you must not read a lot of my stuff.

Classic 4.23 Exhaustion Strategy
Do you think we’re now going to extrapolate that onto the current SPX chart? If you answered no; Welcome, first time reader.
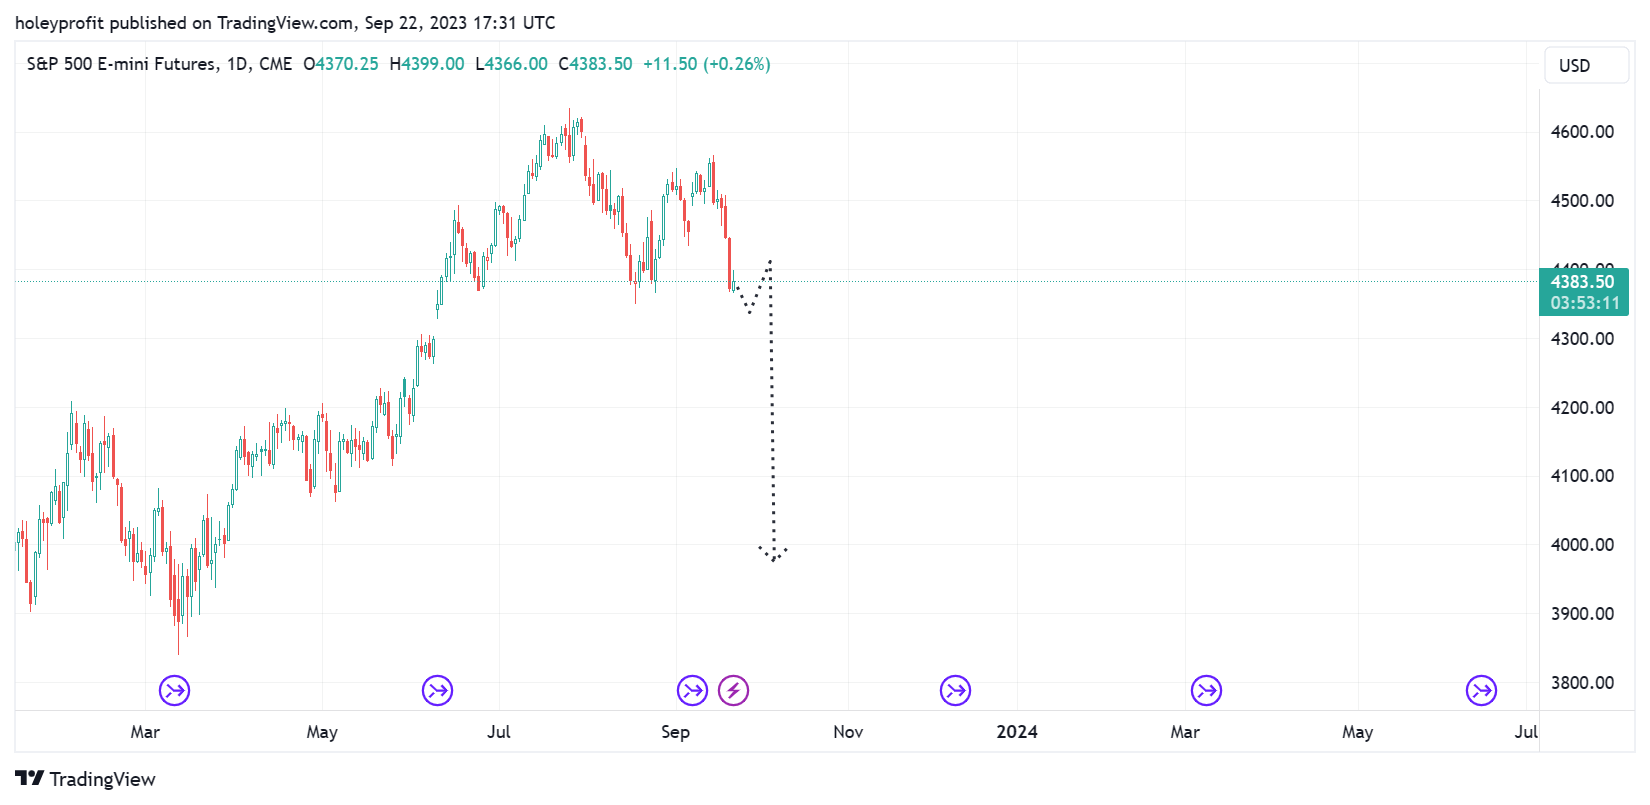
Okay wait - Before I do. In your mind think of where the most crazy obvious level would be for a first big target and some sort of oversold bounce. Usually in a downtrend you’d expect to see this after some significant breakout - right? Breakout, retrace a little and then trend again.
Something like this:
Things matching up and making sense is important to curb any unintended curve-fitting. Based purely on how a breakout forms, we’d forecast the exact same move as the 1987 guide. Confluences of signals helps to filter out innate bias and random noise - this would “Make sense”.
The worrying thing about that (If you find the concept of being within touching distance of a society disrupting market/world event worrying), is this would be sequential. If that swings hits - then it has filled the same conditions on the weekly chart. The same prelude pattern and the same capitulation into the low.

From here, it would be far more speculative to bet the market does not crash than to bet it does. Which is almost never true.
And I do mean crash. Not go down a lot - crash. Big chart capitulation.
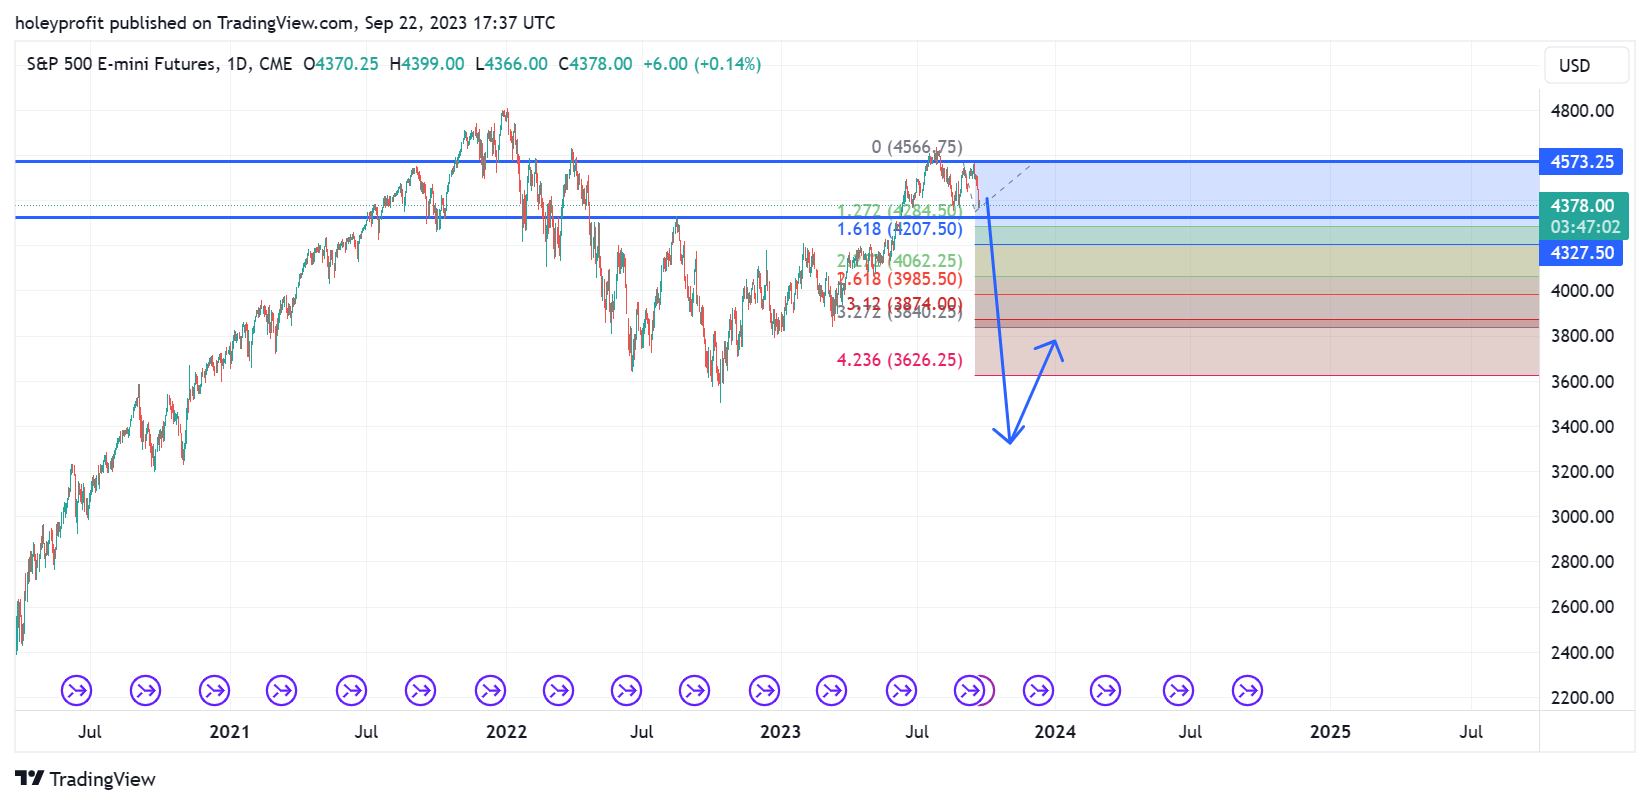
It is time to take extremely seriously that we are making the first of a sequence of three critical breaks that would make a crash an overwhelming probability.
Further to that, the odds of the second and third level breaking I’d say are over 75% if the first level breaks. The third level looks set to break. Bulls would need a miracle here. I’ve noticed that’s when they tend to perform best. I still remain in “Believe it when I see it” mode for a bear break.
Thing is, now I am seeing it. While it has not yet full developed - it’s now the better bet. And absolutely it’s time to ditch bull positions. It can go too far too fast to risk it.
Lot of real trade plans and detailed analysis over the weekend. We’ve been more quiet recently because there’s not been much to say. We’re waiting on a decision and have defined the conditions for both ends. Now the market may be tilting its hand, it’s time to get into actionable plans.
Probably busiest weekend ever for this newsletter in terms of posts coming. This really is the most interesting spot I’ve seen US indices in - ever.
Disclaimer
The information provided by HoleyProfit Newsletter is for informational purposes only and does not constitute financial or investment advice. We do not guarantee the accuracy or completeness of the content. Readers should conduct their own research and seek professional advice before making any financial decisions. HoleyProfit Newsletter is not liable for any losses or damages resulting from the use of our information. Use this newsletter at your own risk.