
Understanding Spike Outs and Reversals
Understanding Spike Outs and Reversals
Real time small chart example related to larger timeframes.

In this post we’re going to cover some of the things we should expect to see in a false breakout and rejection of it.
I made a video for this using real time analysis example but the sound quality is terrible (I got a new mic but I’ve not set it up properly it seems). Unfortunately since it was a real time analysis I can’t redo it. So here’s the video so you can see the charting forecasts and I’ll covert it into blog for clarity.
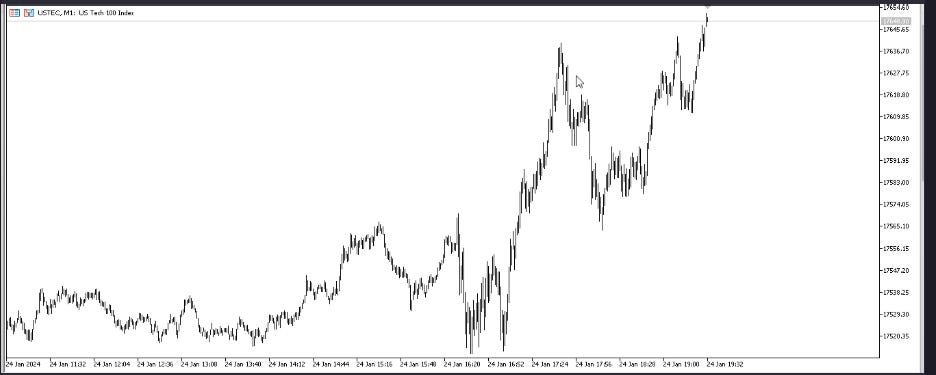
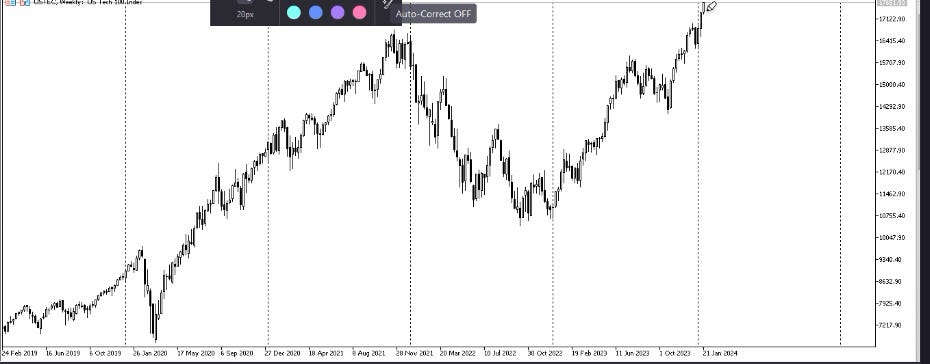
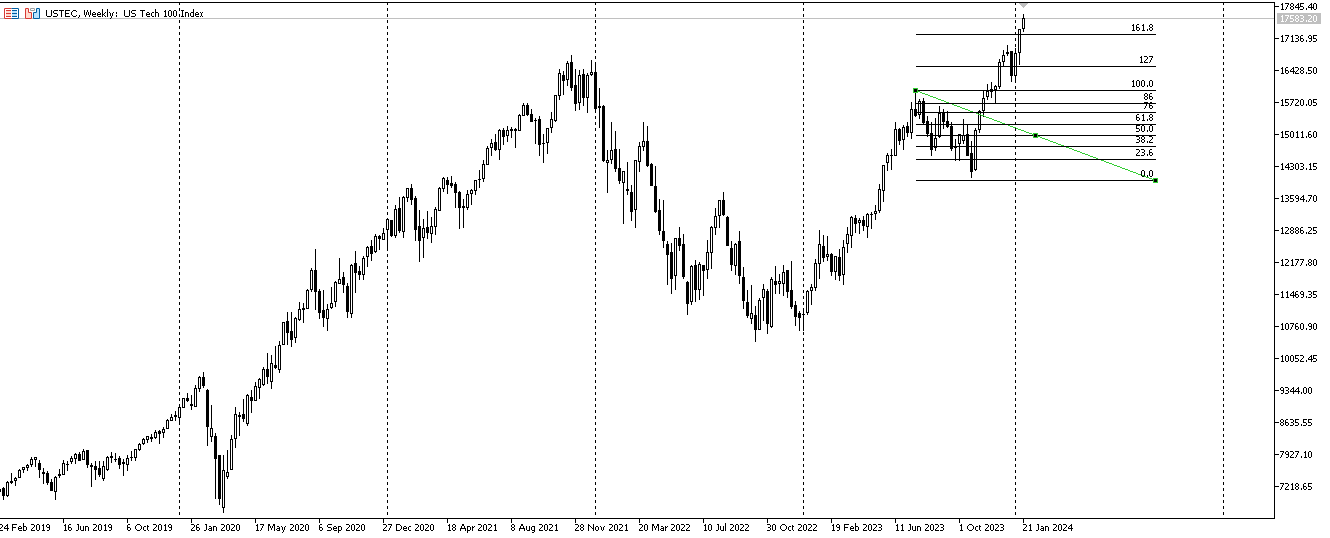
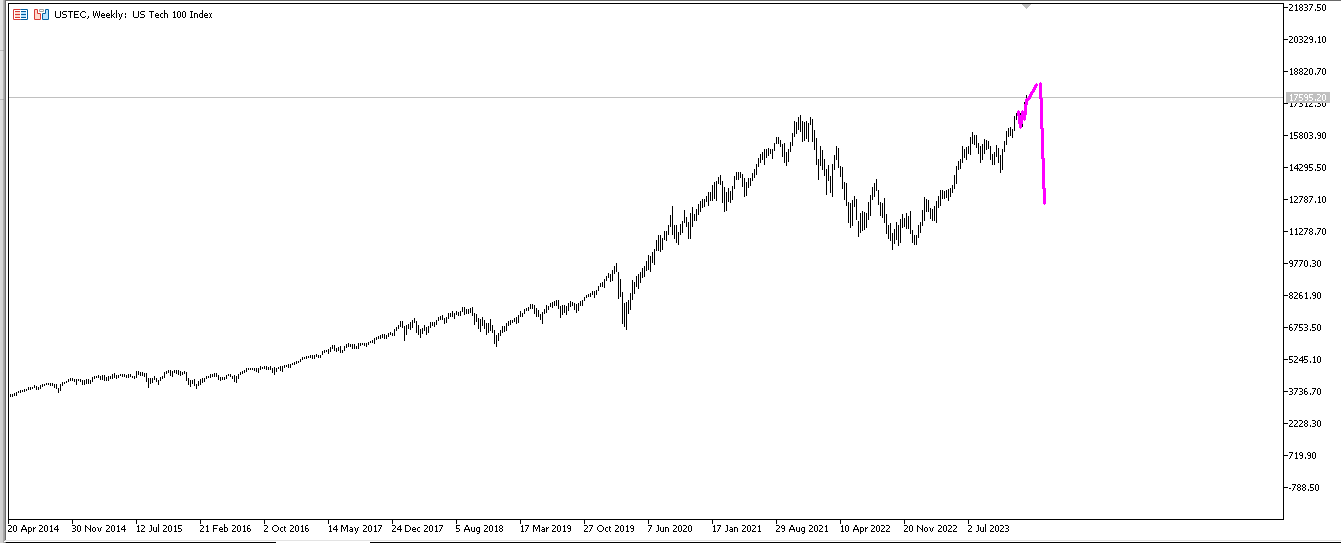
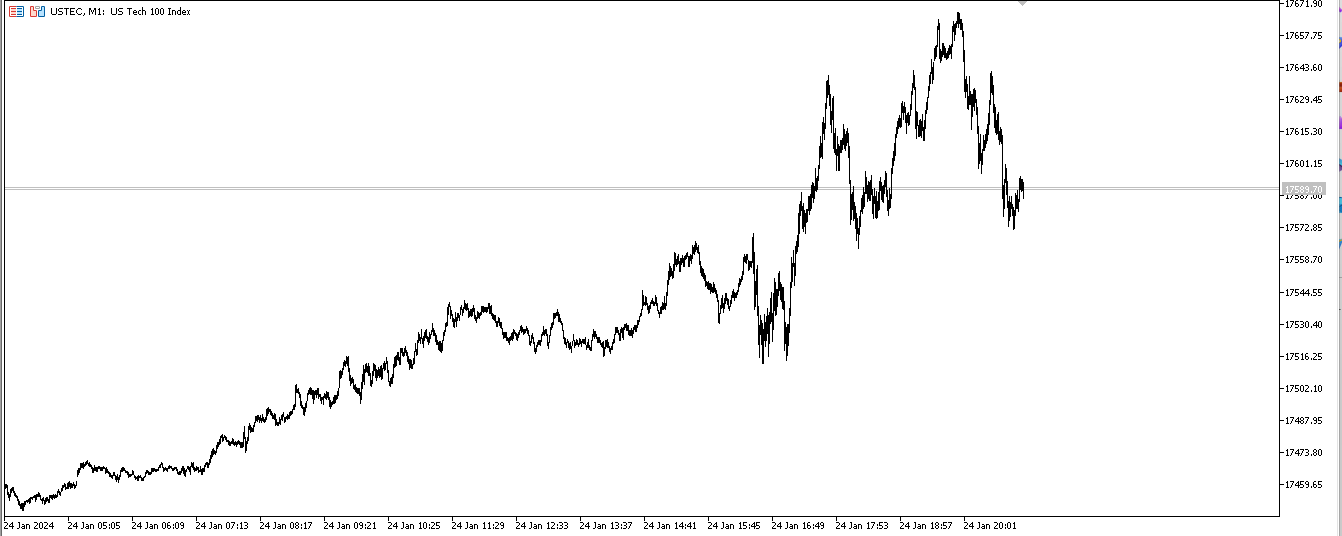
The premise of the video is the Nasdaq 1 minute chart looks a lot like the Nasdaq weekly chart (At time of recording).
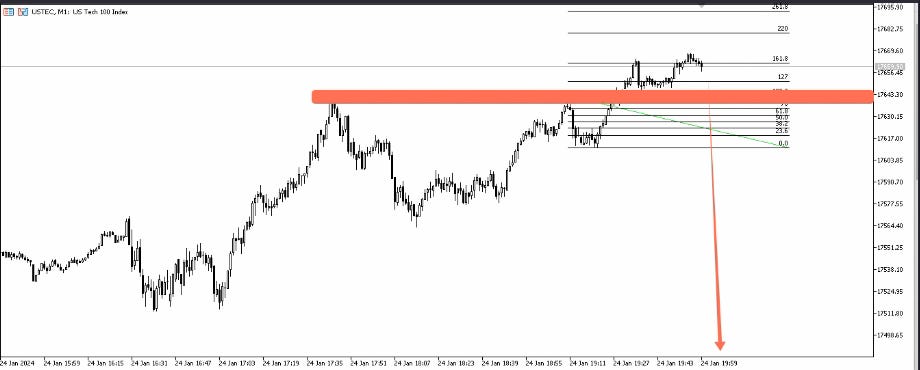
One minute chart;
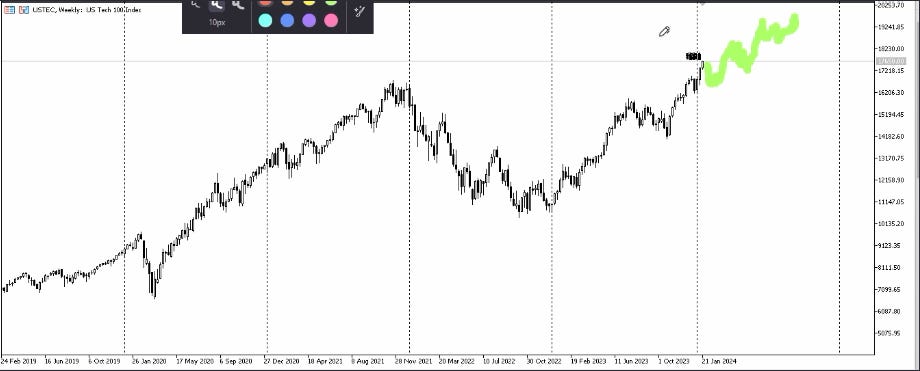
Weekly chart;
The video proposes that most of the main stages of the small chart and big chart move are similar. Having pullbacks and recoveries in similar areas.
And it makes a forecast of a typical false breakout having some sort of false start, nominal spike out and then entering into a sharp drop.
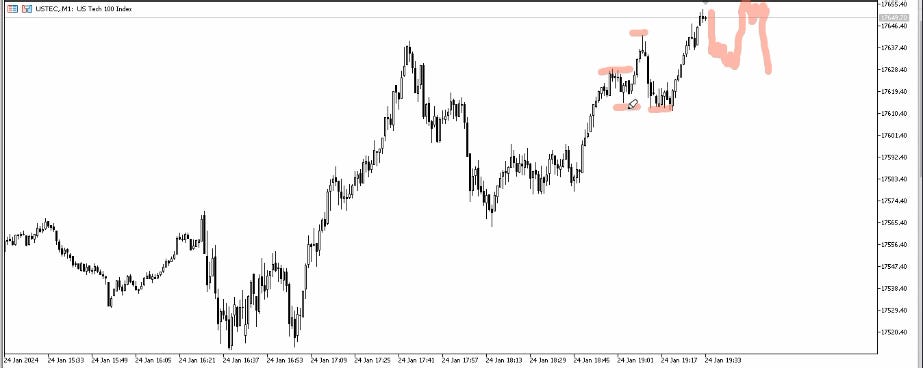
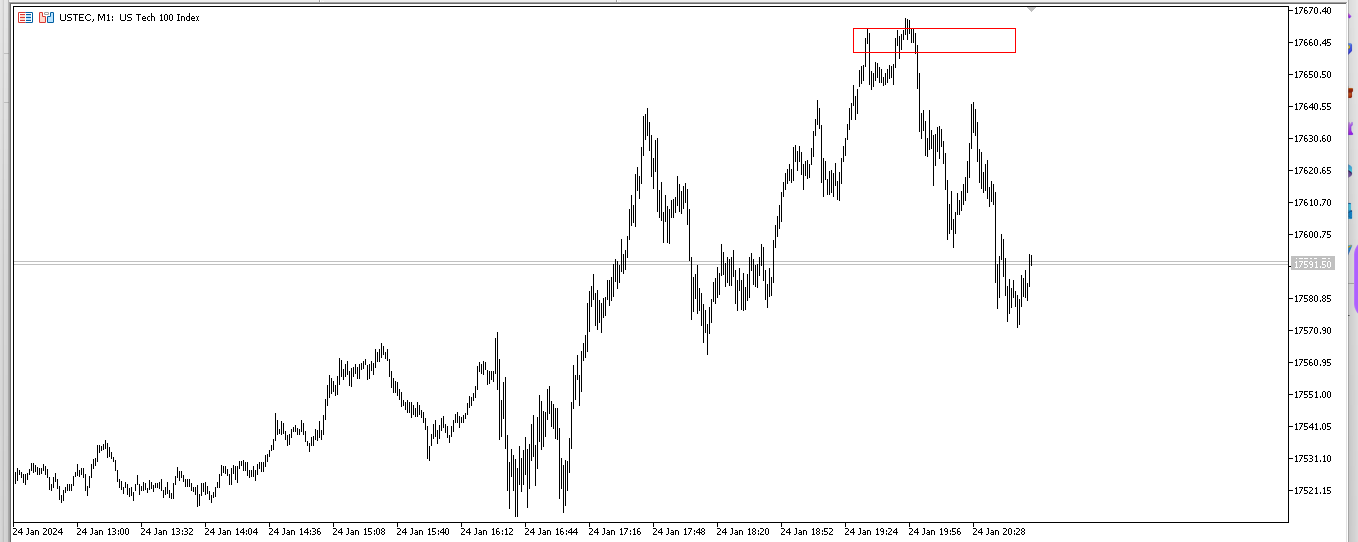
Market goes a little higher. The W structure is pointed out.

There’s an initial sell off. Break levels are planned using fib extensions.
Market spikes higher. Fibs are adjusted.
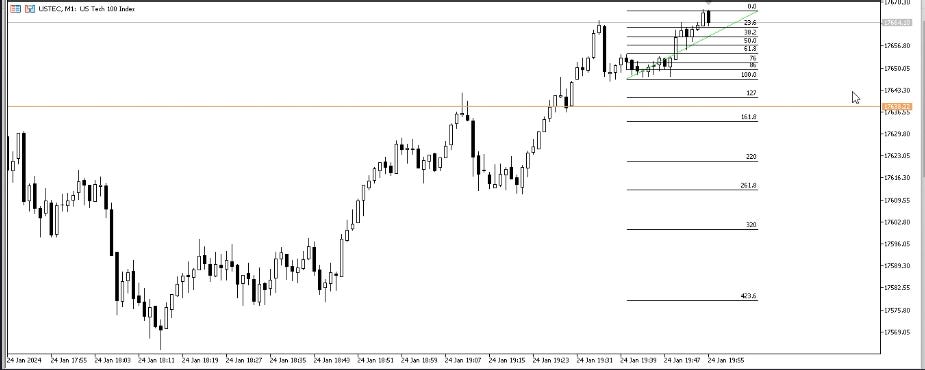
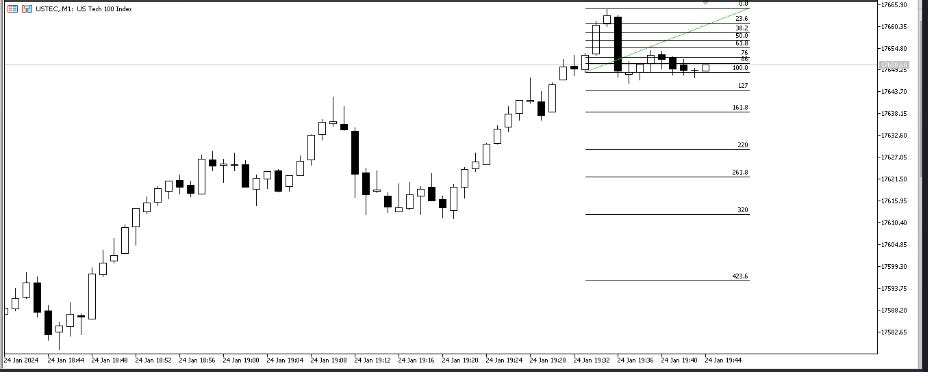
An update is given on the butterfly pattern as we enter into the action area of it.
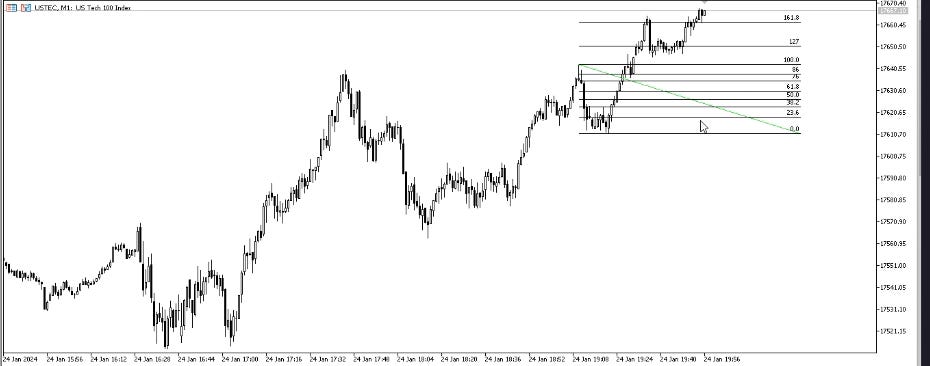
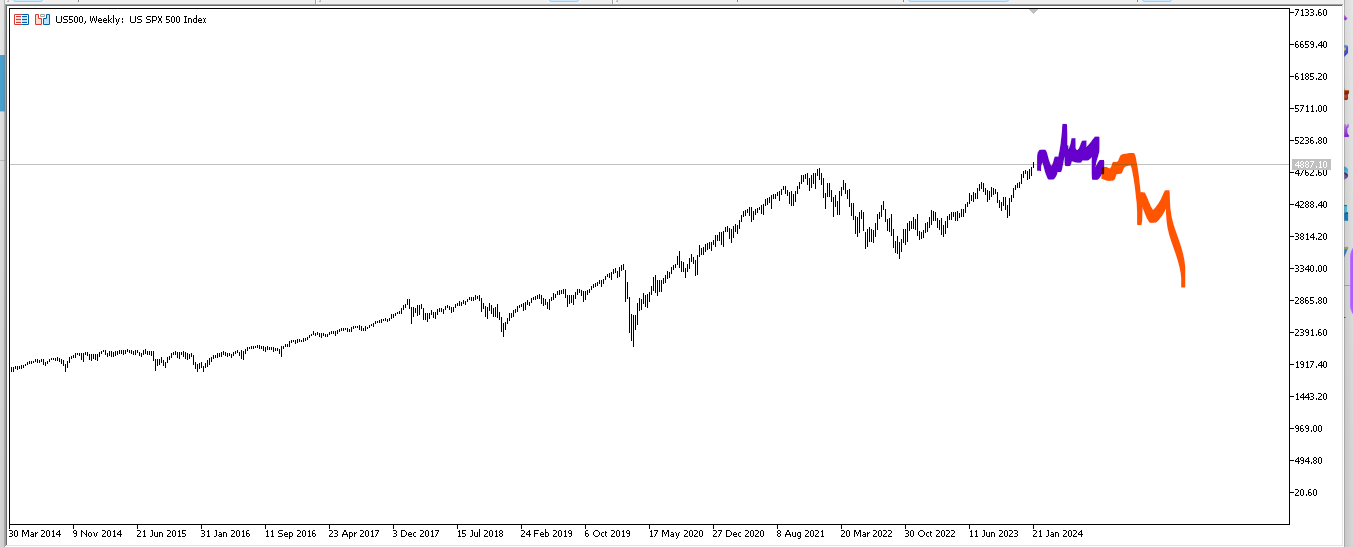
This was not included in the video, but here’s a big chart version of the thing the video was showing.
At this point the video shows the first reaction on the butterfly and states if this is a spike out it should end soon and strong selling comes under the 1.61.
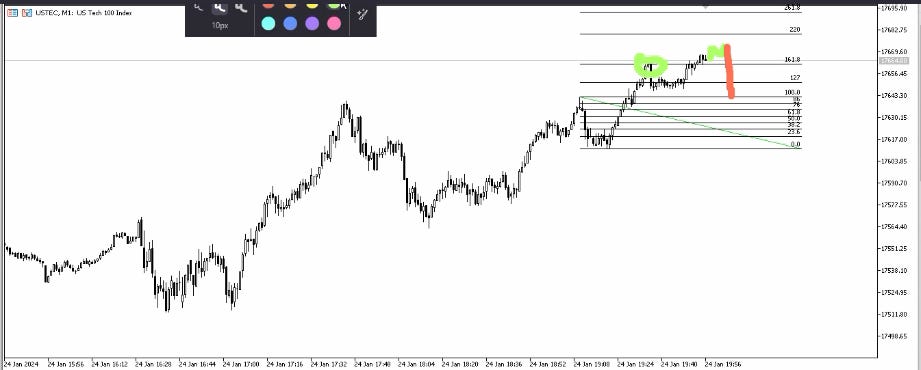
Next we cover perspective coming later in false breakouts. How the break above the high can appear strong but be very small relative to the drop to come.
On a large scale, the move on the weekly chart could look something like this with it having an overall up bias for a while. Making bears look silly. Being very frustrating to try to short.
But although all that stuff deters bearishness - it’s absolutely in line with the type of stuff that preludes rejections of a false breakout. Looking like this.
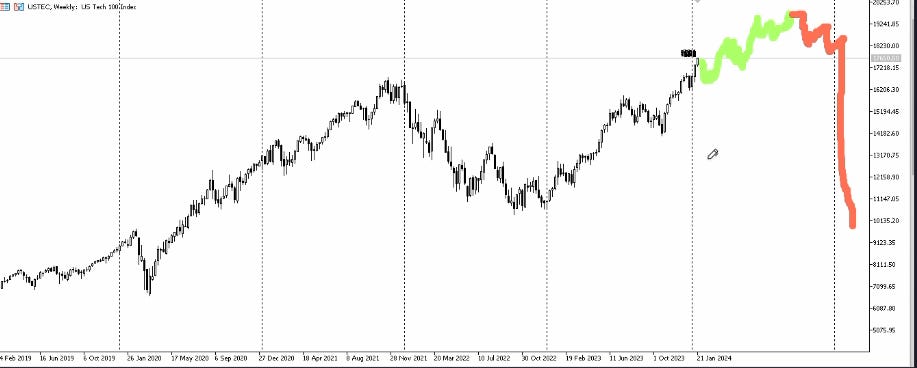
The bear forecast in this video is made in the red box area.
And my proposal is we might just be in a bigger version of that.
We should prepare ourselves for some potential false starts and be sure to know how we’re going to plan our break levels.
The fine details of things are tricky (Spike outs suck and weekly charts make small errors feel huge) but, in theory, if we’re in a spike out bull trap - when the time comes we should be able to identify the key swings and levels to trade in it as accurately as this small chart reversal forecast.
And this wasn’t “Luck”. I didn’t get lucky here. This is a pattern.
Here’s Nasdaq 1 minute.
Here’s the all time high in Bitcoin.
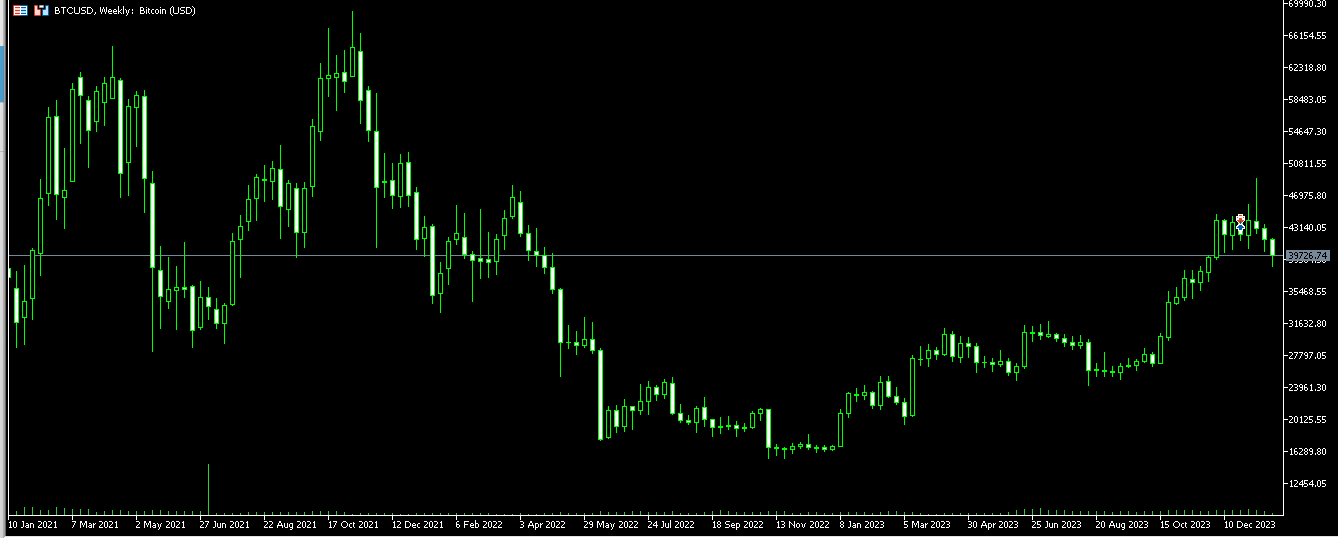
Same thing. Almost tick to tick.
And these indices spiking out the highs look no different. They look no different now and even if there’s more momentum, they look no different.
Giving the mixture of bear traps, strong spikes to highs and overall larger reversal possible; this is a really good time to accumulate long term put positions. Hedge with cheap OTM calls into possible bear traps. Ideally, we spike high for an exit on the calls and an increase of the overall swing bear bear position.
Until given good reason to do otherwise, these are the principles our trade plans for the next few months will be built around.