
Using 76 Retracements for Trend Decisions.
Using 76 Retracements for Trend Decisions.
Simple rules and review of their 2022 - 2023 performance.

In this post we’ll look at the different ways price interactions with 76 retracements produced useful signals through the major swings of 2022 and 2023. These will all be examples of typical things we see around 76s and understanding what happens around these inflection points can be useful in all forms of trading.
The 76 is Not a Real Fib
The 76 “fib” is my favourite of the levels I use. It can be so reliable and signal major moves. It’s not a real fib. The next fib in the sequence would be a little higher (78.x). The reason I started using 76 is the MT4 trading platform fibs by default are missing several fibs. You have to add them in.
MT4 is used by almost all Forex brokers. Through the years I’ve used dozens of different brokers and used MT4 with them all. Every time you get a new MT4 you have to set up the fibs. One time setting up a MT4 I decided 76 may suit me better than the real fib and tried it. It did and the 76 stuck. It’s an honorary fib now.
Norms of a 76
When the market is trending (And that bit is important, ranges are different), a 76 will very often be a short term trend decision level. If price is going to reverse, it will usually do close to the 76. A significant breaking of a 76 usually signals the reversal will fail (Or at least not happen for long enough to get out and wait).
When using the 76 for trading small timeframe Forex setups in relatively calm markets, I found a good rule to use was if price is in a correction and will make a new high/low the reversal will happen just before the 76. It will come close to the 76 but the 76 will not hit. 76 hitting would signal a failed reversal.
This rule is pretty good in fair weather conditions on small timeframes. In volatile conditions they could overshoot. Further to that, big setups often overshot (Largely because big setups ended in volatile conditions). There’s a bit of margin for error but we want to see 76 breaks turn into wicks in a reversal.
Here’s some simple 76 rules:
If the market has been trending and pulls back
Optimal entry is just before the 76 fib
Expect strong action into the 76 area (Do not be scared of PA)
If the 86 hits the reversal trade has failed
If the market has been trending, and is retesting H/L after correction
Biggest risk of new high or low attempt failing near the 76
86 hitting makes breakout most likely
Retracement from 86 usually happens
Retracement ends near 76 or 61.8
If 61.8 is broken the breakout setup has failed
86 break will usually hit 1.27 extension
The 76 area is prime area for trend continuation. When this prime trend continuation fails we usually see price move strongly in the other direction. These are the optimal areas to bet on trend continuation with stops behind the 86 fib or behind the recent high/low (But usually an 86 hitting means all stops will hit).
76 - 86 zone is very useful for stopping out. If you’re following a trend these are levels you can use for new stop losses and trailing stop losses. If a 86 fib is hit, most often price will go further. It will very often immediately reverse around the 86 fib but it usually won’t go much past 76 if the break is valid.
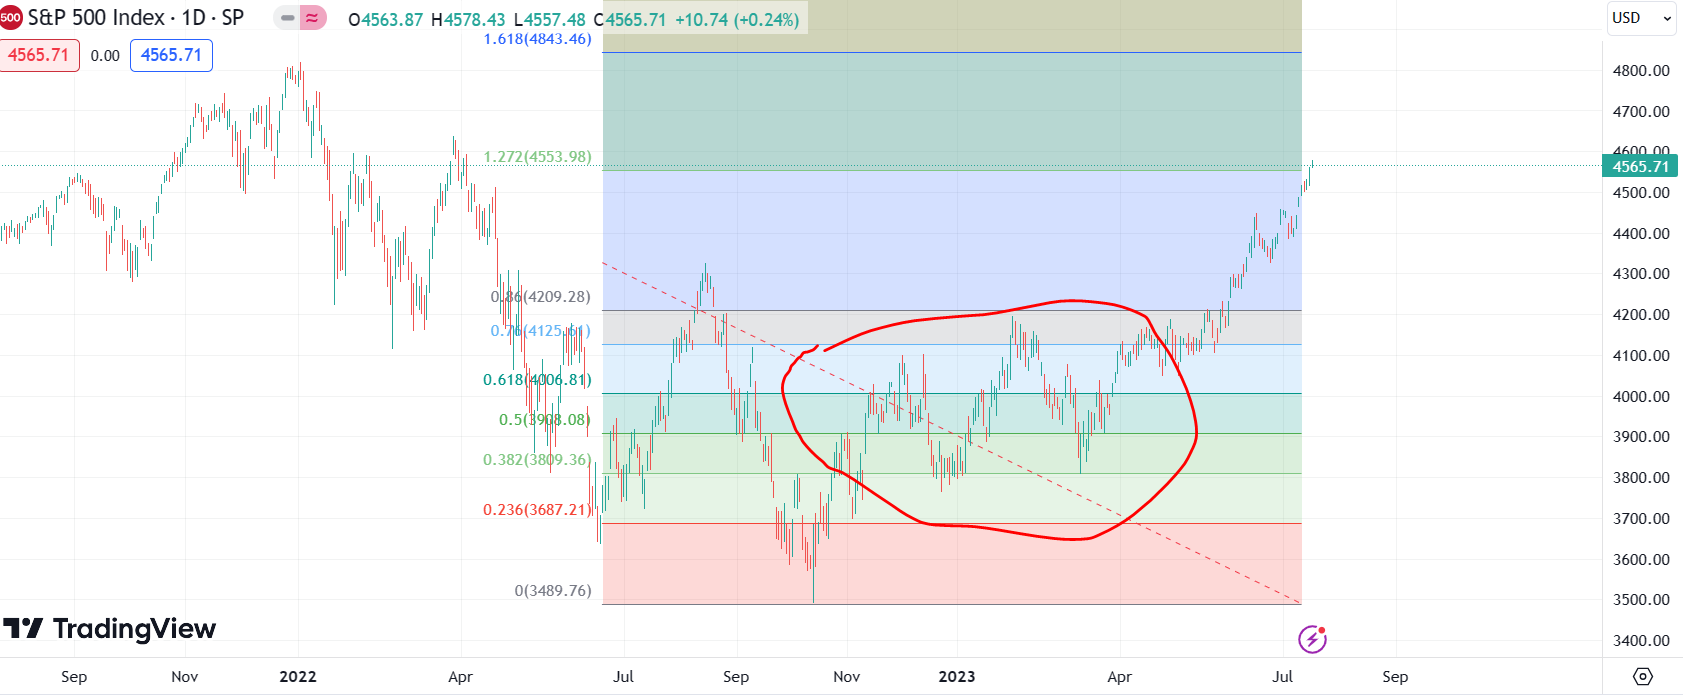
These are simple rules but they are very high performing in a trend. Let’s look at all the big swing on a daily chart of SPX during 2022-2023 for all the spots these signals would have successfully picked up correction trades or indicated the failure of a trend move.
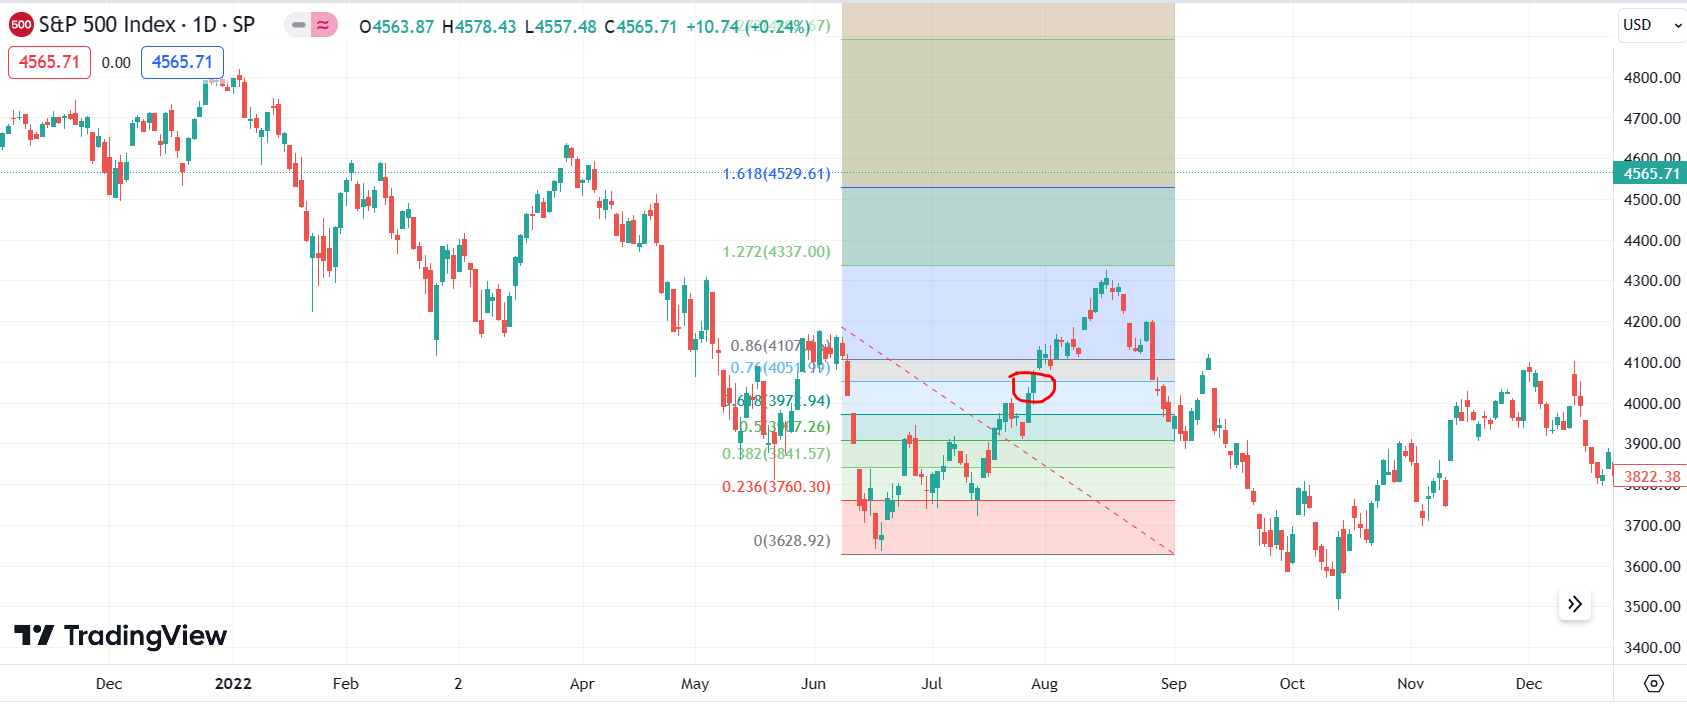
First time a daily 76 was met was a bullish signal. SPX dropped to the 76. Made a big bounce. Later this would fail. Bullish signal fail gives bear bias.
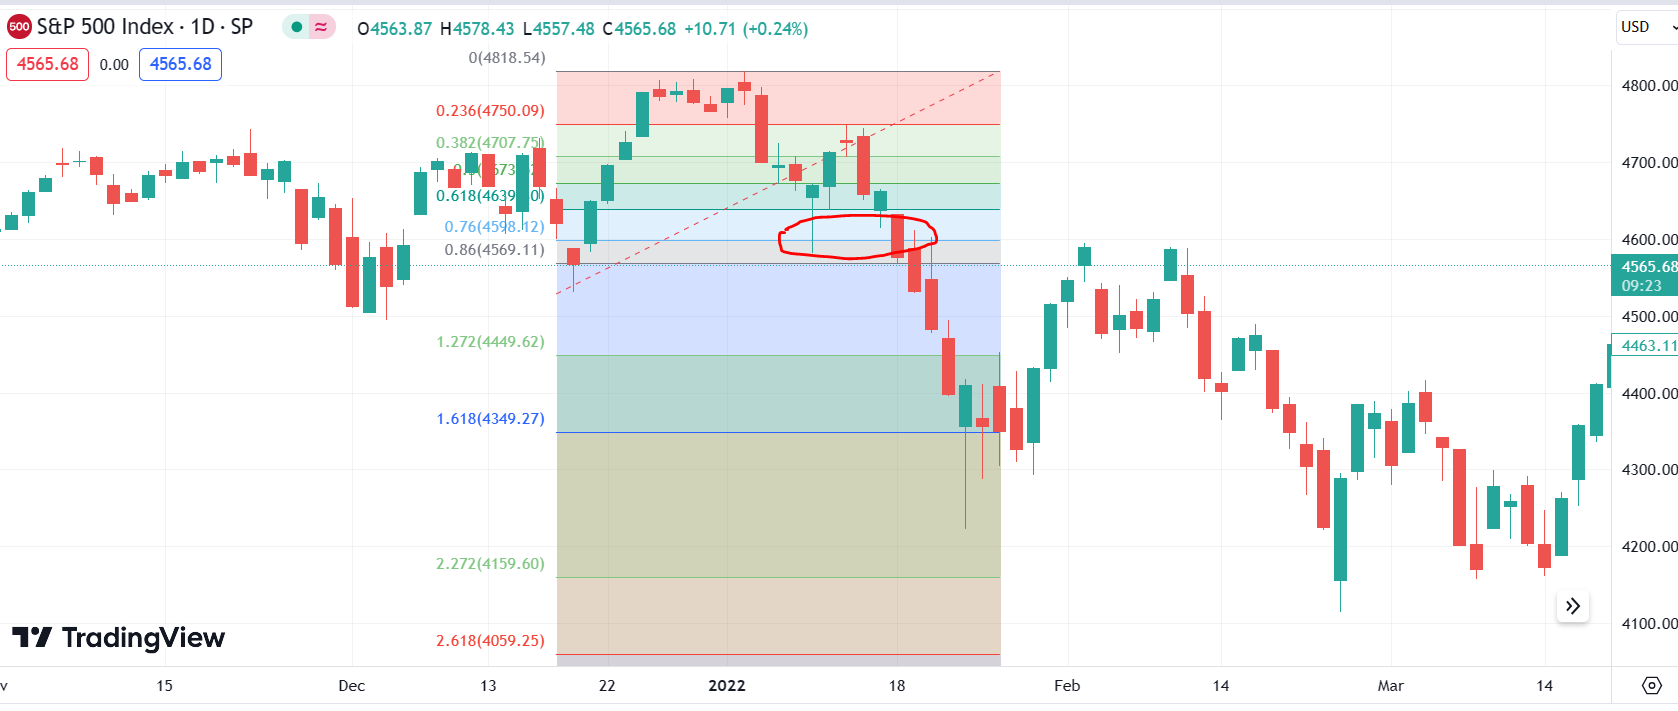
(This bullish signal would really have sucked for a bull here. It looks really good at the high - often ones looking like that work).
In the rally the SPX held the 76 of the drop. Successful bear signal.
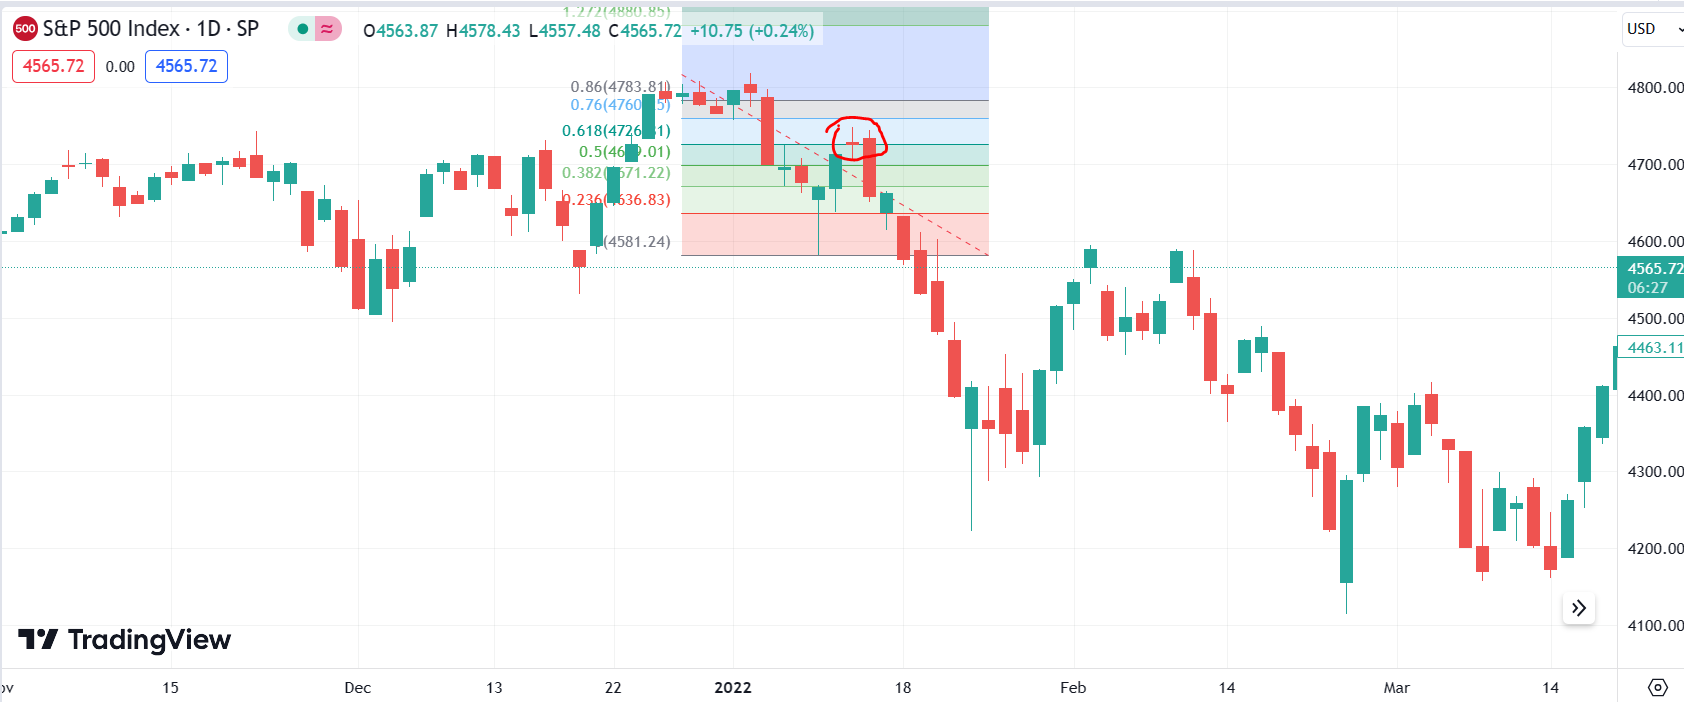
Followed by another successful bear signal.
The next one is a failed bear signal but also I’d class this as a failed 86 break signal, too. Although this did make a new high after breaking the 86, a 86 break would usually be expected to go a bit higher here. In real trading his would be two losing signals or one breakeven result if you trailed stops.
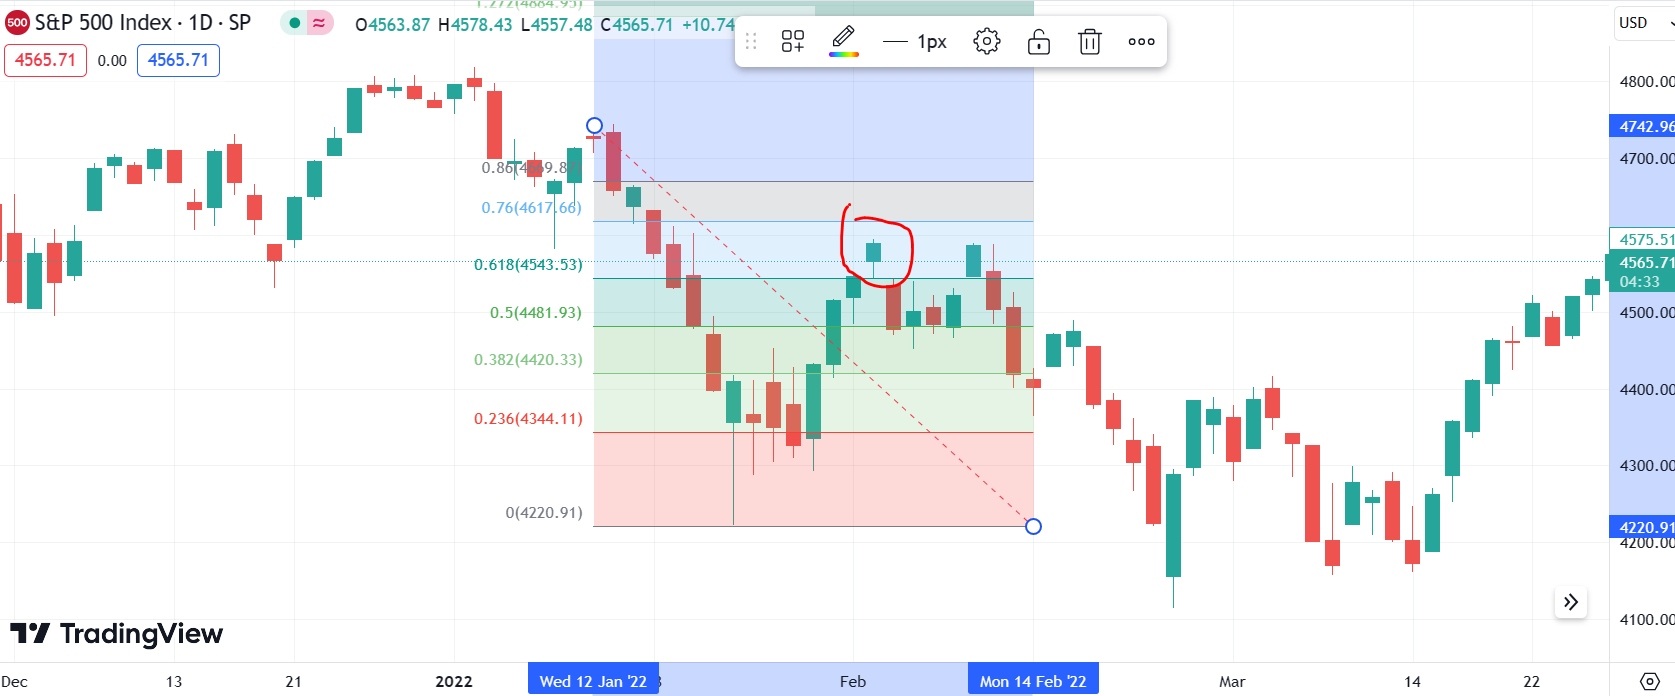
Next we have a failed bear signal that succeeds as a reversal signal.

Next we have a failed bull signal into a successful breakout.

I can’t remember this section but I am quite sure I’d have been caught on this one. Thinking bear 76 failed, bull 76 good. Would have reversed on the retest.
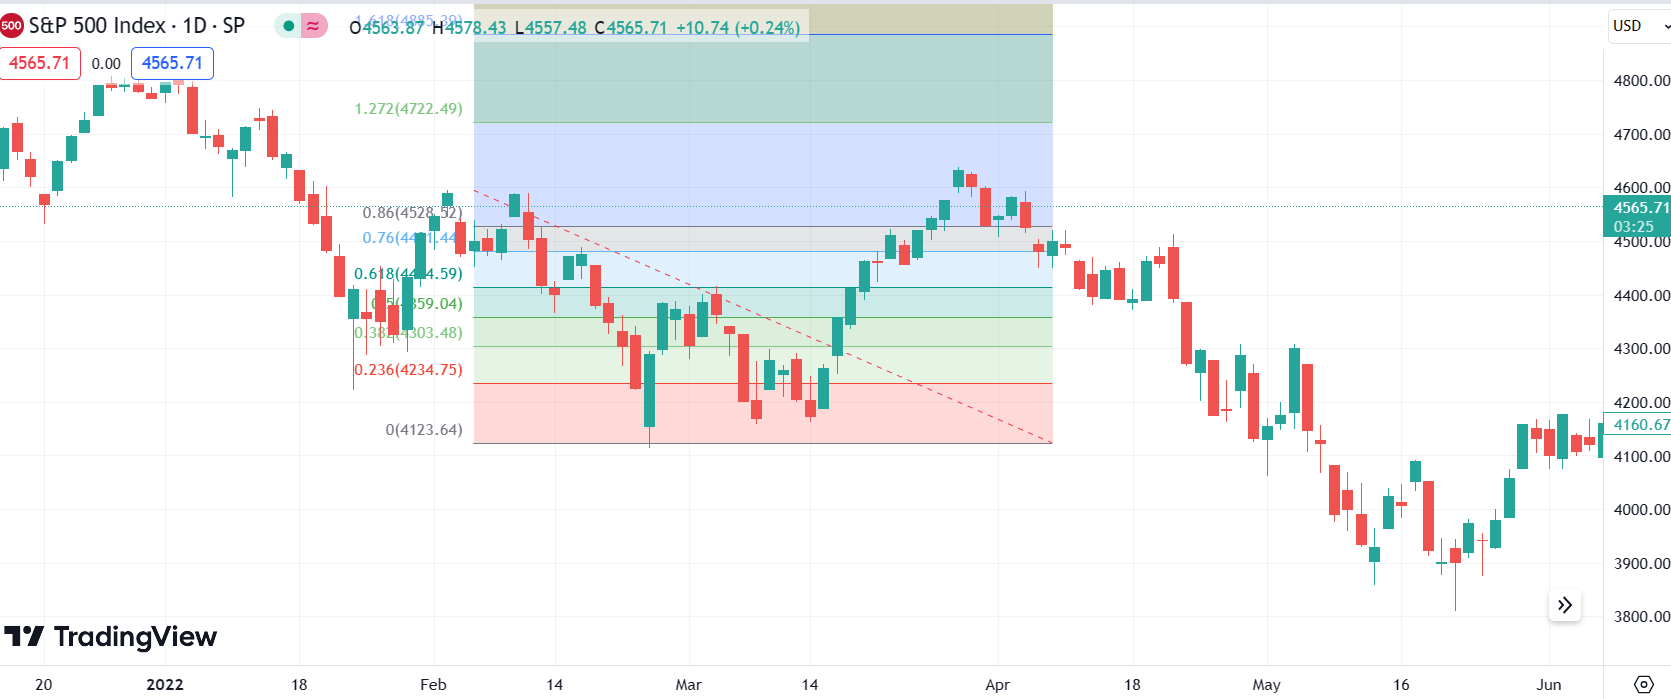
Next came a successful bear signal.

Nailed this one. I remember it because the range. Felt like it took forever and then a really sharp break. This would be the last easy short of 2022.
Next is a failed bear and successful break.
Next was a double failure. Close to the 127 but this could have been two losing signals or one breakeven.
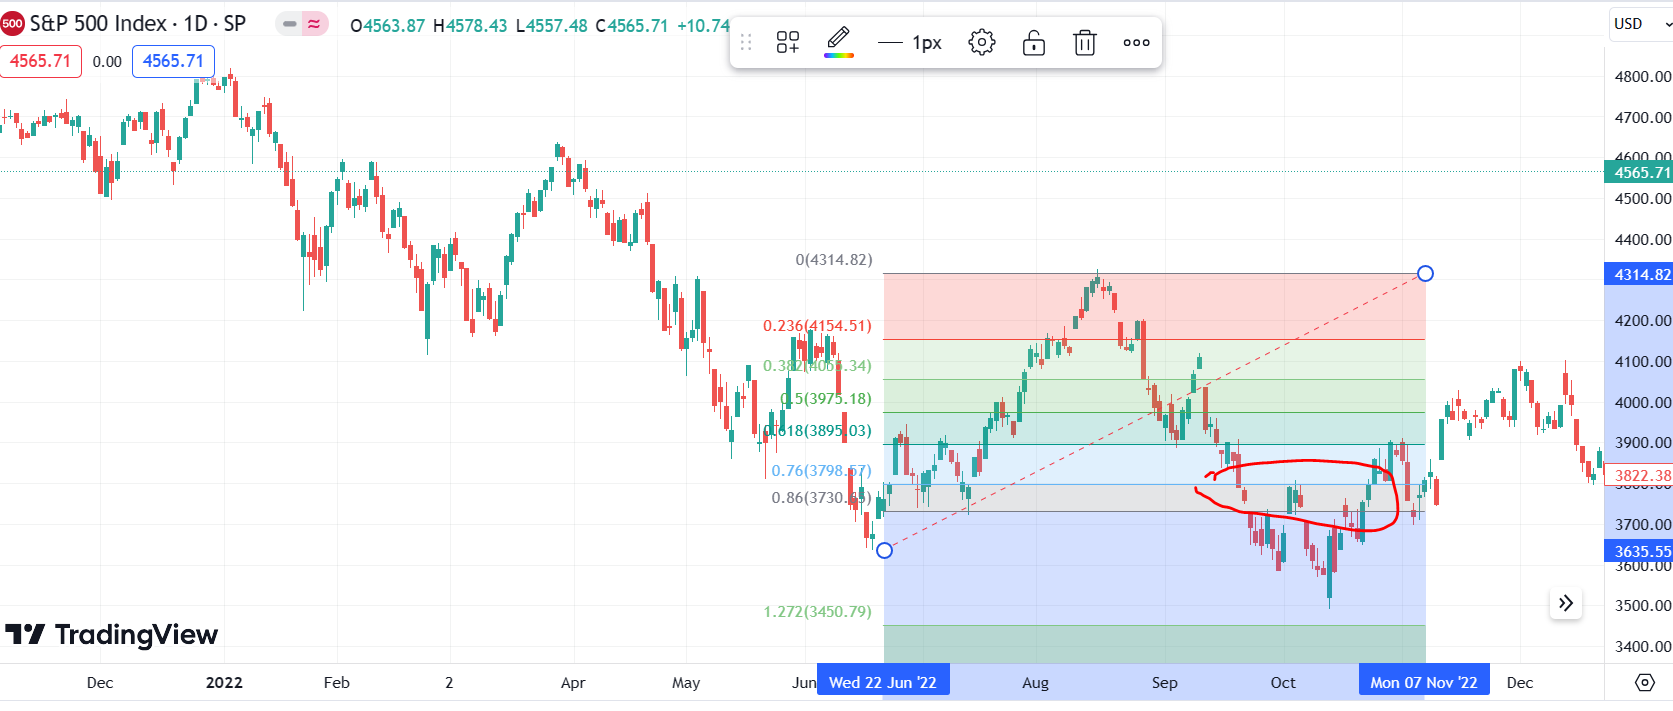
I know I lost in this bit. Can remember it. Up to this point things had been relatively easy. 76s were really doing well. Got tricky from here on.
All rules fail here. It’s a full house on things you do not want to see with price action when this happens. This would create the most losing signals.
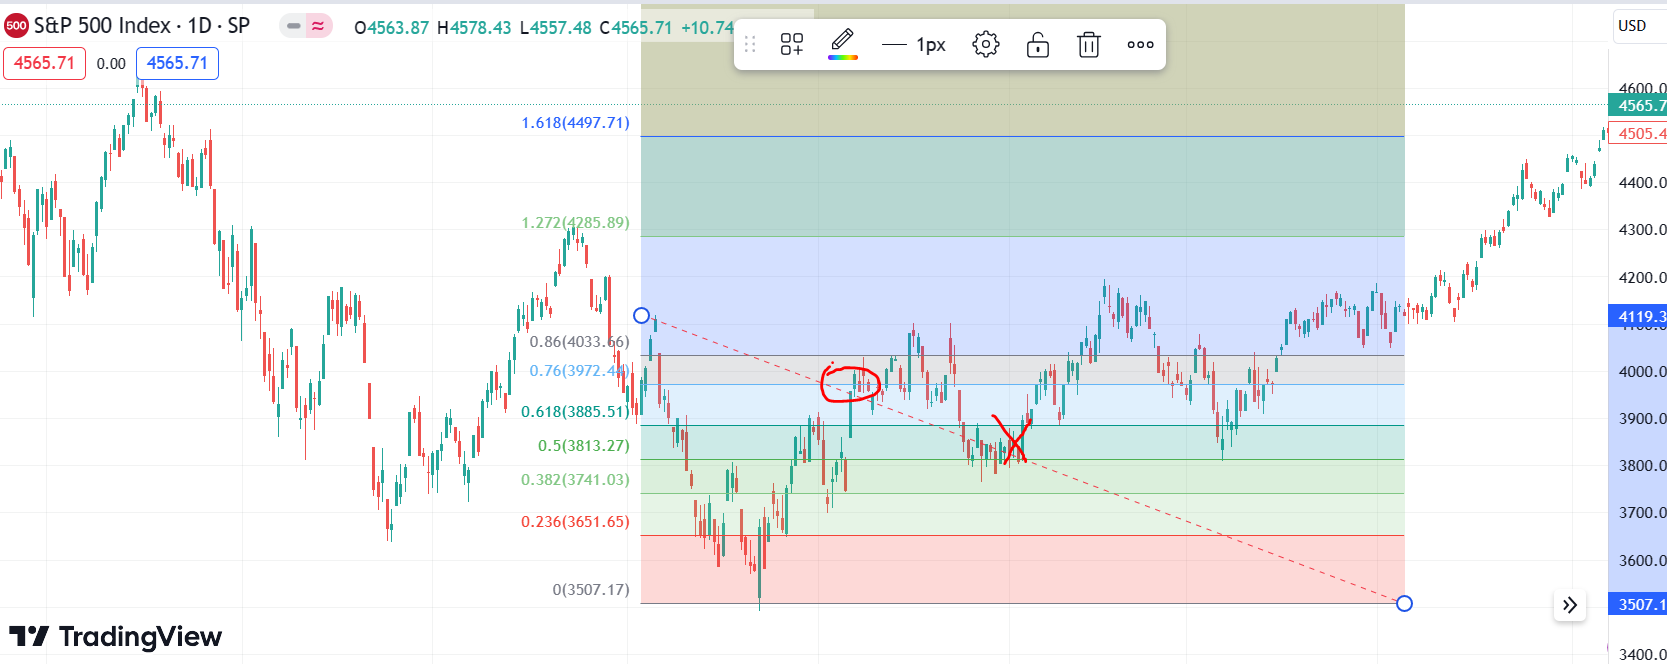
Failed bear. Then the pullback breaks the 61 and hits the 50. Would signal bull exit near low. Then the following breakout didn’t hit target, came back to stop and then went to target.
During this section all the rules break down. Everything that happens is a market move outside of what the strategy expected.
As mentioned earlier, this will do well in trends. When the market went into a range the rules became much less effective. However, ultimately the failure of this 76 as a reversal on the big swing into the low would signal the failure of the lower lows downtrend.
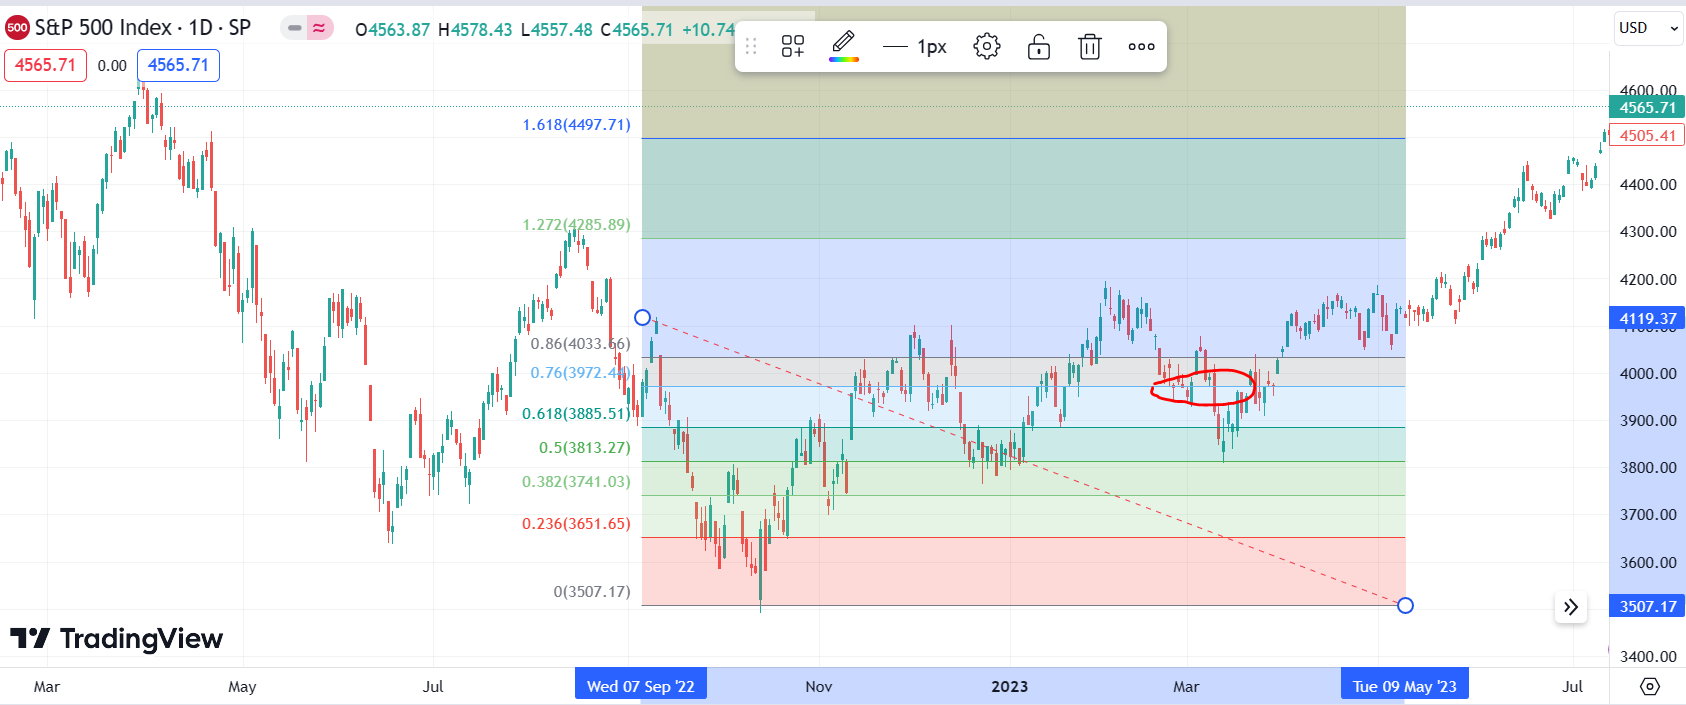
Now we have the largest 76 swing decision. The full retracement swing. We’re currently trading above the 76.
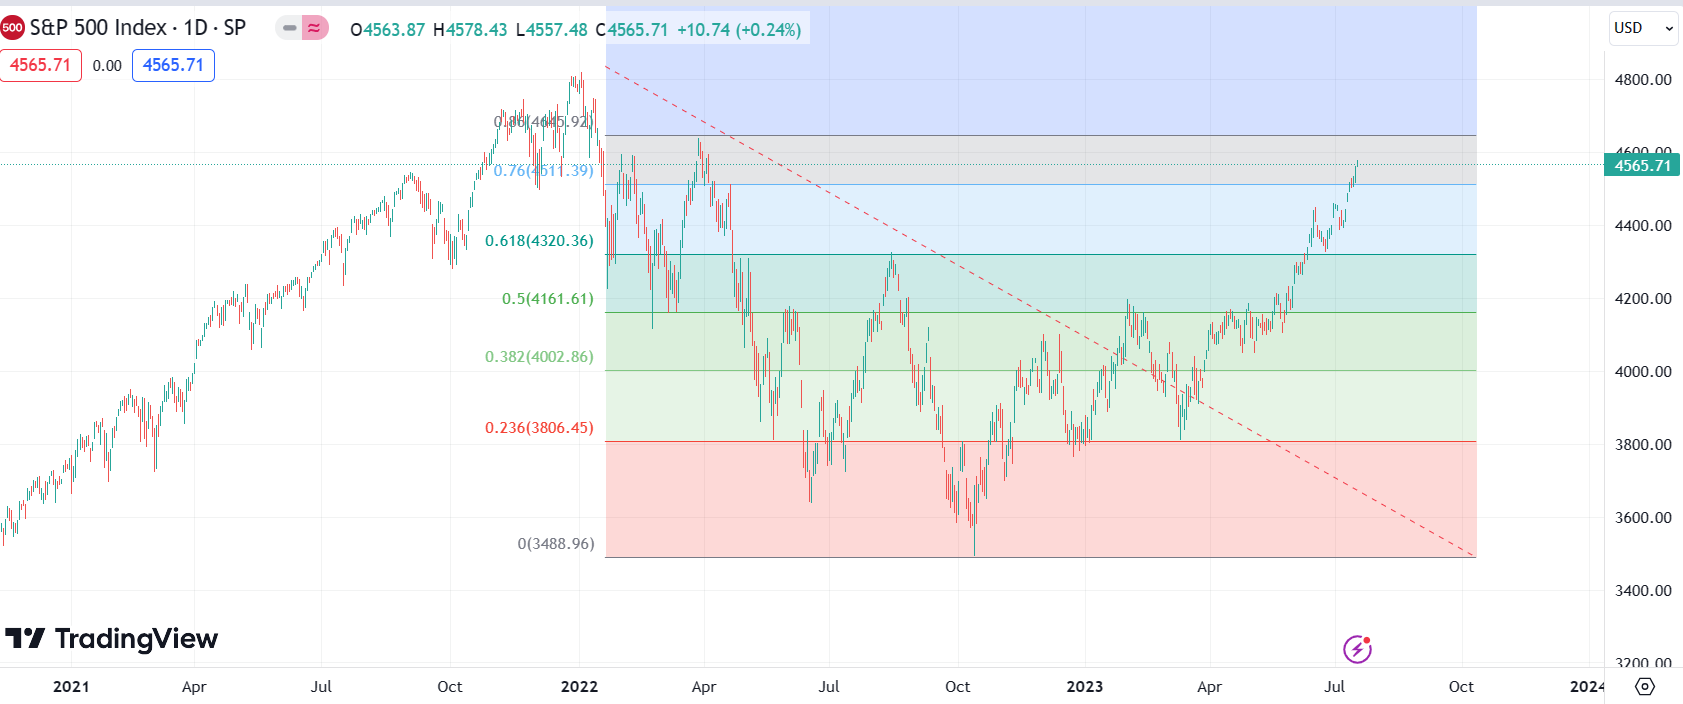
The strategy norms here would predict SPX has to make a very strong move to reject the attempted 76 break or if the 86 hits we’ll make a new high.
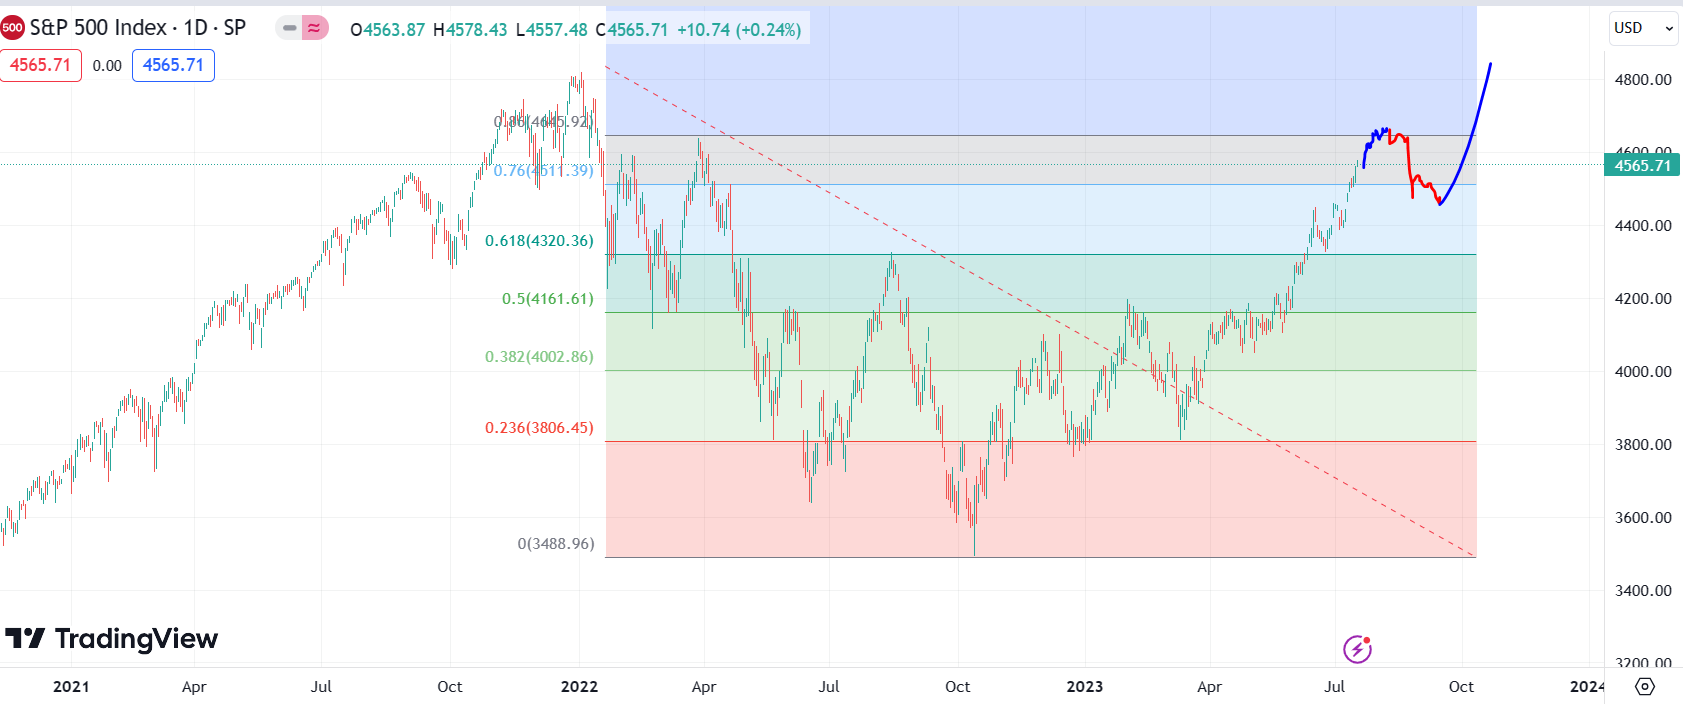
We’ll have to wait to see how it plays out, but being above the 76 really changes my bias. As we were getting into the 76 I was willing to be a bear but this now looks more like a breakout.
As you can see from this review of swings (And I know this is a small sample but I think if you go and do bigger samples sizes you’ll agree this is representative) the 76-86 rules can have complete failures, but the odds of them being successful are reasonable and produce strong moves when they succeed.
There are price moves that can really “Confuse” this strategy, but we know these moves. You can see them above. We are going to be caught on the wrong side at times with them but there are ways we can get out quickly enough when we are wrong. The times we’re on the right side more than compensate.
When we’re in trends in markets, there’s a lot of value to tracking where the 76-86 zones are as swings develop and then looking for near (to mid) term trend decisions.