

Wave 2 Reversal Strategy
Reversal of Correction

This is part of a series of strategy posts.
Once all strategy posts are up, they will be linked together. Initially there will be placeholders for links - Marked “(Link)”. This is because all posts need to be published to be able to interlink them. Please check back later for complete interlinking.
The original series of posts will contain 15 strategies. All of them time tested and ones I’ve personally used to make a living in markets for over 10 years. These will all be free. Multiple additional posts will be added for paid members. Discussing advanced strategy, nuances and covering the common questions we’d expect about the strats.
Strategy Name:
- Wave 2 Reversal Strategy
Strategy Type:
- Counter-Trend
Strategy Premise Overview:
-The Wave 2 Reversal Strategy is based on Elliott Wave Theory, focusing on the retracement that follows the completion of Wave 1 and precedes Wave 3. Wave 2 is typically a corrective wave, often retracing a significant portion of Wave 1, providing a potential entry point for a strong trend continuation in Wave 3.
Conditions for Use:
- Best applied in obviously trending markets where Elliott Wave legs can be clearly identified, particularly the transition from Wave 1 to Wave 2.
- Look for signs of exhaustion and reversal at key Fibonacci retracement levels of Wave 1 to confirm the completion of Wave 2. These will often be consistent with the 76 Reversal Strategy (Link).
Planning Entries:
Here we are looking to combine two things. The Elliot wave theory to give us a big roadmap for where major trend legs might start and end and once we have this roadmap we’re going to use our toolkit of different strategies to give us an actionable way to trade the move.
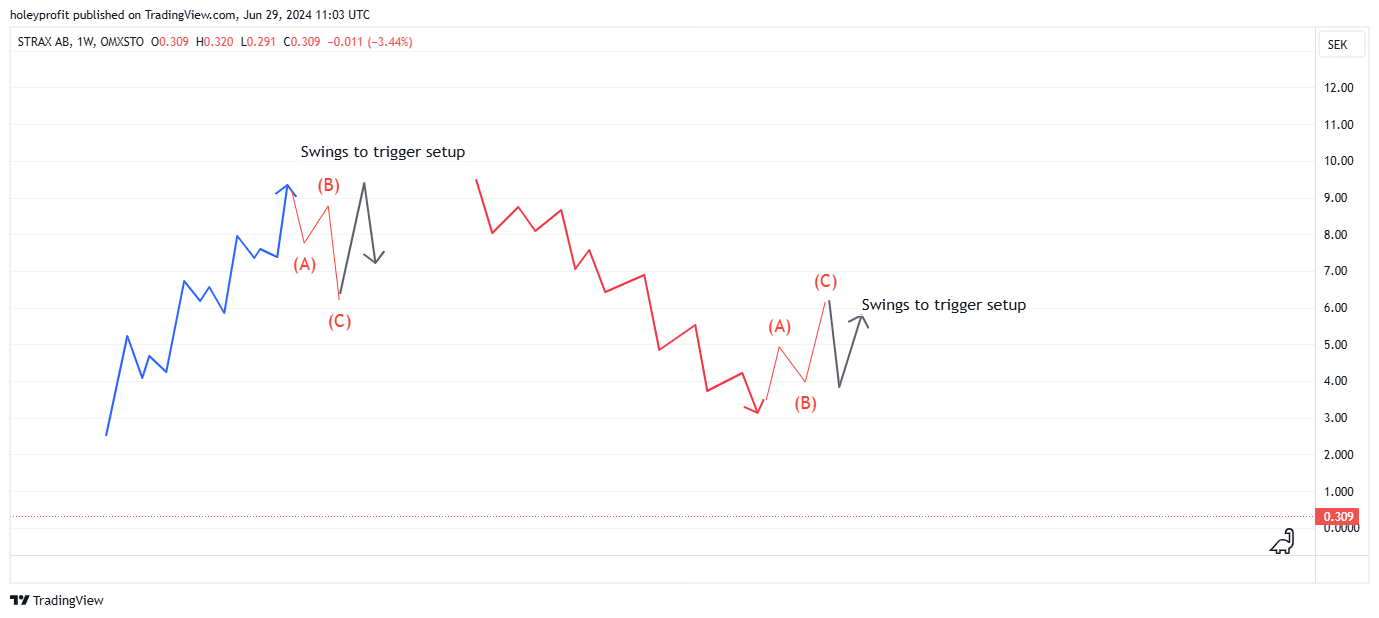
- Identify the end of Wave 1 and the beginning of Wave 2 using Elliott Wave analysis. The easiest way to do this is to look for C points. Points where there was an obvious break of the trend - but it appears to be a false breakout.

-The C point should be followed by a move that breaks the B point and then another pullback.
Draw retracement levels on this swing. These fibs will often provide good entry levels if wave 3 is to develop. Usually coming from somewhere close to 76% retracement.

- In a successful setup, we’ll now enter into a series of goods trade. First comes the 76 Continuation.

-When we have a good entry we can draw a fib retracement high to low of the pullback in an uptrend or low to high in the pullback of a downtrend. For a new breakout to made we’ll have to see an 86% break - giving a 1.27 target.
-When the 1,27 is met we can then apply the 1.27 Continuation or 1.27 Retest strategies.
-If all of these trades are successful, then we might be in wave 3 - where we can apply our set of strategies for following momentum.
Planning Stops:
- Place stop losses below the start of Wave 1 for long trades, ensuring the trade is invalidated if Wave 2 extends beyond typical retracement levels. Our stop loss here is clearly defined by understanding the nature of our bet. We’re betting on Elliot waves. A trend pattern. A clear rule of Elliot is wave 2 can not break wave 1. If it does, we’re no longer betting on Elliot. Time to exit.

- Alternatively, use tight stops just below the 86% retracement level for a more aggressive approach. This will give much higher RR but be more susceptible to getting wicked out by slight overshoots. As a general rule, inside of a developing trend the 86% fib of wave 1 does not often break.

Planning Targets:
- The primary target is the start of Wave 3, which should extend beyond the high of Wave 1. Again our minimum target can be defined by understanding our bet. We’re betting on Elliot wave 3 and this must be at least as big as wave 1. So once we know the size of wave 1, this distance is our minimum target for a valid wave 3.
- Draw an extension fib from the end to the start of wave 1. A minimum target of 100% of this is a valid Elliot wave and usually the 1.27 fib will hit before there is a pullback.
- Further targets can be set at the 2.20 extension level. Usually 1.61 is broken and a strong trend comes to 2.20, where wave 3 ends.
-While there are a few default ways to set targets here, if this setup is successful most often we’ll enter into conditions where one strategy rolls into another and this will help to better manage trades and plan targets.
Typical Win Path:
- Successful trades will see a strong reversal and continuation of the trend following the completion of Wave 2.
- The turn usually comes with a head fake spike close to 76% retracement. A wick candle. Sometimes ranging action and the start of a trend which strengthens as it progresses.
- A theme of holding higher highs and higher lows for an up move or lower lows and lower highs for a down move should start to develop.
-Fib retracement levels should act as supports or resistances when broken and retested.
Typical Lose Path:
- Failed trades may occur if Wave 2 extends into a complex correction, leading to stop-outs before the trend continuation begins.
- In such cases, the market may exhibit irregular or prolonged corrective patterns, resulting in potential losses.
-Another means of failure is a trend reversal. Or perhaps a misread of the Elliot count.
- In either event, failure is usually signaled by there being no reversal at the 76% retracement level or there being an attempt to reverse there but it is only a short lived reaction. Both instances we have clear exit conditions early on the 86% or late on the breaking of wave 1.
-
Why Strategy is Expected to be Successful:
- Wave 2 provides a high-probability entry point for trend continuation, as it often retraces a predictable portion of Wave 1.
- The strategy leverages clear reversal signals and Elliott Wave patterns, allowing for precise entry and exit points.
- With proper execution and typical Elliot development, this trade can pay 1:8 RR without major pullbacks. For example, $10 risk can make $80 profit without ever giving up more than $25 of the running profit. Which makes it the highest repeatable RR trade I know of.
Known Risks and Weaknesses:
- The strategy is vulnerable to misidentifying wave counts, leading to incorrect trade placements.
- Requires a good understanding of Elliott Wave Theory and accurate pattern recognition.
- May produce losses if the market enters a complex correction or if the reversal is shallow.
- Only has a positive expectation in trend.
- Is certain to produce at least one (Usually three) false signals ina trend reversal.
Trade Execution Plan
Wave 2 Reversal Strategy Execution Plan
Bullish Trade Execution Plan
1. Market Analysis and Preparation:
- Identify a trending market using Elliott Wave Theory.
- Confirm the completion of Wave 1, indicating an upward trend.
- Mark the retracement levels using Fibonacci retracement from the start to the end of Wave 1.
2. Planning Entries:
- Look for possible C points.

-Make a conditional plan, “If there’s a rally out of my possible C point > Then there’s a correction of that rally > At a 76 retracement I’ll bet no new low is made”.
3. Placing the Trade:
- Enter the trade long once the reversal pattern is confirmed at the 76% retracement level.
4. Setting Stop Loss:
- Place the stop loss just below the start of Wave 1 for a conservative approach.
- Alternatively, for a tighter stop, place it just below the 86% retracement level.
5. Planning Targets:
- A new breakout triggers the break strategies designed to deal with retracement from 1.27 and 2.20 fibs. These are ideal for actively managing trades.

- For a simple static target on this, draw fib extensions on the pullback and target minimum of 1.61 (2.20 and 2.61 are also viable - but 1.61 is a risk area for pullbacks and reversals (link).

-
6. Trade Monitoring and Management:
- Monitor the trade for higher highs and higher lows as confirmation of the bullish trend.
- Adjust stop loss to breakeven once the price reaches the first target.
- Trail stop loss below higher lows to lock in profits as the trade progresses.
---
Bearish Trade Execution Plan
1. Market Analysis and Preparation:
Identify a trending market using Elliott Wave Theory.
Confirm the completion of Wave 1, indicating a downward trend.
Mark the retracement levels using Fibonacci retracement from the start to the end of Wave 1.
2. Planning Entries:
Look for possible C points.
Make a conditional plan, “If there’s a decline out of my possible C point > Then there’s a correction of that decline > At a 76 retracement, I’ll bet no new high is made”.
3. Placing the Trade:
Enter the trade short once the reversal pattern is confirmed at the 76% retracement level.
4. Setting Stop Loss:
Place the stop loss just above the start of Wave 1 for a conservative approach.
Alternatively, for a tighter stop, place it just above the 86% retracement level.
5. Planning Targets:
A new breakdown triggers the break strategies designed to deal with retracement from 1.27 and 2.20 fibs. These are ideal for actively managing trades.
For a simple static target on this, draw fib extensions on the pullback and target a minimum of 1.61 (2.20 and 2.61 are also viable - but 1.61 is a risk area for pullbacks and reversals).
6. Trade Monitoring and Management:
Monitor the trade for lower lows and lower highs as confirmation of the bearish trend.
Adjust stop loss to breakeven once the price reaches the first target.
Trail stop loss above lower highs to lock in profits as the trade progresses.
HoleyProfit’s Strategies is a reader-supported publication. To receive new posts and support my work, consider becoming a free or paid subscriber.