

A 2007 like move would dictate a low has been made.
Following up on the 2007 model.

See first: Supportive work and trade plans for a 2007 style market. (substack.com)
In the previous post we covered a couple ways this move could form, one of them being there being a crash like move that failed to make a new low and turned into a strong rally to spike out the last high.

Here’s a close up of the area marked with a blue line.
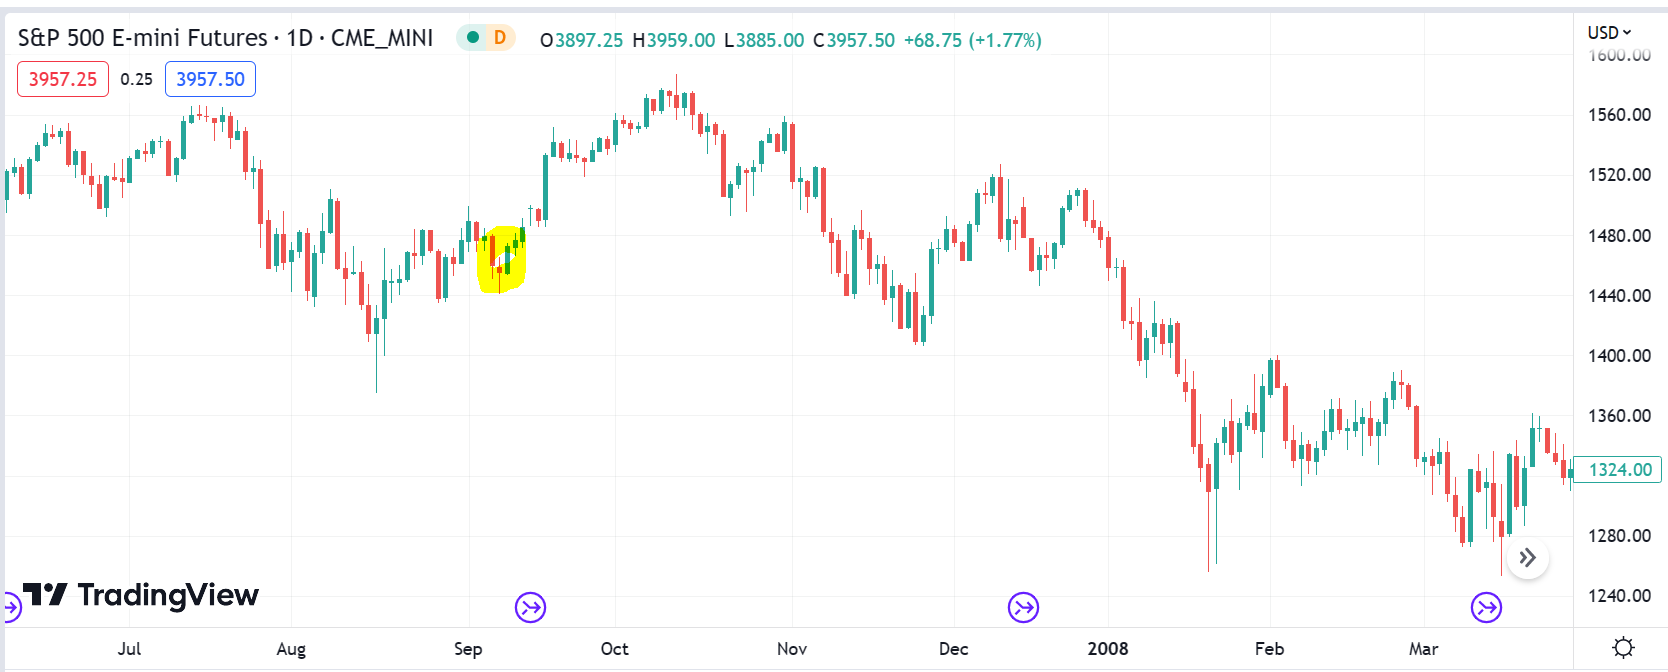
And here’s how our current SPX chart looks.

The implied trade plan here would be strongly bullish while above 3800. Uptrends may tend to develop over multiple risk markets.
Trade plans and contingency plans:
Now let’s get into actionable plans for trading a reversal of the downtrend and also look at the points we’d pivot to bear upon bull patterns failing.
Keep reading with a 7-day free trial
Subscribe to Market Forecasts and Trade Plans to keep reading this post and get 7 days of free access to the full post archives.