
Crash Bets Revised
Crash Bets Revised

This is a revision to: A Plan for Crash Bets - by HoleyProfit (substack.com)
While the setups here remain very good setups to have watch-listed (One has failed but the stronger break one can still materialise) given the market is consistently down-trending it’s worth taking positions now. We can also make plans to short puts against long puts and/or trail stops if we go into the chop range close to 4200.
Let’s look at some more possibilities for a crash could form and make sure we’re not going to be caught trying to work things out on the fly. As is always my stance, it’s better to have five plans and need one than one plan and need two. First we’ll cover a clean no pullback break.
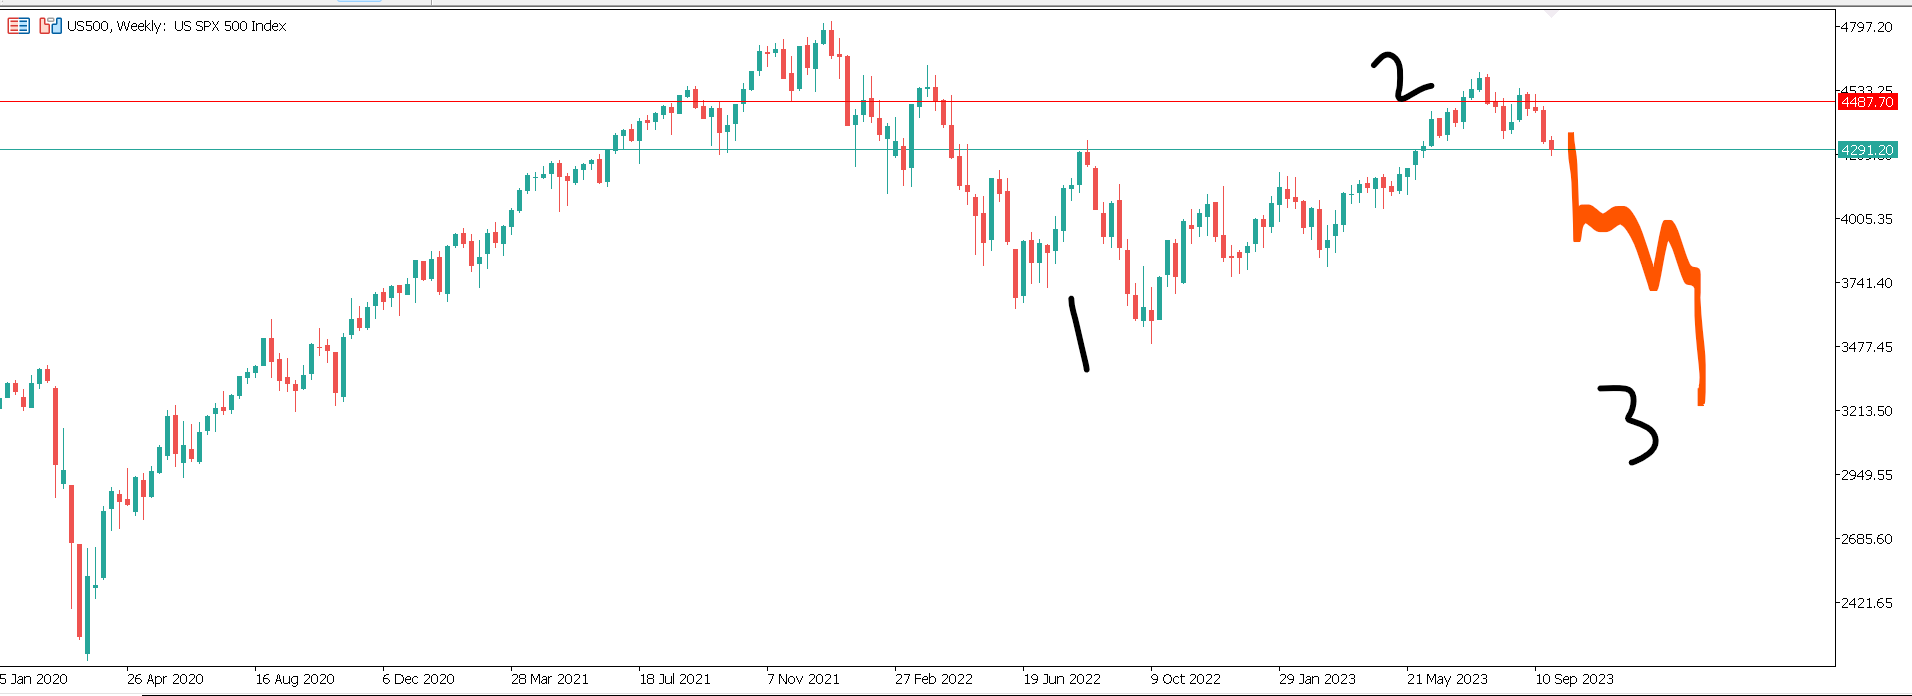
In a really strong break we’d be in a net downtrend to under 4000. As described in the first swing here. If we take a model from the 1987 crash this has a crazy amount of match ups. Before we go into the matching points of 1987 TA let’s first clarify why it’s incredibly unlikely we have a 1987 style one day event.
I’m a big believer in the “TA finds a way”, but it’s important to note in 1987 there was no circuit breakers and there was no skew on puts. It was a combination of these two things that led to the sharp drops. It was mostly pit trading. A far more inefficient form of trading and market making.
For a 1987 style event to happen we’d have to trigger circuit breakers and then have heavy gap downs. It’s not entirely impossible and it’s not something totally unworthy of a lotto bet if you can find other ways to support it but it is absolutely not something to be expecting. Structural changes in the market are intended to prevent it.
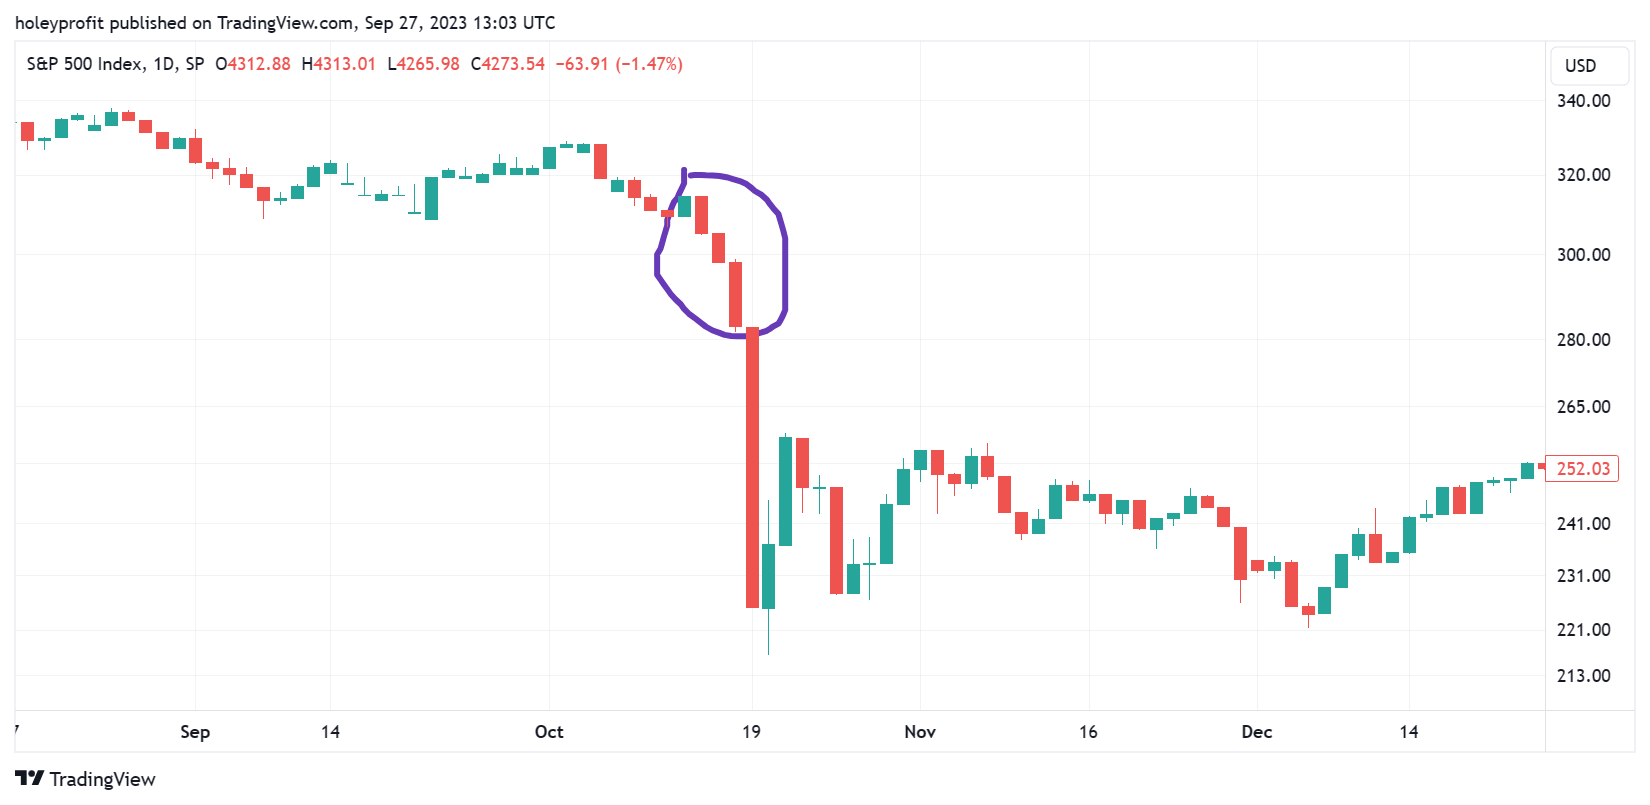
It’s amazing how many people were posting on social media claiming the 1987 setup failed yesterday when it actually put in the exact candle pattern that started the crash.


It is literally incredible how many people dismiss the possibility of this setup without even knowing how it it formed.
This is the famous part of the crash.
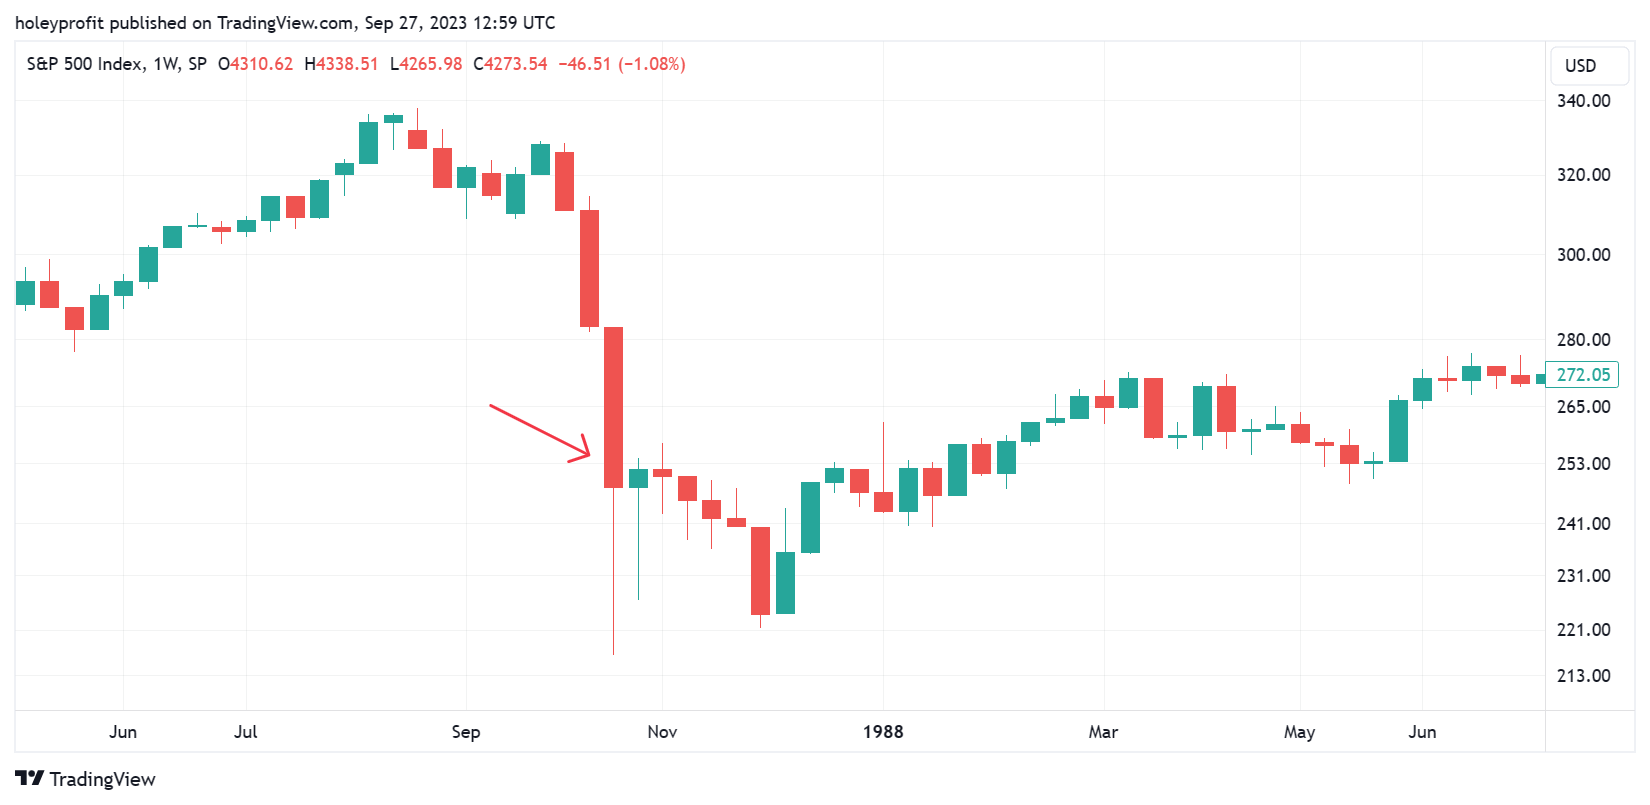
This actually only made up 1/3 of the full drop. For two weeks before this the market was screaming warnings of a bear break.
In a matching move, we’d only be here.
This model would not forecast the market to have capitulated on Monday. The fact the market looked bearish, has a setup similar to the early break of 1987 and it also happened to be Monday did not predict a “Black Monday” crash. What it would predict on a 1:1 basis would be a Black Monday crash in two weeks.
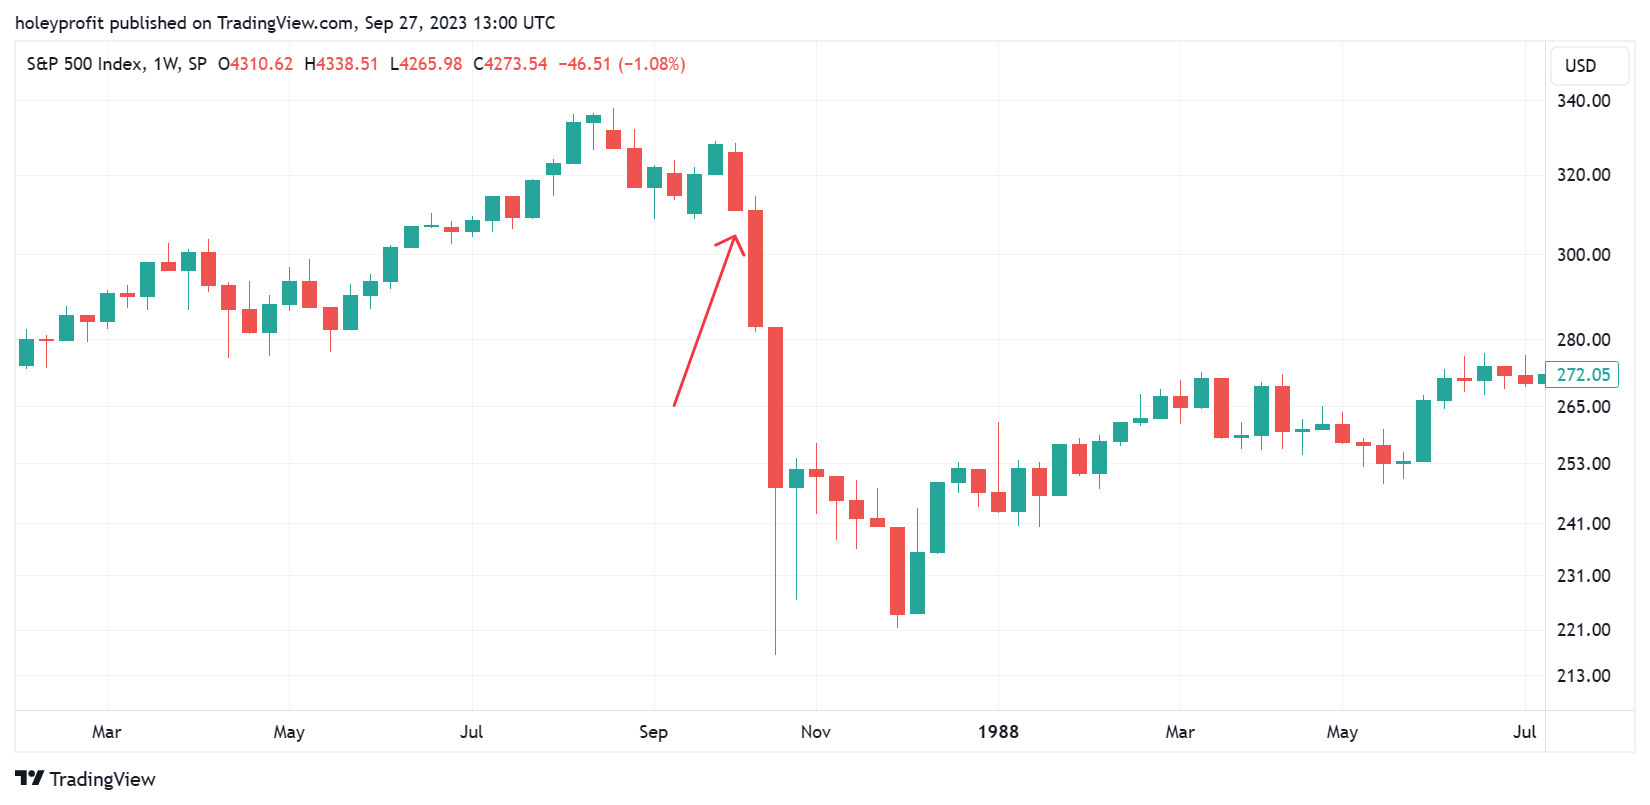
Absolutely has not failed. Actually this 1987 model has a lot more merit than it ever has after the recent moves.
The real warnings of the 1987 crash were the full bodies red candles.
If we’re looking for warnings of the same move, we should be looking for these full bodies red candles.
Yesterday was one and so far Asia/EU has failed to rally to prevent it being possible today will be one.

And this is actually the whole case for positioning for a crash today. Because hypothetically if we go into this full bar downtrend style of move - we will never get a better price to short and it will always feel it’s prudent to wait for a bounce - which just never comes.
Betting on this we’d have tight stops (Because we’re betting on a very specific style of drop) and we could trail stops behind the high of the last day if it works. One day of it working and this is a risk free bet on a mega move. The probability does not have to be that high when the RR is that good, and the probability isn’t terrible.
A break like this I’d consider sub-optimal for trading. Money can be made in it trading aggressively but a lot more could be made if we put in a simple rally and would position bigger, with tighter stops higher.
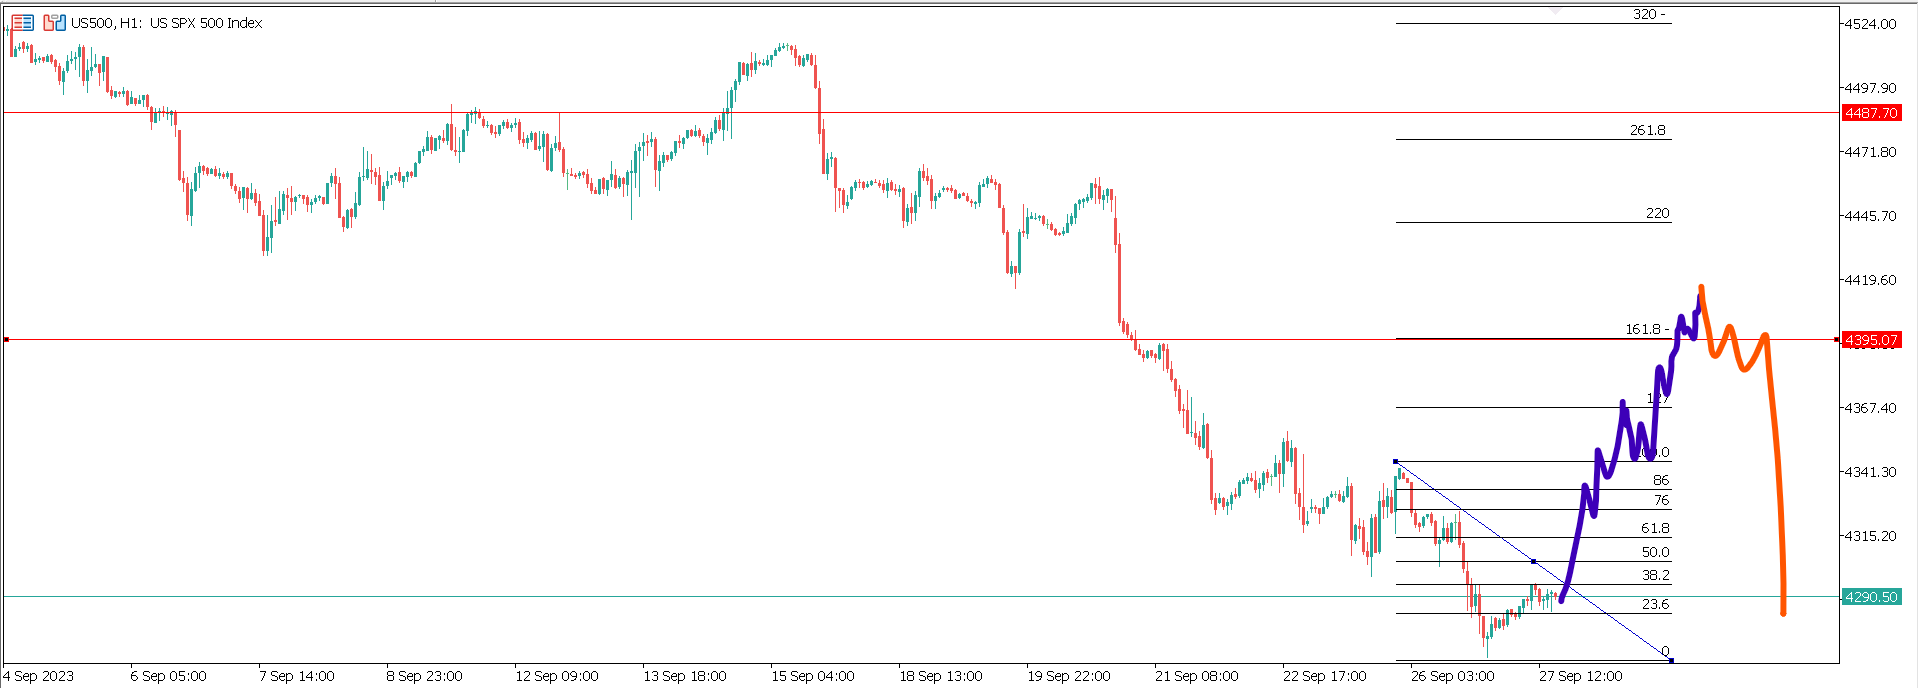
This is the move I hope happens. If this move happens we’d have really good spot to bet on a crash (Similar setup to the one proposed recently but I’d have posted that just one swing too early).
A rally from here would be a nice 1.61 low and put us on track for our basic bear correction and break model.
1.61 Head Fake Reversal Strategy - by HoleyProfit (substack.com)
Nailing a Downtrend: Planning and Trading Each Section. (substack.com)
I’d so much prefer this to the straight up breaks off shallow rallies, but it’s foolish to think the market should care about your preferences.
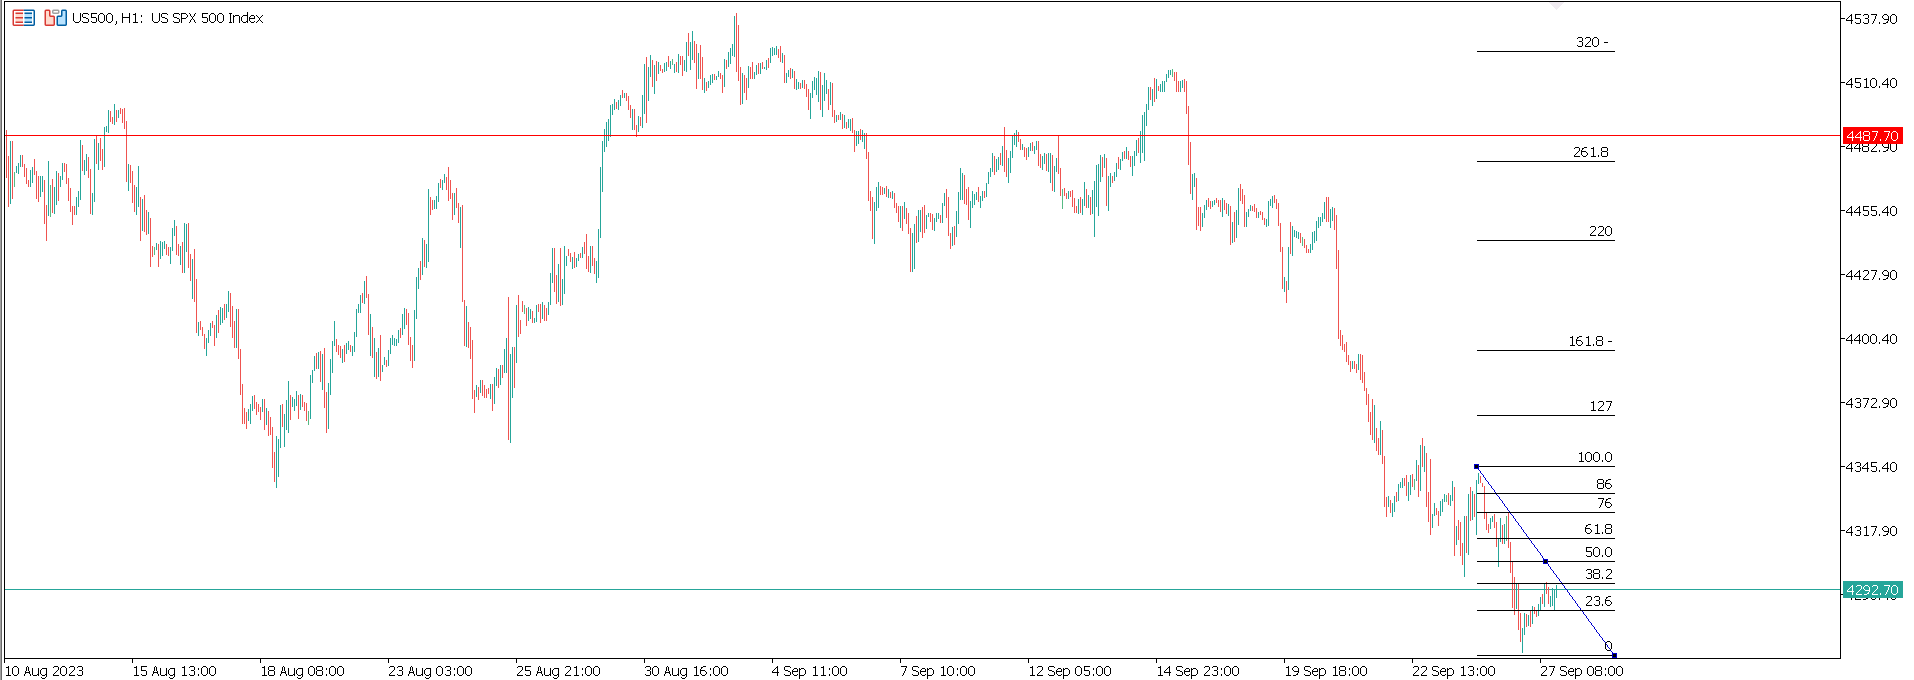
At this point we have to consider the risk we’re in wave 3 of a weekly bear trend. During wave 3, all of the deeper retracement patterns fail.
We have to follow the 1.61 momentum breaks.
1.61 Momentum Breakouts - by HoleyProfit (substack.com)
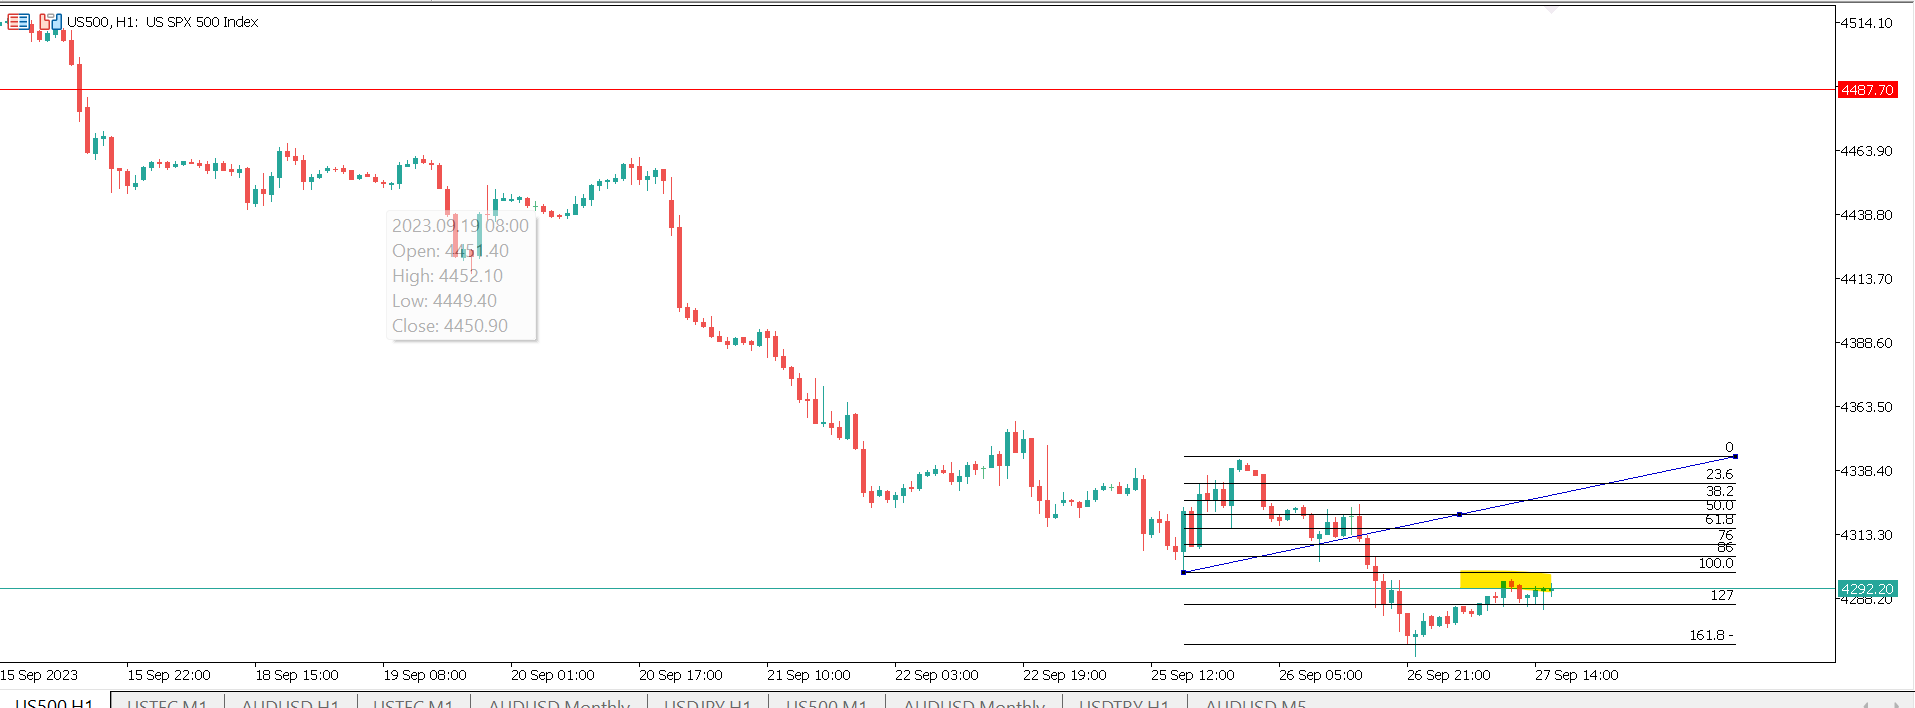
In the 1.61 failures max bounces will be just above the 1.27 and we want to do all of our positioning just above this level. Where we are now.
Now, let’s talk about specific crash bets. In terms of spot trading, it’s really easy. Just build up positions into all the rallies and breaks and trail stops based on structure. It’s as easy as can be if you know the basics of downtrend formation. What’s more tricky is puts.
It’s not the strike prices - we have very accurate ways to forecast where I’d expect prices to hit. It’s how much time do we need? It’s unrealistic to take the time scale of 1987 1:1 given the changes in market mechanics - so how are we to attempt to pick good time scales?
We’ll do strikes first, that’s the easy bit.
Keep reading with a 7-day free trial
Subscribe to Market Forecasts and Trade Plans to keep reading this post and get 7 days of free access to the full post archives.