

Every possible bull trap since 1929.
Reviewing all versions of price moves that looked like current ones in history.

To bear or not to bear? This is the question.
And to help us answer this question we’re going to look at every analogous example of what we have in current chart patterns since 1929.
We’re going to use rules of:
Structure break
Follow through
Some form of rally
New high is a failed bull trap
A drop bigger than first fall is a successful bull trap
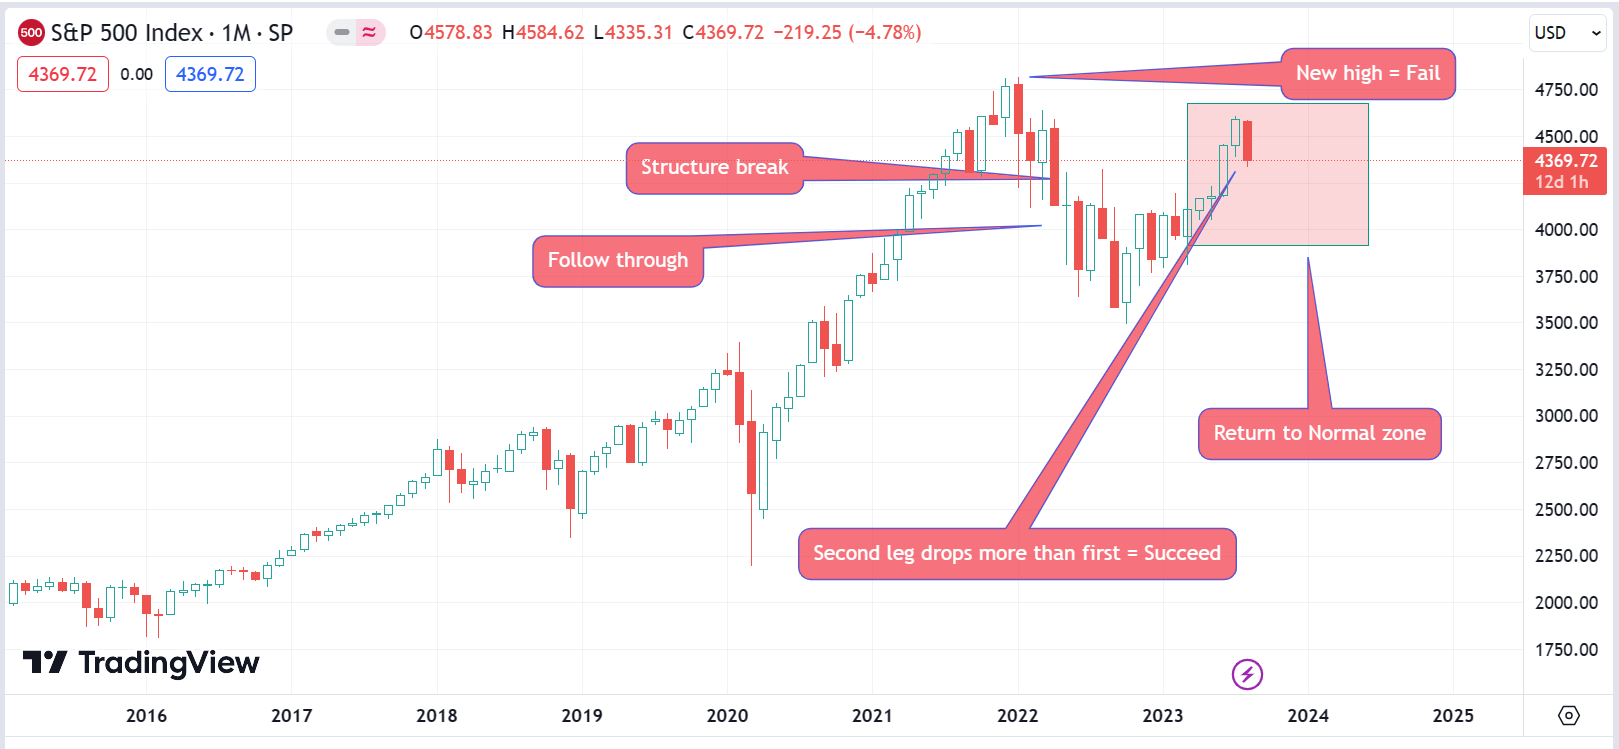
Where applicable we’ll also make note of times there’s a deep retracement of the drop and then a strong sell off, such as we have now. We’ll look at the number of times this happens in a failed return to normal.

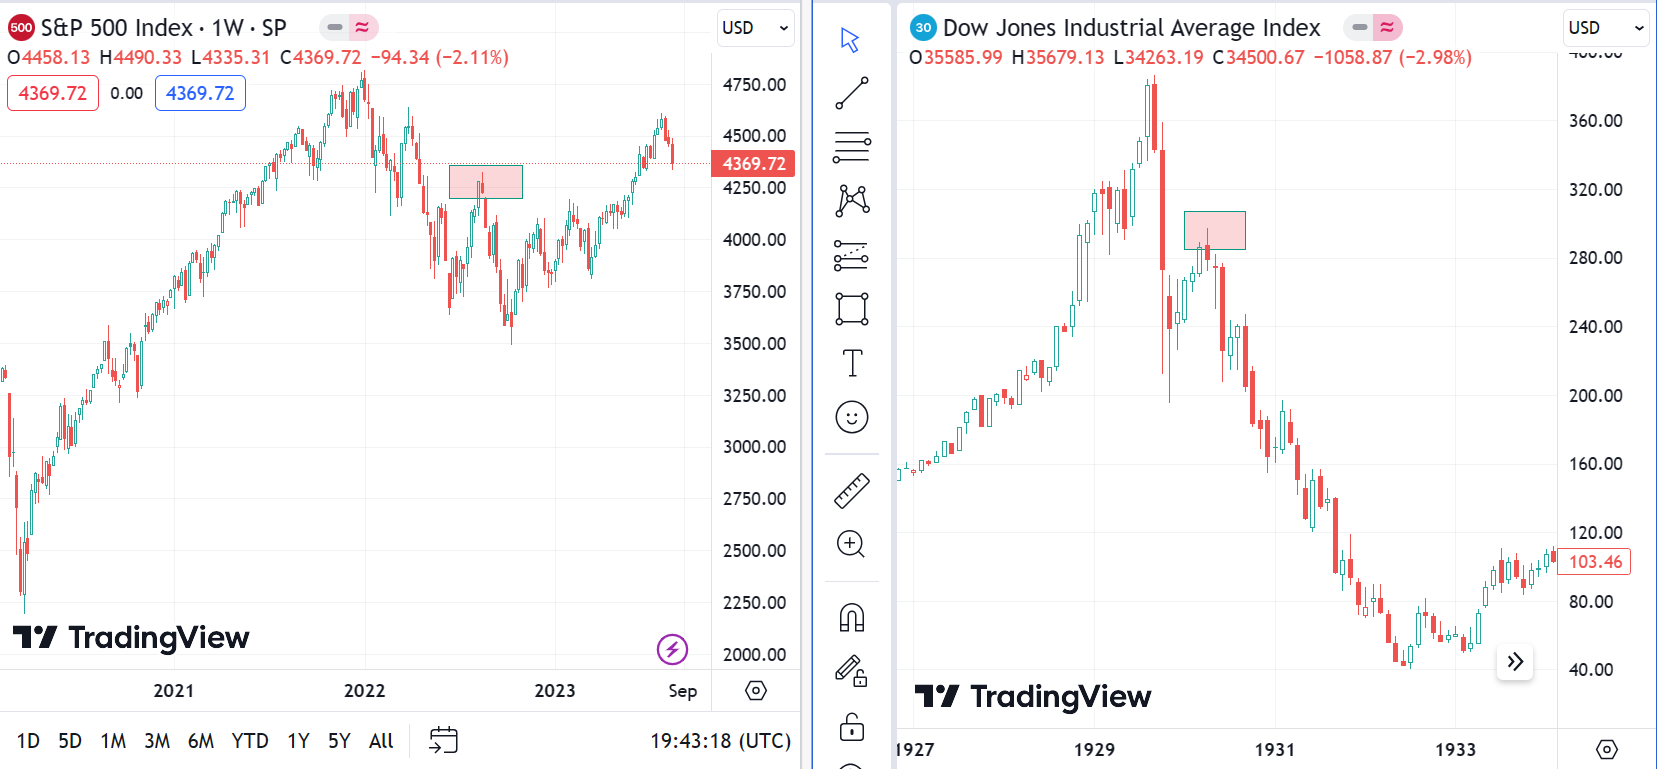
1929 is the poster boy for bull traps.

The sharp break. Shallow dead-cat bounce and then the strong downtrend.
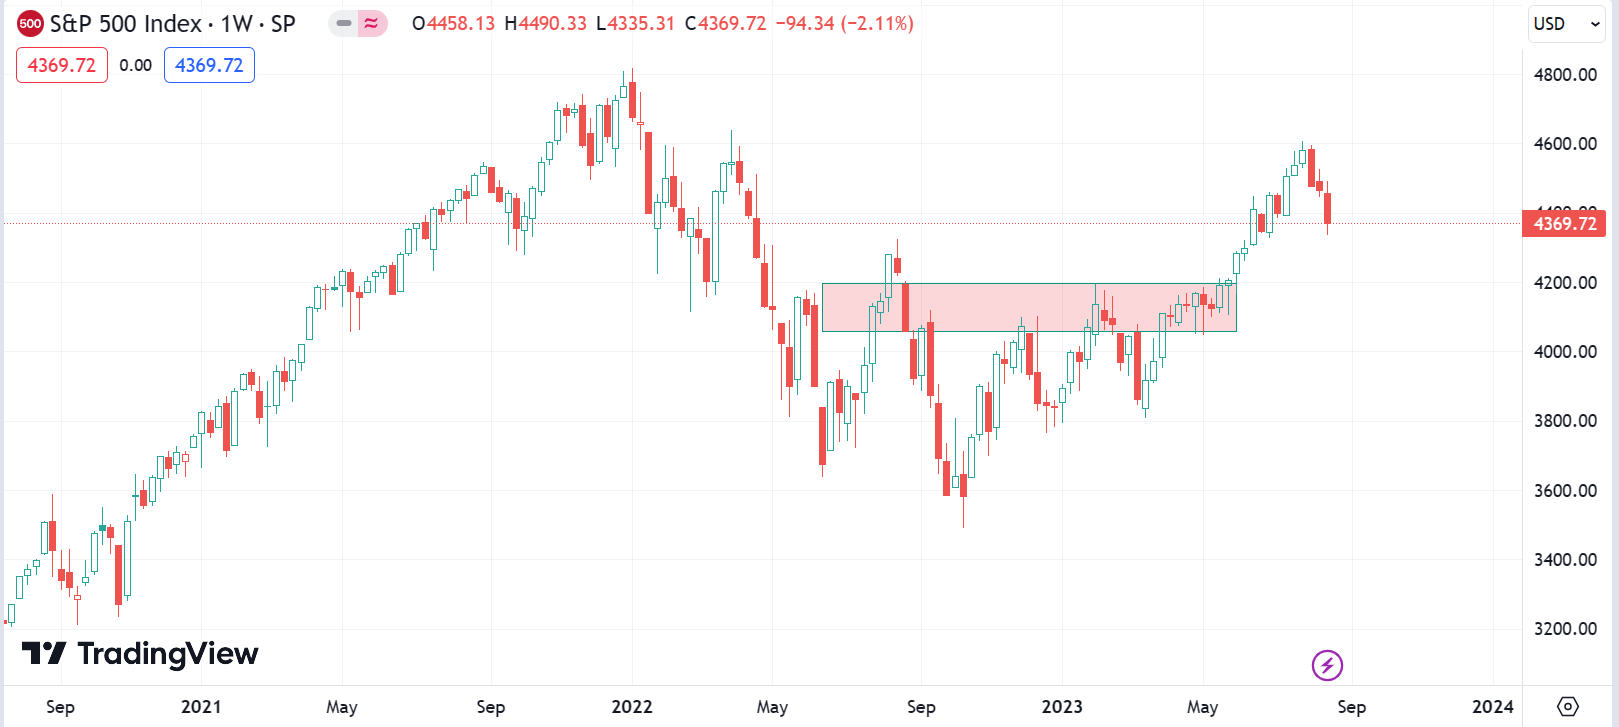
If you look back at posts from early in 2023, this is what bears were expecting. There was extreme bearishness and calls for a bull trap in the highlighted area.
During the left-hand side of this I was very much in bear camp. By the right-hand side of it I’d switched to saying 4500 minimum. This was incredibly unpopular at the time. I recently checked my monthly Twitter follower stats and during the months of talking about the bullish reversal in early 2023 I lost followers every month.
Paid readers of this newsletter crashed 30% when we announced a full pivot to bull. During this time I thought our analysis was well thought out and presented well. The bull case was good. The points for the bear case were all debunkable. Often things touted as bear signals actually historically implied rallies (Such as FED rates).
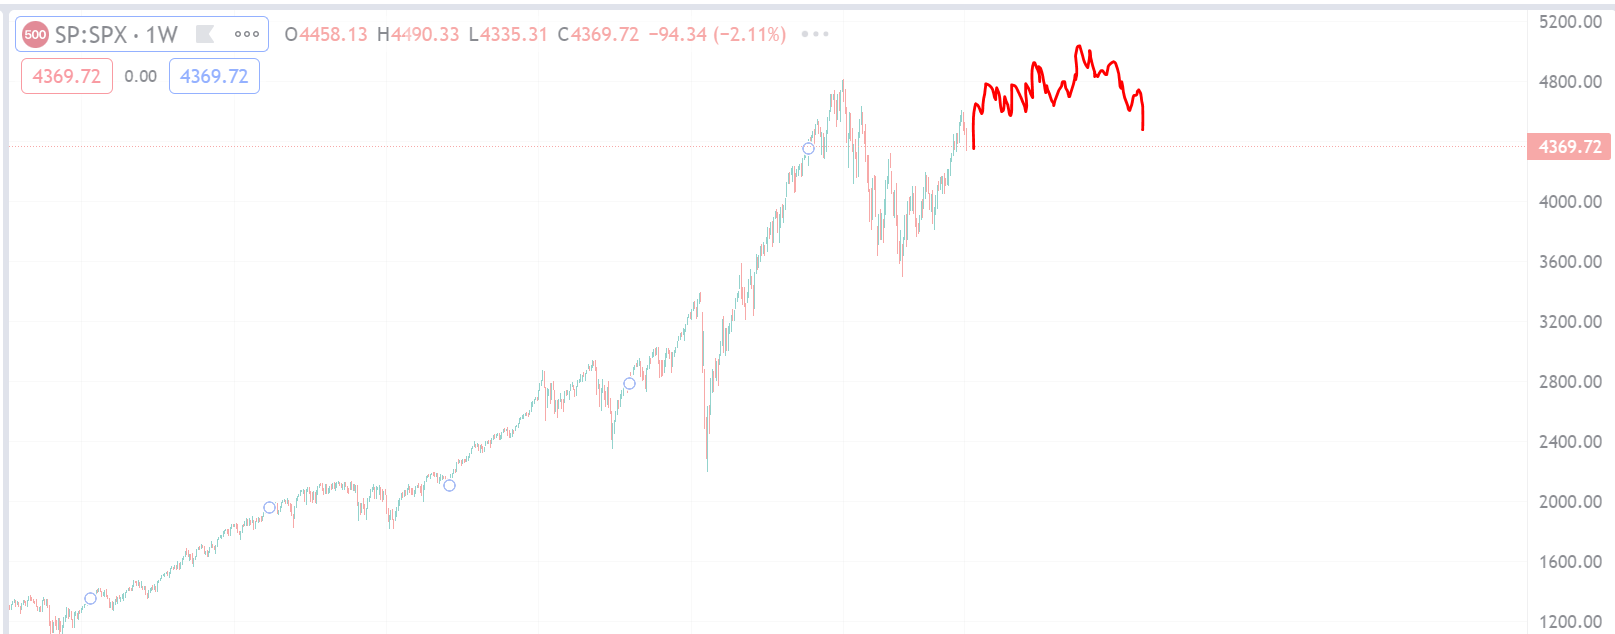
In the mind’s of the bears, we had to be here.
And they were not quick to notice that the breakout had failed. That if we were indeed there, several months later we should have been much lower. Any profits on SPX shorts would have drew down 80% even if they were from the very top tick. I’ve had that happen to me many times before.
It’s the risk you take when you think there can be only be what you’re looking for. In reality, very similar setups to the action we had at the SPX low happen in all different types of market conditions. I was quick to adjust in this area because I’ve been in that situation as a short 1,000s of times and know different variants of the patterns.
The aim of this post is to help you gain more context about price usually moves after there has been a strong down leg and bounce.
Macro Notes
Context is King and it should be said that the context of how far extended the rallies are from the 2008 lows and even since the 2020 lows is not considered in the tests. This context does matter, but it might not matter in the near term.
Here are posts that cover the considerations of a macro top.
The case for a macro bear has now fully developed. (substack.com) Makes the case for us being somewhere in the top of a mega trend over the last 30 - 50 years. This is context. The other examples would all just be small parts of this mega trend.
Let's talk about the classic bubble model - by HoleyProfit (substack.com) Makes the case for spike outs. The first post covers purest TA forecast and the second one covers realistic caveats from real crashes
The macro context does not change much near term. It just warns us to be much more cautious about being wrong and willing to pivot bear, because if we enter into a real down trend for all we know we could down trend all the way through 2023 rally and never see the price we’re at again. SPX breaking here could be the start of a drop to 2000. Don’t want to be too slow getting the memo for that.
But big big things can happen agonisingly slowly. I do not think the problem with crashes is seeing a crash setting up, that’s easy. The problem is if you know to look for it, you’ll tend to see the crash setting up too early. It’s easy to underestimate the amount of time you can be wrong on a big chart forecast.
Think about it in price candles. A forecast on a monthly chart is wrong for a year if there are 12 candles. SPX could be due to make a tiny little head-fake but it forms over many little swings and ends up taking 20 - 30 candles.
Very big context things will matter when they matter. They’ll be all that matters when they matter, but we can very plainly see in markets that 99% of the time they do not matter. What is happening in this specific swing is what matters. We can not just assume the high is here and now because it makes sense a bear thesis.
This is okay for investing and making decisions to get out of the market. I am fully behind that. It’s not enough to engage short strategies. We need to know how the short setups in these areas typically form and fail and then we can build rules that give us most profit exposure with least risk exposure.
The Test
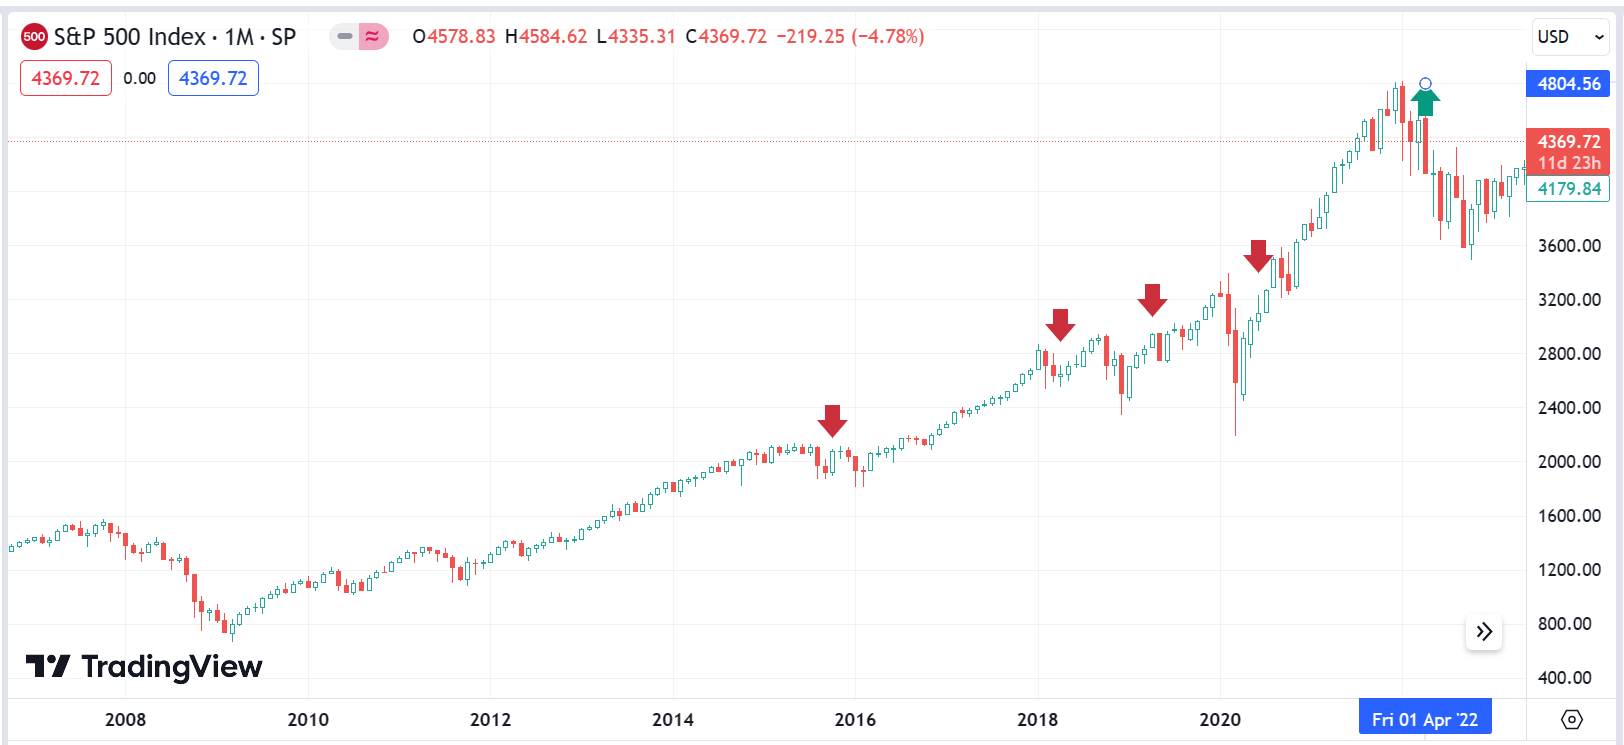
We’re only looking for moves that could be considered bubble like in real time. When strong trends turn to sharp breaks. We’re going to ignore ranges or other less relevant type of action (Because it’s happening 1,000s of times). We’ll use SPX monthly chart. Track success rate and make commonalities notes.
“RTN trap” is when there’s a drop, rally and then a bear trap in an area similar to where indices trade now.
Down arrows are failed signals and up arrows are successful.

So here we have one success and three fails with the third fail being a RTN trap. If you were looking for a deep retrace and drop, you’d have got early signals of one.
Score: 1/4
RTN trap ratio 1/3

Two successes and nine fails.
Puts us net 3/12.
6/6 were RTN traps. So far we have a 50% chance of this type of move happening when a new high will be made.
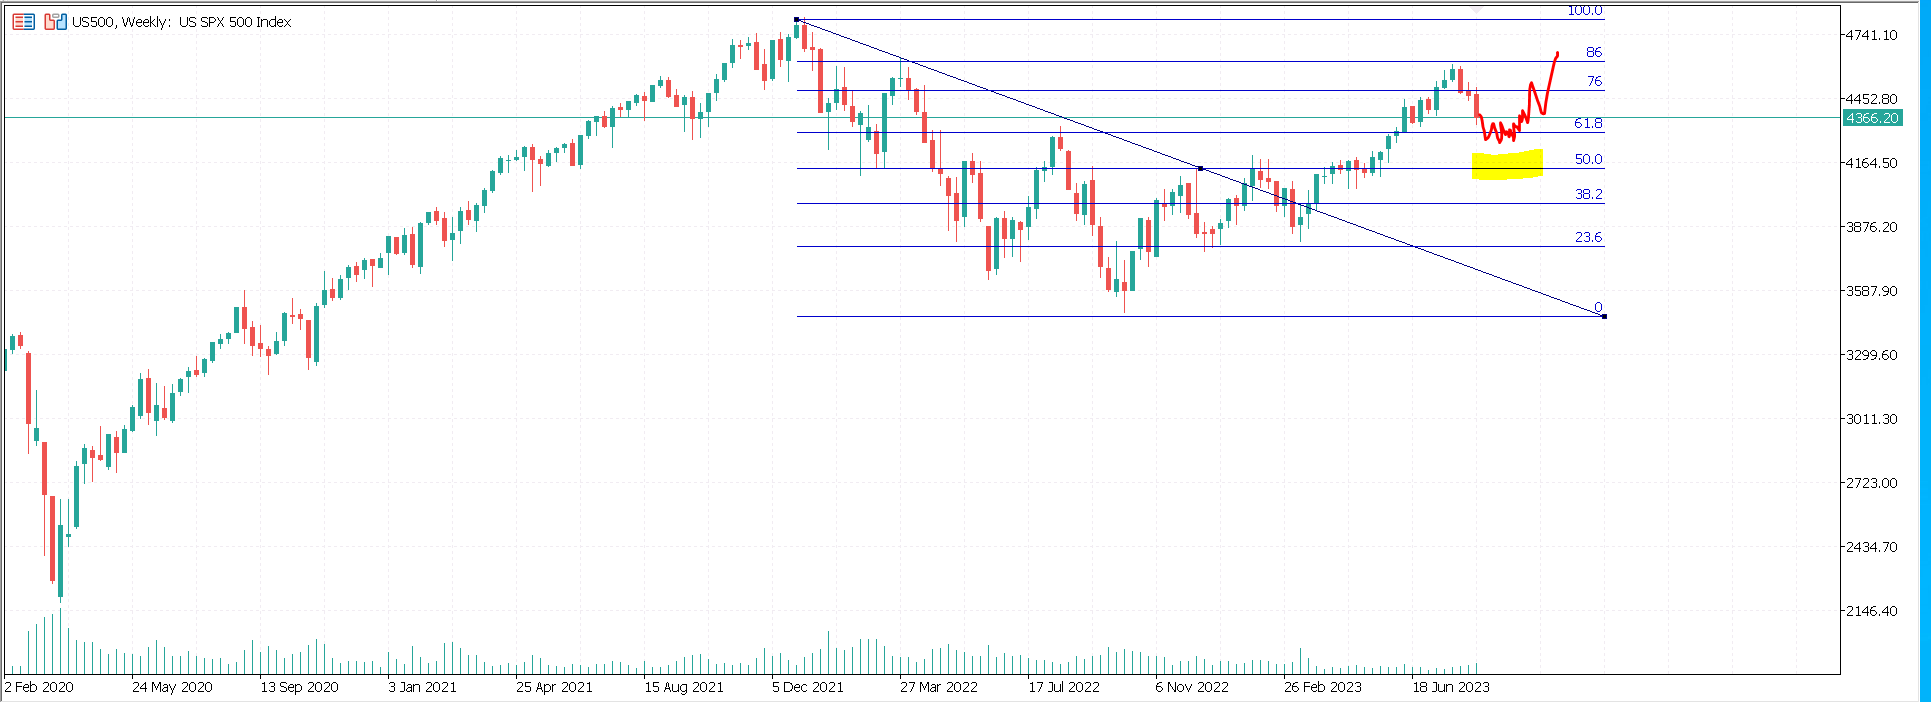
Taking a closer look at one of these that looks very similar to our current SPX. You can see these rules I am presenting would have worked well. If the 86 has hit expect a pullback. There are a few zones is can go to. Usually easy to trade breaks of one and hits of the next.

Everything I’ve said about our big decision levels in SPX recently sync up with this. 61 is probably a critical support. It might spike out but 61 should be important hold for bulls and break for bears.
Next

2/4. Total score 5/15. We’re at 1985 and we started 1930. About 30% hit rate during this 50 year period. This was one of the better periods to be a bear. There are lots of time the market had pretty decent sell-offs here. There would be several crashes. None to extremes, but it was not bad conditions for bears. 30%.
We have one RTN trap and one not. 7/7 RTN trap/rally through. The odds of this remain 50/50. This happens as often in a bull move as a clean breakout.
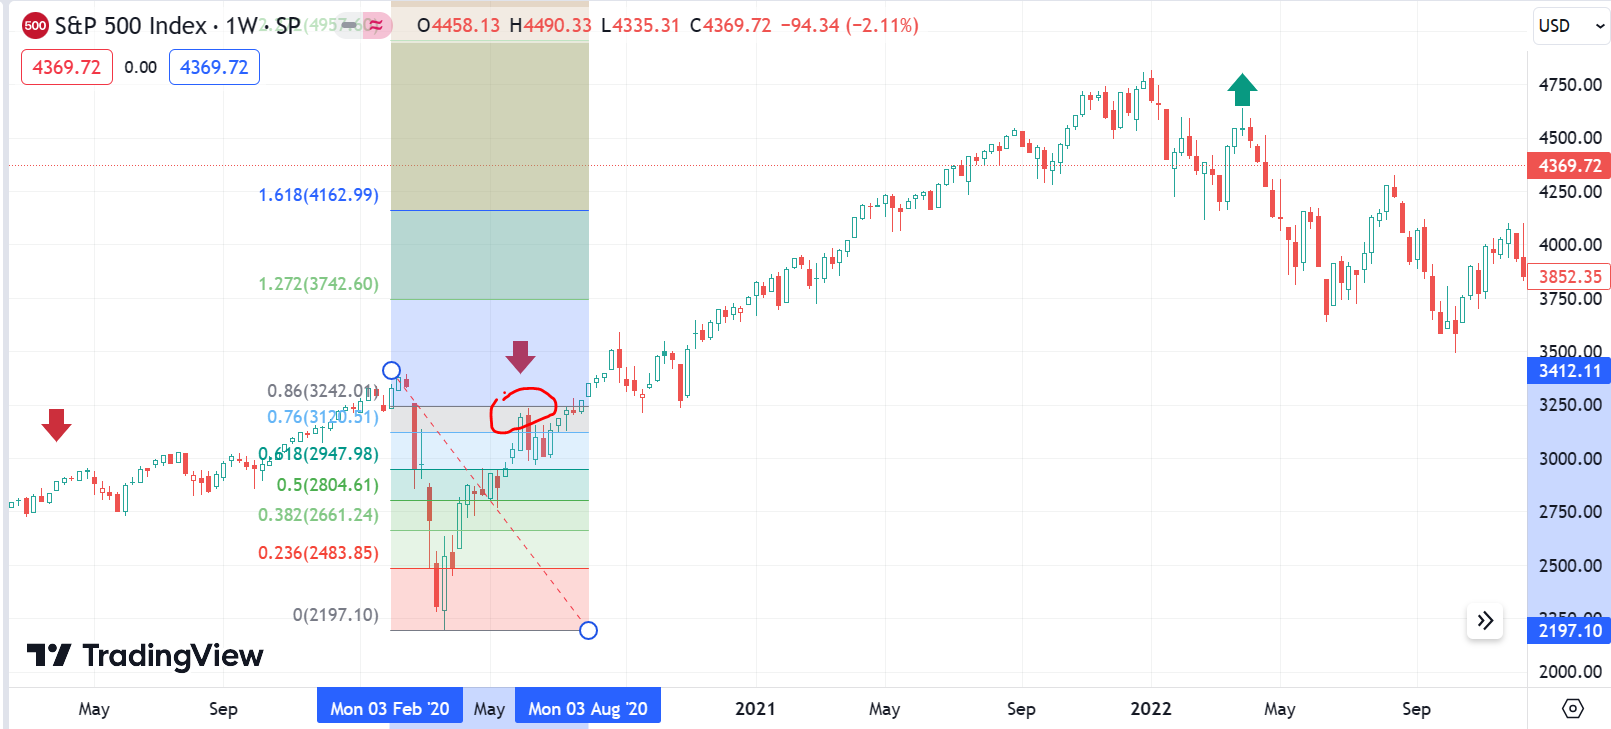
Looking closer at our bear trend failure. Red circle is the failure of the bear trend and blue circle is the entry for a reversal.

Corresponds exactly to our bull pivot. It was this false start, failed new low and break of 76 that triggered our exit. Then we said buy the dip.

The market comes off the 86 fib for the retracement and it holds 61 after a spike out.

Our analysis first called for the drop off the 86 and then longs into various possible fib supports. With an extreme focus being put on spike risk as we get into the 61 fib.

Do your homework, my bear friends. These charts DO NOT look different. I know there’s context but that might not matter in the next swing.
Drop - Same.
Bottom - Same.
Failure pattern at low - Same.
Retracement level - Same.
What you’d have thought as a bear in real time - Same!
You can, and do, see all stages we’ve seen recently in a bull move. All different types of bull moves.
Couple things on this setup. One, I just showed you a move from the 70/80s in which all the price swings directly matched the ones we have recently. And I also showed you how I made optimal decisions around the big areas of this using simple pattern rules. This annuls any idea none of this makes sense because the algos.
Secondly, after this setup SPX went up for 8 months in a row.

Not saying this will happen now (Might). Just saying lol at the concept this is exclusively a bearish setup. These can be hyper bullish.
Okay. Moving on. The 80s are over. We’re 30% high rate (5/15) and we have a false bear signal forming in the area we currently trade 50% of the time. If we’d traded bull trap setups at 1:3 RR over the last few decades we’d have made a net loss, even after hitting every bear drop that had a bull trap.
These are not the best odds. I’m not saying these types of bear trades do not come … but these are not odds to be betting on blindly. Based on what we’ve discovered so far, blindly betting on these types of setups after a drop is a sucker bet*. You’ll win some, but the overall odds predict you’ll lose overall.
(*No offence intended. It’s just a term for making bets that are expected to lose overall but will hit often enough to sucker you into taking them).
The 80s are over. Let’s get on with the test. If you don’t want any spoilers look away now and also forget everything that happened in the last 30 years.
The spoiler is, selling rips didn’t get easier after the 80s!
Onward and upward. 6 losing signals in a row.

5/21 overall. 3 RTN traps out of 6. 10/10 overall.
Win rate drops to under 25% with the false signal rate remaining at 50%.
The market beings to bubble. Bears run 2/4 on bull trap setups.
7/23. Again 50/50 on traps. 12/12.
In to the time of the bear. Runs 1/4.

Which is not enough to make money catching the high to low of the 2008 swing. This is breakeven, at best.
8/27. 2/4 were RTN traps. 14/14 on that.
Into the high we have 1/4. Again, not enough to breakeven trading high to low of 2022.
9/27 and 16/16.
The success rate of this signal is 1/3. 66% of the time it fails. In at the very least half of the instances it fails there is a drop off the area SPX trades in.
I say at the very least because I counted in shallow bulls traps (Which would not have qualified for this signal). If I removed these, the odds would be over 75%.
Secondly, I used a monthly chart. If I used smaller charts you’d have seen this pullback more. For example, 2020 does not qualify as a RTN trap on monthly - but it was.
The statistical odds of this being a bear trap forming are 75% based on SPX history.

The statistical odds of there being a sell off from this area are 50% if I do everything I can to bring down the percentage. Realistically, it’s at least 75%.

The levels at which this signal has most commonly failed are the 76/61 and 50 fibs.
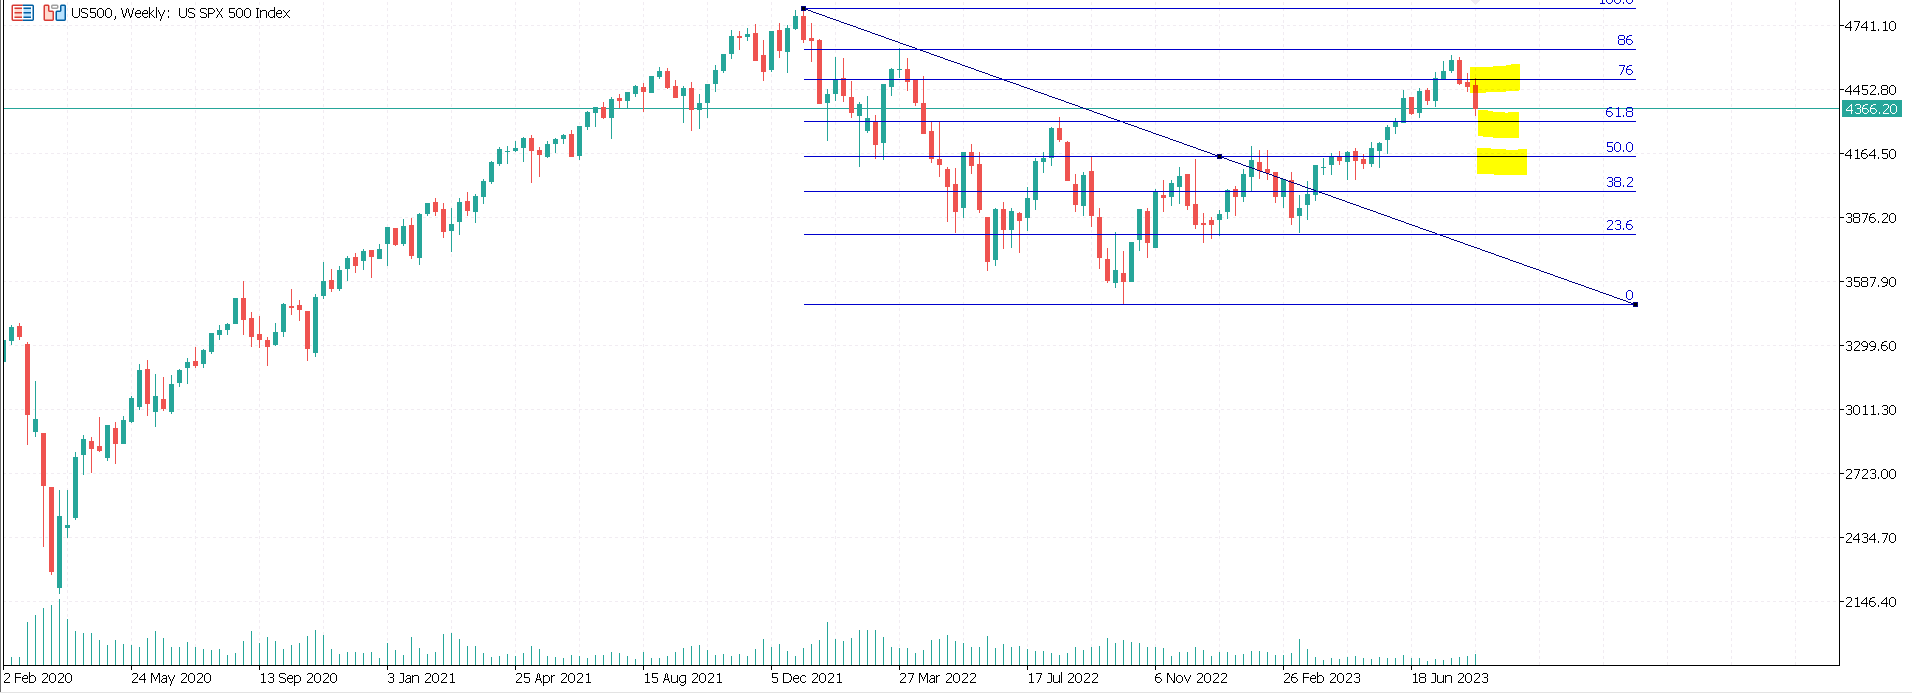
With the market most commonly being in an uptrend when 61 holds (Spike outs ca happen and probably should be expected in these conditions).

The probability of a bear move here is very low. It is not the slam-dunk many seem to be assuming it is.
Now - let me be clear, 1/3 odds mean that 1/3 times it happens. It’s not saying it can’t happen. All I am saying is to act like it’s the only thing that can happen is silly. Most of the time, if you do this you’ll be wrong. Also, if you do this as a default strategy you’re expected to hit the crash and make a net breakeven result.
Anyone telling you this is a simple setup has not done their homework. If the bear break comes, it’s easy to know what to do but if the bear break fails there are various types of moderate to strong bull moves that can come out of it. If the odds are 3/4 for the bulls, does it make sense to take 1:10 RR longs? It does if you like maths.
In most historical instances markets made these sets of swings, massive opportunities to profit came after. This happened damned close to 100% of the time.
75% of these were bullish opportunities and 33% of them were bears.
I don’t care which way it goes, I just see how much it’s always sucked to be on the wrong side and want to make sure I am quick to drop a losing bias.