
Let's talk about interest rates, inflations and markets.
Let's talk about interest rates, inflations and markets.

Classic economic theory states when interest rates go up markets go down and on social media bears act like anyone not betting on this is a fool.
But what’s the historic reality? Well, I checked. The odds of this being right are not as good as a coin flip.
Historically out of five occasions rates were raised at very best you could do for bears is give them a 20% chance. The maximum drop in SPX on interest rate rises is historically 17%. The maximum gain is historically double that at around 35%. When SPX dropped 18% from March 2022 to the low - this completed the maximum expected move on rising interest rates as per the historic norms.
I didn’t bother to check this before because it’s not relevant. My TA forecasts of a bear were posted in 2021 and the interest rates stuff came in 2022. When I said long USD in 2021 the only thing people spoke about was inflation. So checking this didn’t matter to me. I already had my plans.
When I was revering long I did the most basic due diligence on interest rates. A lot of people were telling me I was doing something very foolish and just to cover my butt I checked. But all I checked was time from interest rate hikes to a market high and I checked for the dates I know there are significant market highs.
I bought into the narrative interest rates drop markets and I was just curious as to what sort of time delay was possible. Of course, as my findings at the time suggest and as markets have proven since, stocks can rally on interest rate increases. Often making new highs, my research found.
But it was only when I went through the systematic backtest of every single possible bull trap over the last 80 yrs something struck me. That things was, the 70s were actually quite uptrending. I’d never paid much attention to the 70s because it’s flat on the monthly chart - but daily chart kinda uptrends.
I was happy about this because a few times I’ve wondered if after hyper trending markets we’d have a long slow range like the 70s in my life time and if that’d be bad for trading but it turns out the 70s were epic. Lots of big ups, lots of big downs. I’d have enjoyed them.
But then I thought something else. Something I really should have thought about before. I thought, “Didn’t something happen in the 70s?” Something to do with … interest rates. Actually, wasn’t the 70s the time when interest rates went from 5% to 20%?

And it was. And by this point I’d just looked through the entire 70s and there is notably no major crash. There are various big corrections but the 70s there’s no big crash. It was a really strong buy the dip market.
This is what happened.
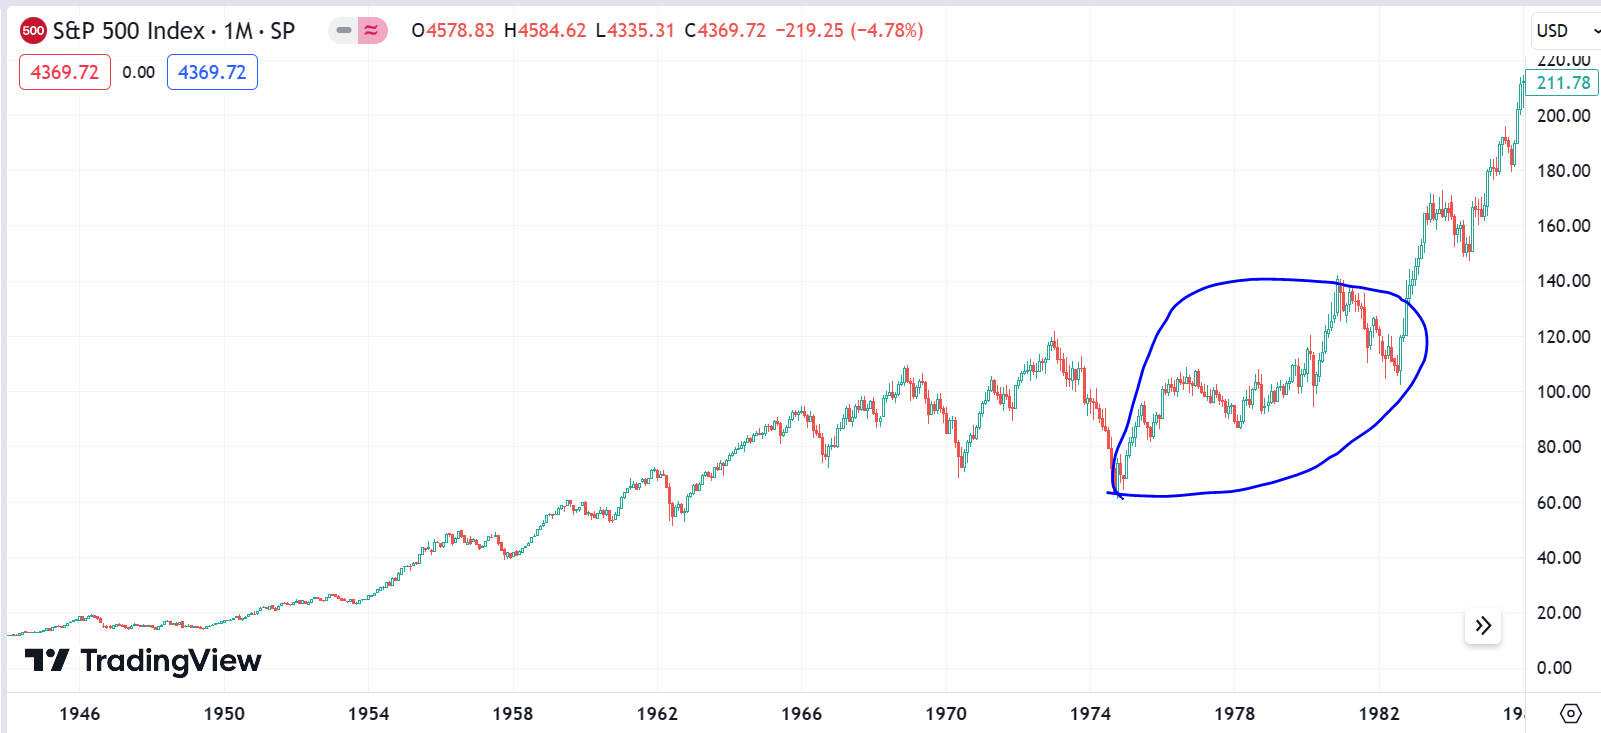
And this really caught my attention because in the bull trap analysis post I’d happened to pick out this exact sequence of price swings to show how we have similar price swings in the current SPX chart.


So here’s the situation. The last time the FED did these things with interest rates and charts looked like this, there was no notable bear market and price was flat at best. Overall it was more of an uptrend. This is while we had the exact same economic outlook, at least in terms of interest rates.
That’s the actual facts of the matter. For all the hot wind that’s been blown over the last year. For all the jeering of the “Pivot bois” and for all the condescending confidence the interest rate analysis bears have presented - this is the actual facts for the matter.
I can’t help but feel someone who calls this area of analysis their home should have mentioned this. I’ve read analysis of people who call this their niche. They should have mentioned this. In hindsight, this is stupidly obvious and I should have checked it myself but it heavily discredits analysis from people who use this metric and didn’t mention it.
None of this affects my analysis in any way at all. To be honest with you, I don’t even know what the US interest rate is right now. I think it’s 5%. If it is, I know that in the same way you know the words to an advertising jingle. You don’t seek it out, you just take it in because it’s there. If the rate is not 5%, then that just shows how little I care.
Not knowing these things has not inhibited me from having predominantly the correct bias in all big swings over the last couple years and to find out interest rates can be seen as (At the very best) a neutral indicator is not going to change the sequence of rules I am going to use to make my next decisions. I just think you should know.
People speak about interest rates as if it’s a 100% signal and it’s actually a 20% signal in which the max historic drop is 17% and we’ve completed 18%.
It might be different this time - but there’s actually no historical basis to support a short SPX thesis based on interest rates.
We’ll carry on as normal. Same decision tree to determine if we’re bull or bear. I just wanted to let you know that the persistent objections to bull analysis that have been raised since the end of 2022 are actually invalid. The real market reactions do not predict the same as the predictions of those talking about.
Please note: I draw lines on charts. It may be I missing important context here. I don’t know the interest rate today so I’m not exactly schooled up on the 70s (Before I was even born). I am open to learning if people can explain things I do not understand about this.
But people should also know the real facts of history.
Actually macro analysts (at least good one) say that current situation is more like 1940s than 1970s. Or at least will be. US government debt in 1970s was fairly low while in 1940s it was high and they fixed the interest rate on treasuries by bounding the treasury prices from below to burn the debt through inflation. The USA government is acting as if it was 1970s and it is fighting inflation, but that's shouldn't last since the debt servicing amount will soon be getting to an obscene percentage of the budget.
As a suggestion/request. Could you take a look at treasury prices (maybe TLT) for the signs of bottoming?