Post FOMO update
See first FOMC thoughts and plans - by HoleyProfit (substack.com)
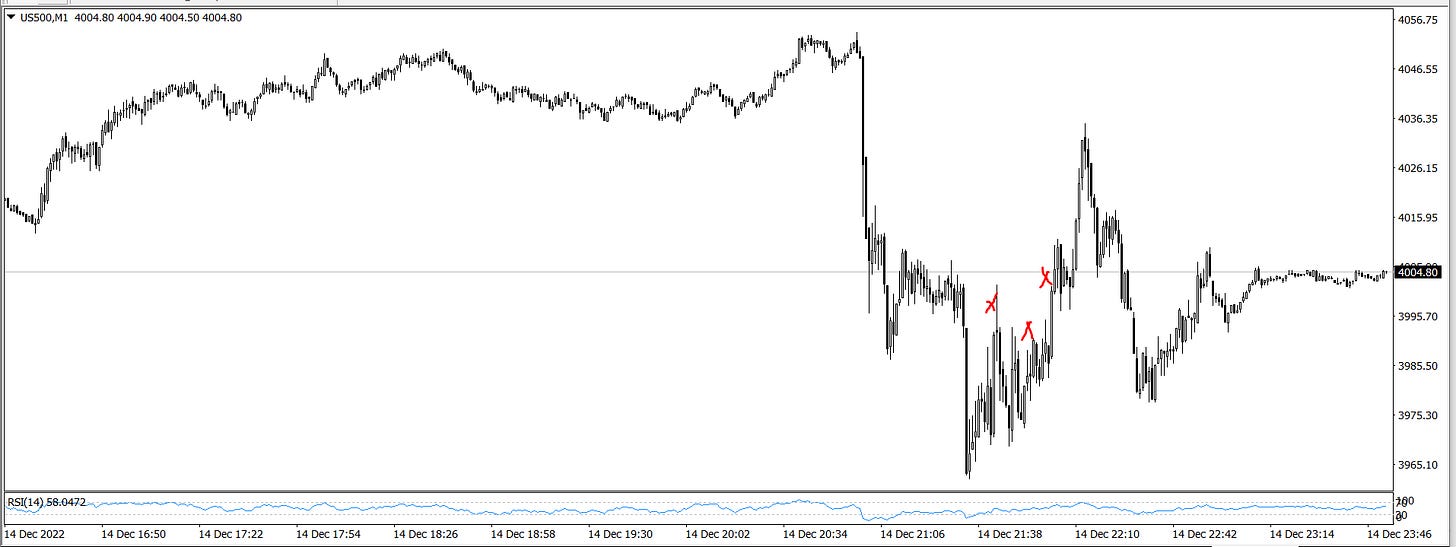
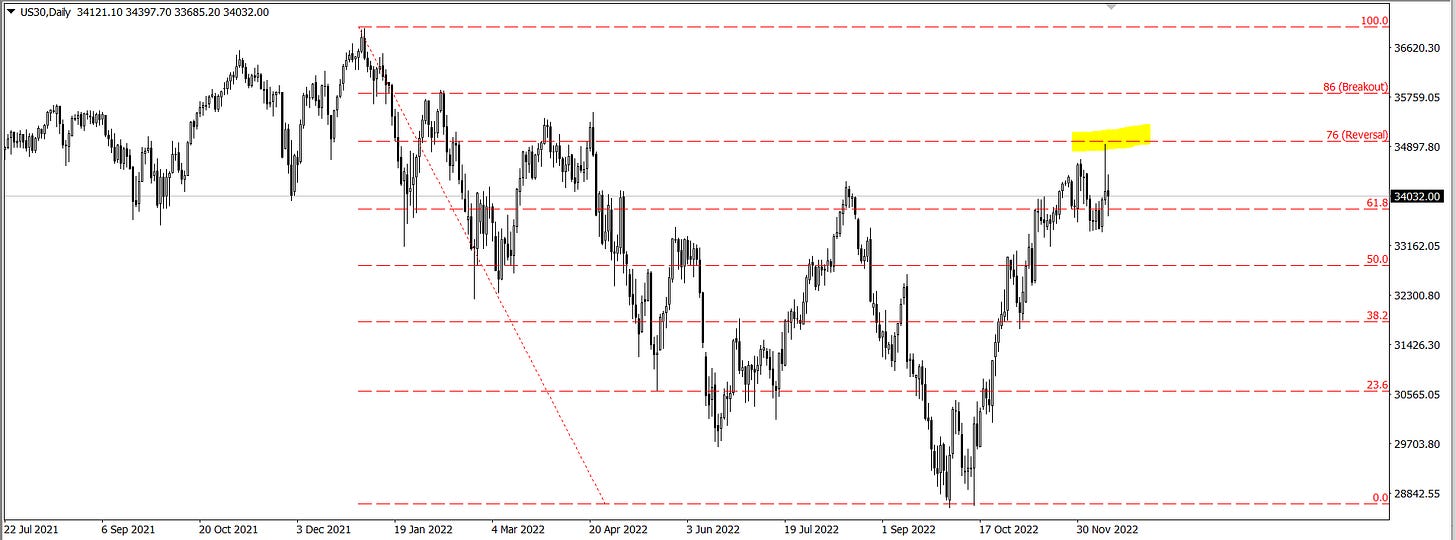
Forecast was to look for a 76 retracement and also to look for bear breaks. False signal generated on the bear break but the proposed area for larger trades on the 76 retracement currently holds well.
Forecast:
Actual
The error made here getting caught in a false breakout (Assuming we’re now into a downtrend) was thinking we’d seen wave five completing already.
In real time, this section looks a lot like the properties we’re looking for in wave 5.
But (Again, assuming we have a correct EW count here and a new downtrend has started) this period would have really just been the messy wave 4 area. As a guideline rule, wave 5 will extend 161 of wave 4. If we were to look at that whole choppy section as wave 4, this is what happened.
Will have been caught in the false breakout because wave 4 imitated wave 5 (This has happened to me many times before. For example, it’s possible 2018 - 2020 was all a complex wave 4 and my early bear forecasts were a largest expression of this same mis-read).
This is what I class as an known mis-read I will make but expect to work out I’ve made this mis-read fairly early. It’s typically shown by the failure of three 76 retracement signals. You can read more about this tendency in the Understanding the Bear Market Rally post.
The above picture is from that post and it shows the three areas in which I’d expect false signals to generate. Below are the same levels marked into the SPX move we had so far.
While this generates false signals (Some of which are very hard to avoid using the trading rules I do) once this sequence of failures has happened, it’s often a lot easier to know what to do after. As I’ve said a few times recently, it’ll be easy and if not get out because it probably will become easy later.
In the template (Posed originally over a year ago) it says to look for a top to the correction 161 - 220 of the bottoming swing (See next to highest blue tick).
The SPX bounce and turn came specifically on the 161.
Another way the same level could be derived was using the 76. Which was an entry we posted in real time on Twitter.
If we’re in the Elliot sequence, the bulls have now done all they’re going to do for a while. A big correction is in, we’ve hit the 76. We’re currently in a range period which is going to set up a break into new lows. After a new low there’ll often be a shallow bounce but in a bigger picture we’re heading into a series of lower highs and lower lows.
We’d be after the “W” top section and in the first messy red range. Upon breaking out of this range, we’d go on break the lows and once we have established a break of the lows we’d be into a consistent downtrend, probably not less than 100 - 200 points without a reasonable bounce. Probably not more than 300 - 350.
The current action looks like a textbook example of the template given for EW. The only notable missing feature is a “W” style top, and this is not a requirement - the requirement is some style of top that will scare out bears and bring in buyers. That big run up more than qualifies.
The better they are, the harder they fail. If we get above the spike high on the news all of this near-term pattern analysis fails and most of it starts to imply a much more bullish bias than a bearish one. The bearish bias accepts ranges (Be patient), but it does not accept failure of overall lower high structure (Breaking of 76/86 fibs).
Above that level, all short-term bear plans fail and trigger immediate exits. I’d also think if short-term bear signals fail here there’s a high chance the bigger bear signals will fail at this level. I really think we need to see impressive, almost flawless, bears here. For the near-term patterns to remain valid and also what bigger patterns imply.
And if these really strong consistent bears do come, this could be real breaking of the final massive bull trap before a legitimate crash.
We’ve sent out newsletters far less over the last while because we’ve traded in a bit of a grey area. There’s not a lot of grey now. As per the norms we’re using for trend bias, huge macro trend decisions have to be made now. We’re seeing the start of these decisions over the last days. And they currently skew to the bear side.
The DJI has made a complete 76 retracement.
If a big bear market is what we’re in, a big bull trap high has to be what we’re seeing now (Unless it wants to make the fib Gods really sad).
By this time hopefully you’ve followed enough of our work to see what happens at big 76 levels. And it’s usually something important. If they break, that’s usually important. If they hold, I hope we’ve shown enough examples of how this basic form of trend continuation form for you to understand what we’d see in a typical 76 rejection.
The thing we show on smaller timeframes are not “Small timeframe things”. Many of the concepts used were originally learned studying major market crashes. Looking for norms, cross checking crash norms and then seeing if these same principles worked on mini booms and busts.
What happens at this level is “Probably” going to be very important. It’d be most unusual for this level to be very important.


