
The End is Neigh! Doomer Charts Special.
The End is Neigh! Doomer Charts Special.

I believe it is objectively provable that in histrionic crashes once you definitively knew a bull trap has formed and broken you could then make extremely good forecasts of the big swings. In this post we’re going to look at how to do this and the big bear swings implied if we are forming mega bull traps.
Types of Bull Traps
Bull traps fit broadly into three types.
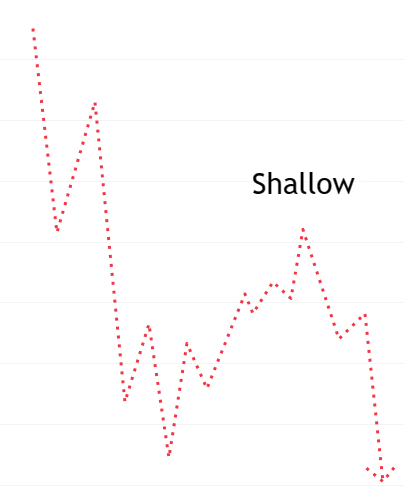
Shallow
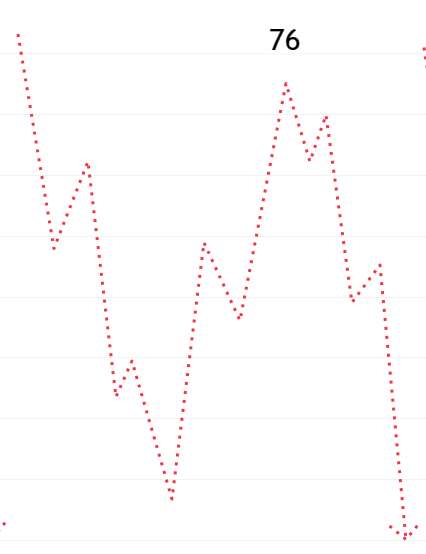
76 Retracement
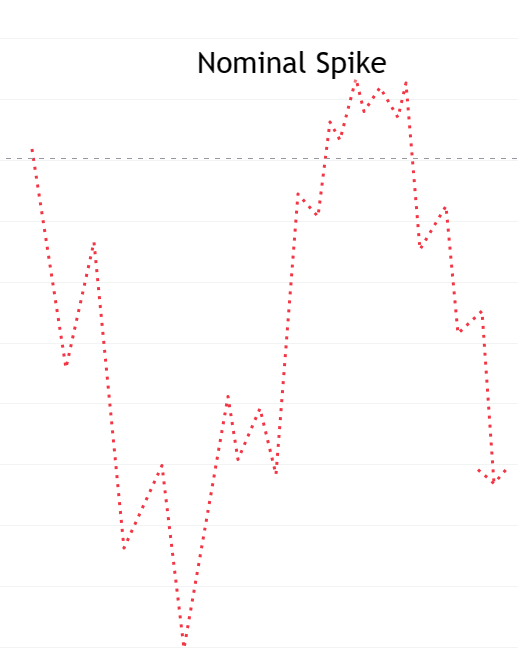
Nominal Spike
I first spoke about this concept early in 2023 when the first shallow bull trap area was filling and I said if this level fails the risk for bears is too high since very often at least the 76 fills and it’s possible it can even spike out the high. As a bear you have to respect you can be entirely correct in your thesis but any of these can happen.
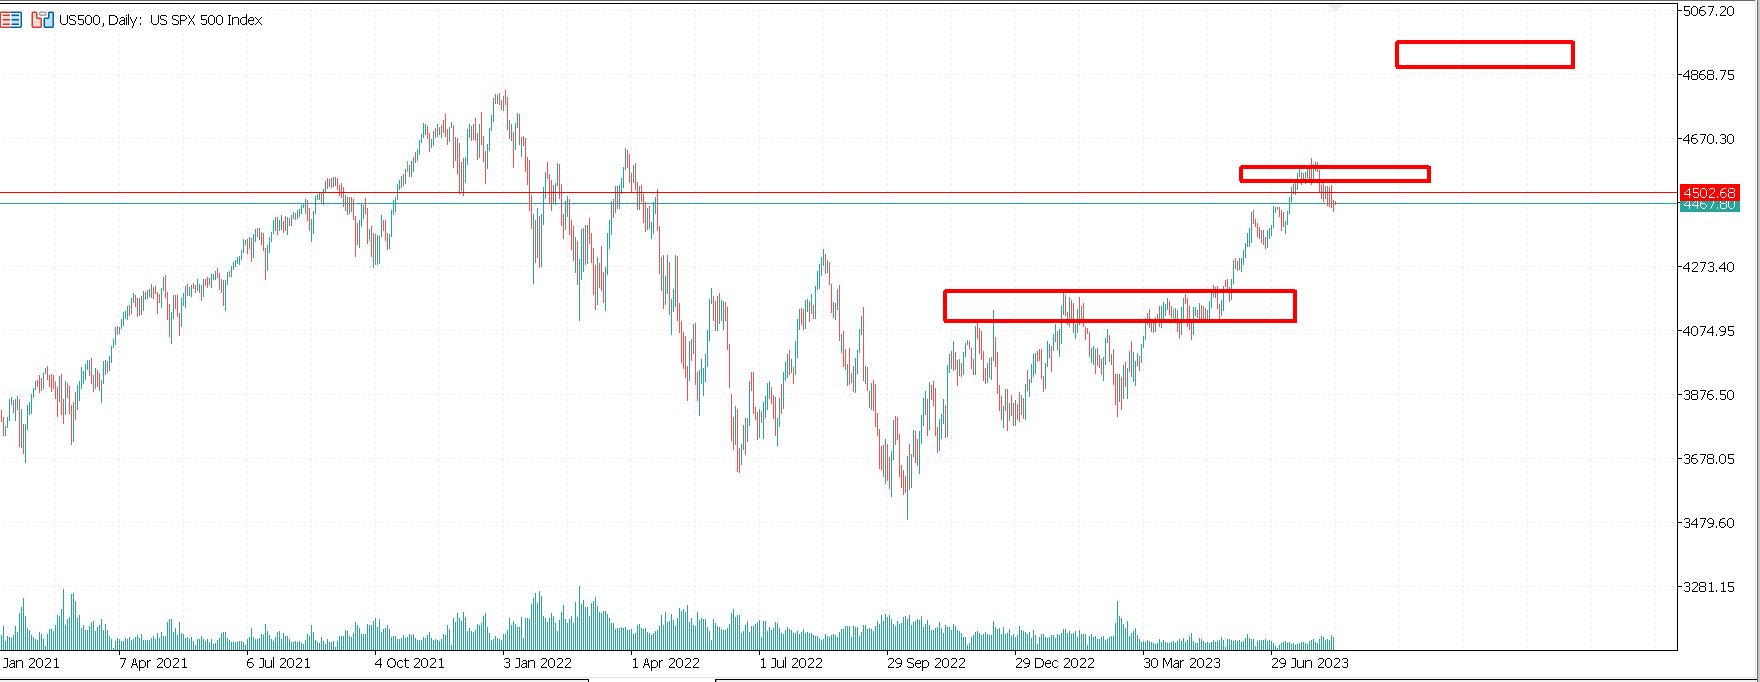
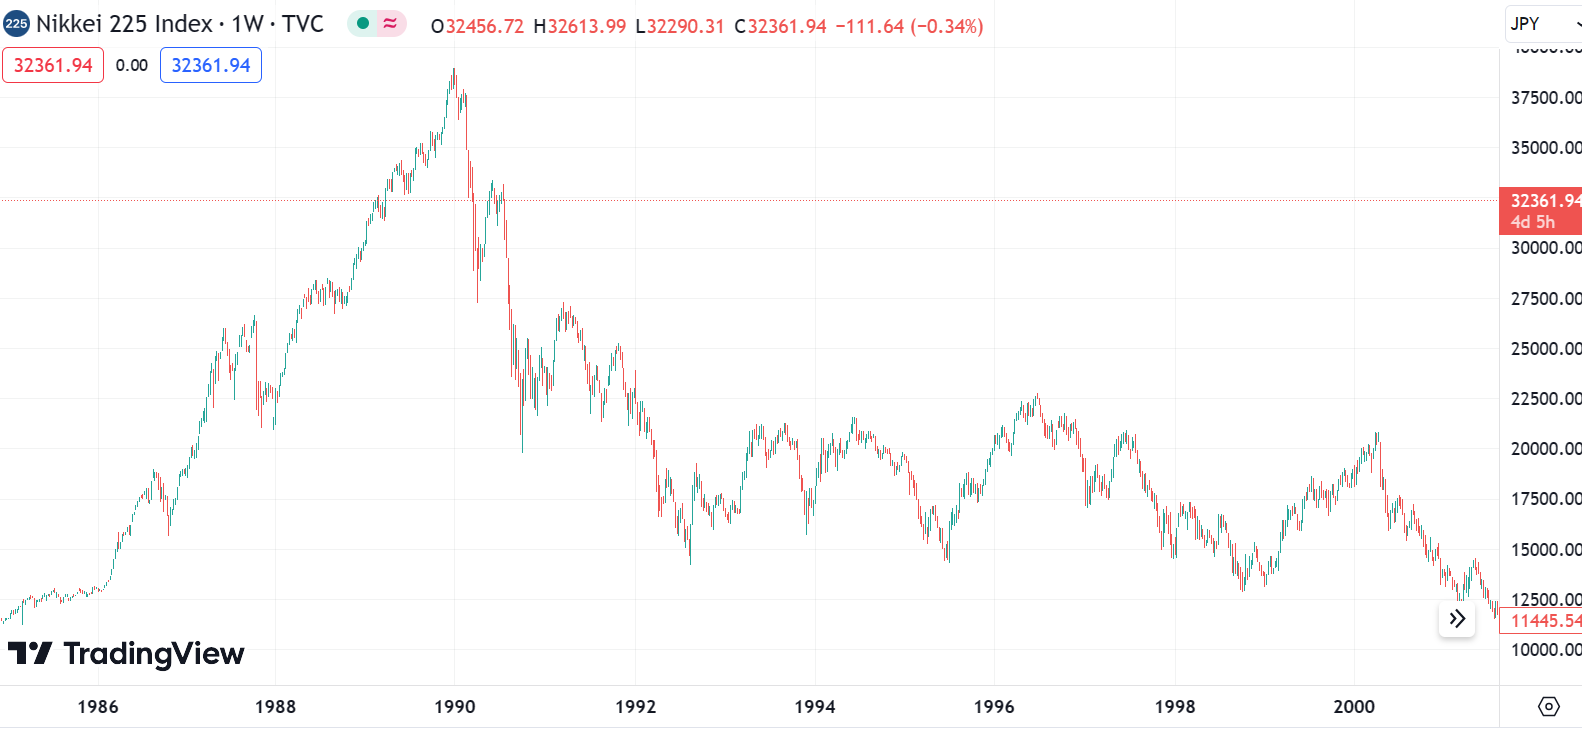
Here are these zones in SPX. You’ll see how our bear plans, bull pivot and recent deliberation around if a top is being made or we’re due a spike out all fit inside this model of accepting three possible bull trap types and aiming to build trading rules to prevent getting caught on the wrong side of a big move.
In this piece we’re going to look at various different assets and compare them to these general bull trap models. First I’ll show a few big examples of each.
Shallow
The shallow bull trap is tricky. You have to be willing to be an aggressive bear and if you’re wrong about the depth of the trap.
76 Retracement
Shallow bull traps back test really well but if you trade hundreds of reversals you’ll find the 76 retracement is much more practical in real move today.
Nominal Spike
The nominal spike out is typically the worse outcome for most speculators. Bears don’t like it and bulls don’t like it.
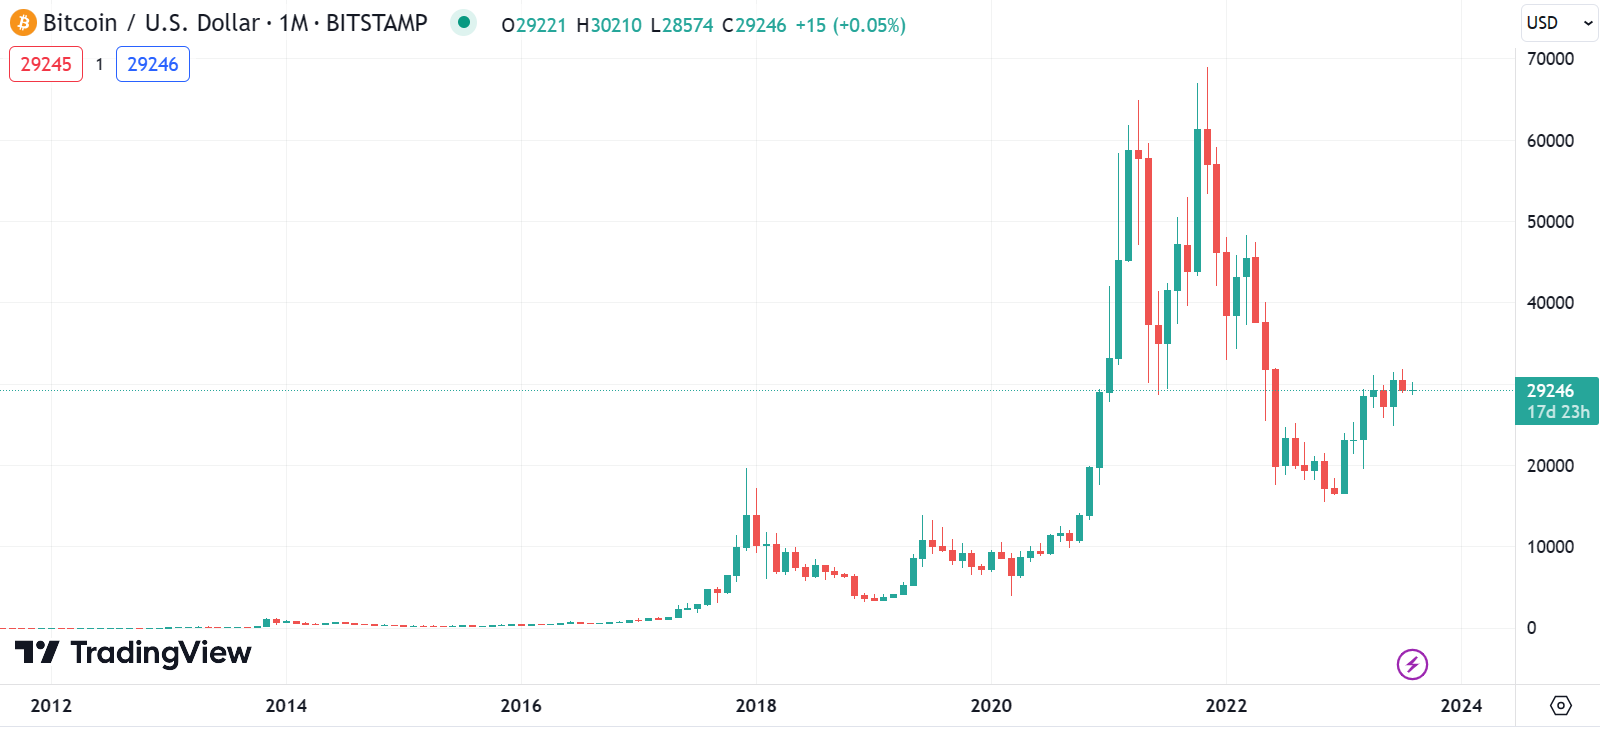
This nominal spike out pattern really should be cause for concern for bulls. Clearly nothing went well for BTC after this had happened and we see this formation setting up many of the worst reversal and persistent declines. This can be the start of a really painful downtrend.
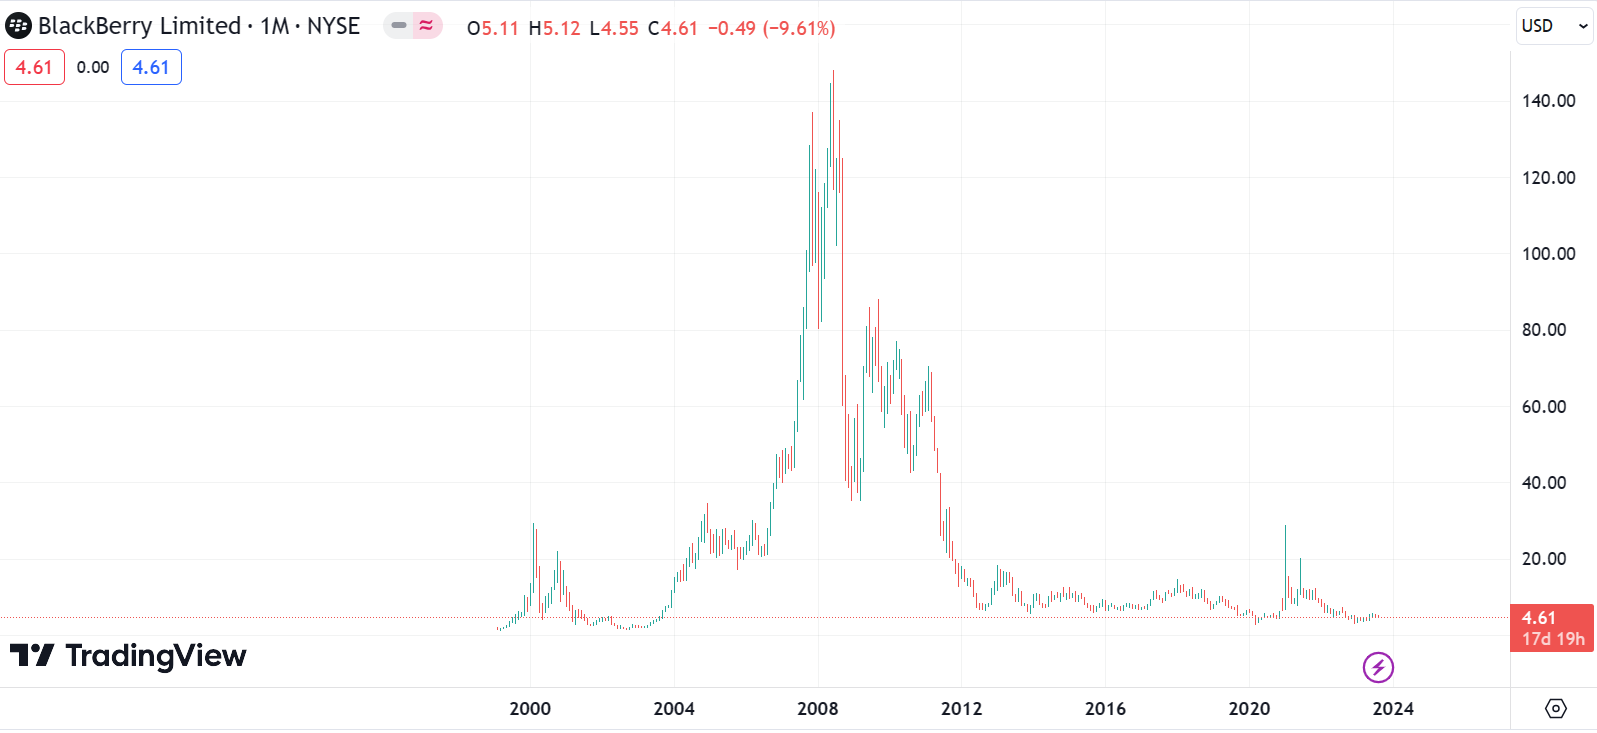
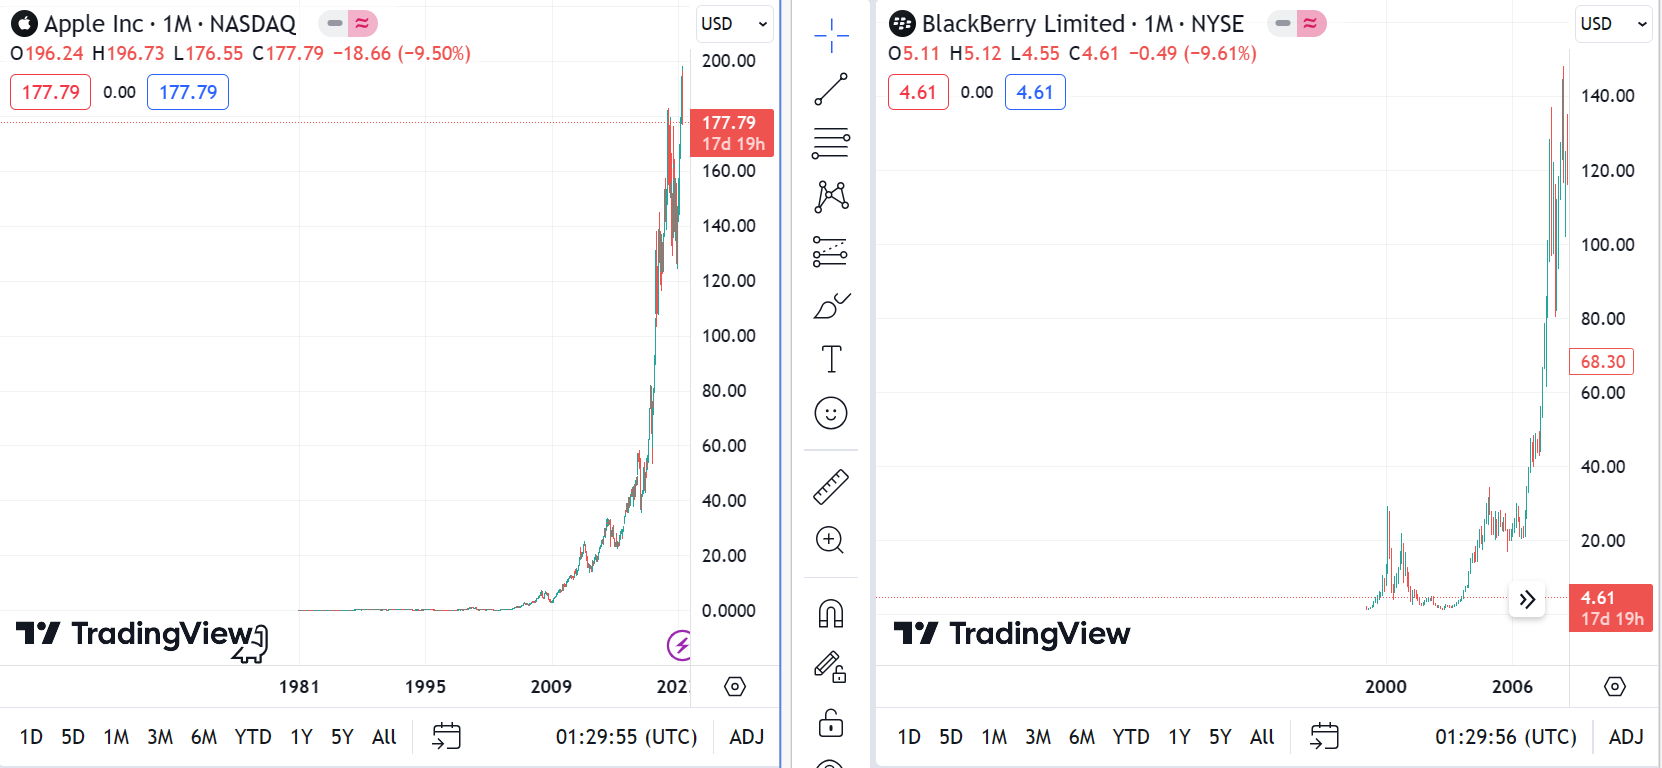
Here’s a cropped version of what BB looked like just before the high was made. With the power of hindsight it’s easy to see the false breakout.
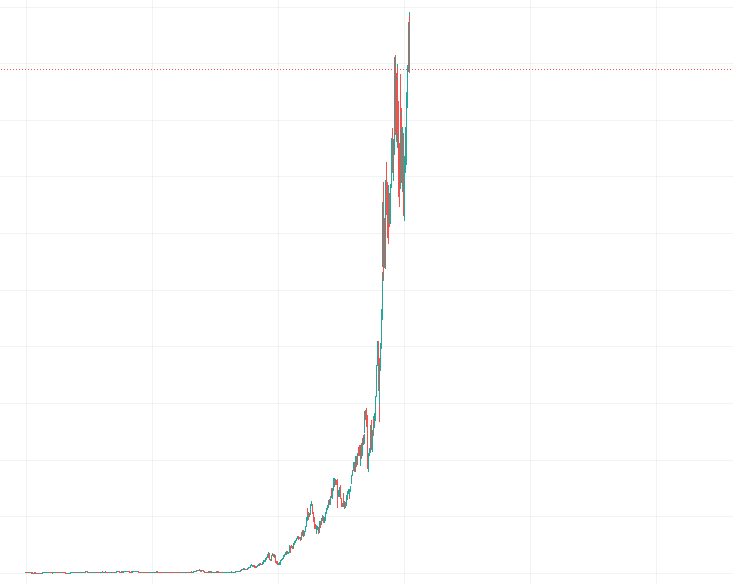

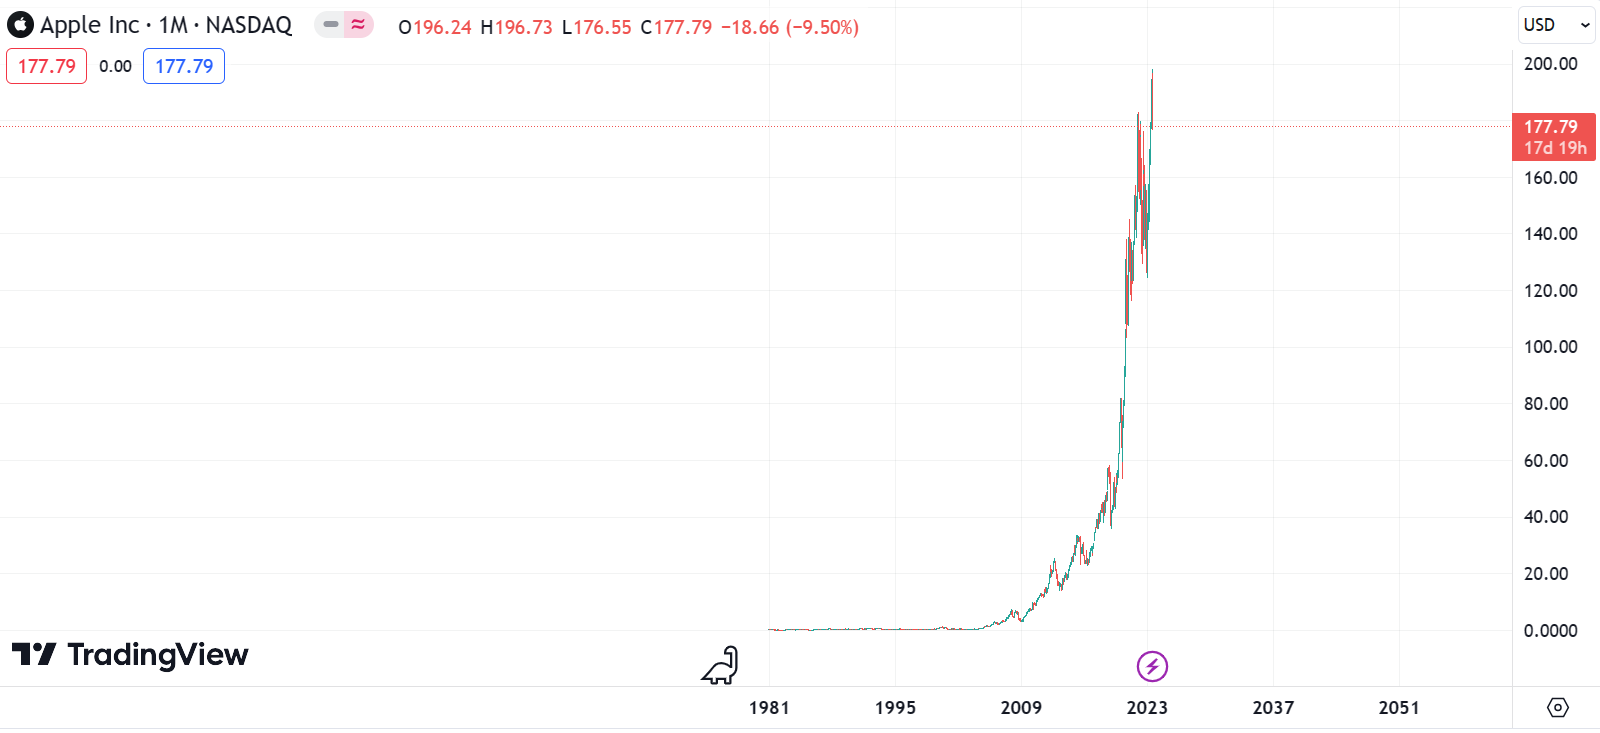
But this is actually AAPL.
Here is BB cropped. With AAPL next to it.
And here’s the implied forecast:
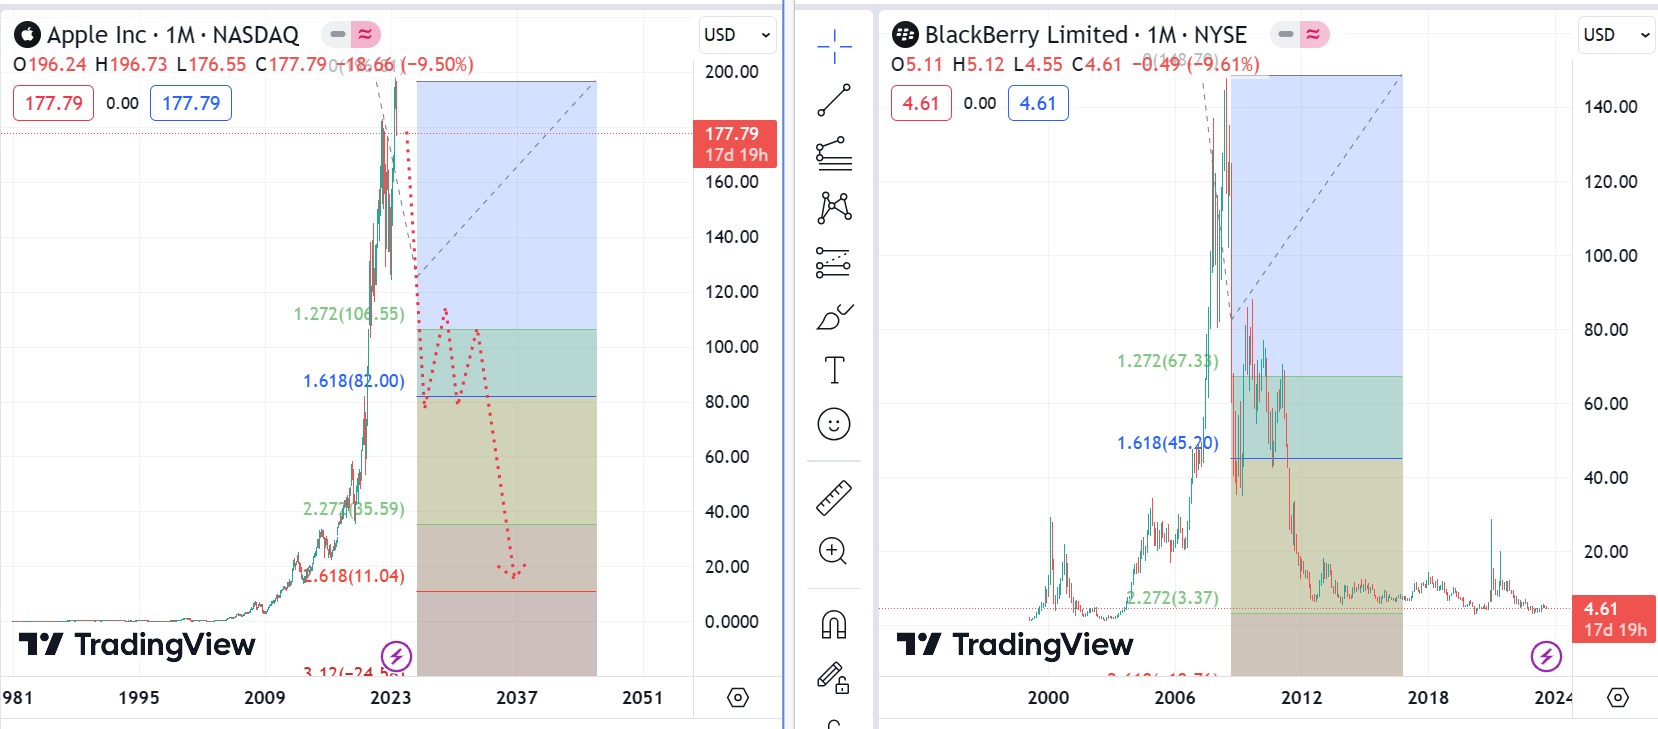
BB was a very classic break. This is what AAPL would look like if it did one also. The back up “Classic break” review the interactions with the 1.27/1.61 and 2.20 levels against the norms of a break covered in this post.
Now that we’ve set the tone for the post - let’s look at lots and lots of charts, categorise them into the three types of bull traps and do the projected trade paths of crashes off those types of bull traps. All of the rules we’ll be using can be tested and seen to have been optimal in previous crashes if you’d applied them in real time.
We’re planning ahead of time, so if it happens to do that again - we’ll be ready.
Keep reading with a 7-day free trial
Subscribe to Market Forecasts and Trade Plans to keep reading this post and get 7 days of free access to the full post archives.