
The sky might be falling.
The sky might be falling.

Follow up post to: Is the sky falling?
Recent moves have really confused me with failure of multiple norms on 1-4 hour timeframes. When things are confusing I find the best thing to do is follow a three step process:
Check if the analysis was good or if you made mistakes.
If it was good, check higher timeframes for better context.
Review the move inside the context of alternative plans.
The original analysis was fine. It was based on butterflies, 1.61s and price structure. All of these swings were drawn correctly and the PA was obviously structured. Which means higher timeframe analysis review and a review of the move inside the context of alt plans.
In this case, we need to be looking at weekly/monthly charts and we need to look at alternative plans for bear moves (Since the primary plan at this point is a bull move spike out of the last high).
When the 4500 level failed to hold a high on the way up we reverted to the bat spike out plan.

Which makes a lot of sense to me. This plan picked out the low of the retracement and was a decent forecast of the rally. There’s reasonable odds the next swings will hit and while this is well supported with near term price action it’s the more obvious move to position for.
This move can still come. There’s not been any big failure of this move, yet. It just increasingly does not feel like I’d expect it to at this stage. Which means it’s prudent to start to make preparations for a bigger bear break. If we were in a big bear top we’d have just had a false breakout of the big resistance.
Here’s a post done while we were around 4500 covering norms of a top/false breakout. The small chart setup shown here did not produce a top (Which is good because it shows you what happens if this fails) but on a larger basis we’ve now filled multiple criteria given here for a spike out.
Explained in the post above is the false head and shoulders reversal, the harmonic spike out and then the real head and shoulders. When we look at the trading above 4500 in SPX, we can see it fits inside of this model of an expected false breakout pattern. False H&S on the left, a 2.61 extension for the head.
So the completion of that type of pattern would look something like this:

We can see similar action in the Nasdaq with the trading above the 76 being brief and inside of possible spike out rules.

The Problem With Probability
The recent move in indices over the last month would strongly imply a new high. The odds of this I’d put at a minimum of 75% and given that we’re talking about fading a super trend another 10% could be added on. The statistical odds I’d put at very low, but even if we put the odds at 99% that means 1/100 is 100% sure to fail (Statistically).
One has to say it’s fair to assume that if we’re heading into extreme market conditions these are the times we’d be most likely to get anomies. If you subscribe to this theory then the 15 - 25% of times we’d expect to be wrong would be most likely now, dramatically changing the implied odds.
The problem with the above is if you give indefinite tolerance because you’re betting on an outlier move - then you just have a reason to be short every tick. Which might not be good. If we’d not used the statistical norms of bear trend failure back in March by this point I’d have considered the whole bear analysis a failure.
While it would have been correct for the move down, it does little good if we round-trip the trade and give all the profits right back to the market.
So herein lies the paradox. I “Know” the odds are likely to protect me overall. I’ll get some stuff wrong and some stuff right. Over enough “Stuff” the win rate and RR numbers usually add up to be profitable. Also, I know when looking for outlier trades you may face the outlier odds.
I do maintain here that what we’ve seen especially in Nasdaq and DJI would tend to strongly imply a new high. These make me very nervous as a bear.
However, multiple things we’re seeing in the market make me nervous as a bull. Let’s look at some.
Not a Good Look for a Bull Market
Honestly, I find it hard to be super bearish on the indices with the 76-86 thing. It’s been so reliable in previous moves. It is also true to say though that as time has passed the spike outs have gotten a little bigger and it’s absolutely not impossible we just spiked out my observed norms - it can happen on any timeframe.
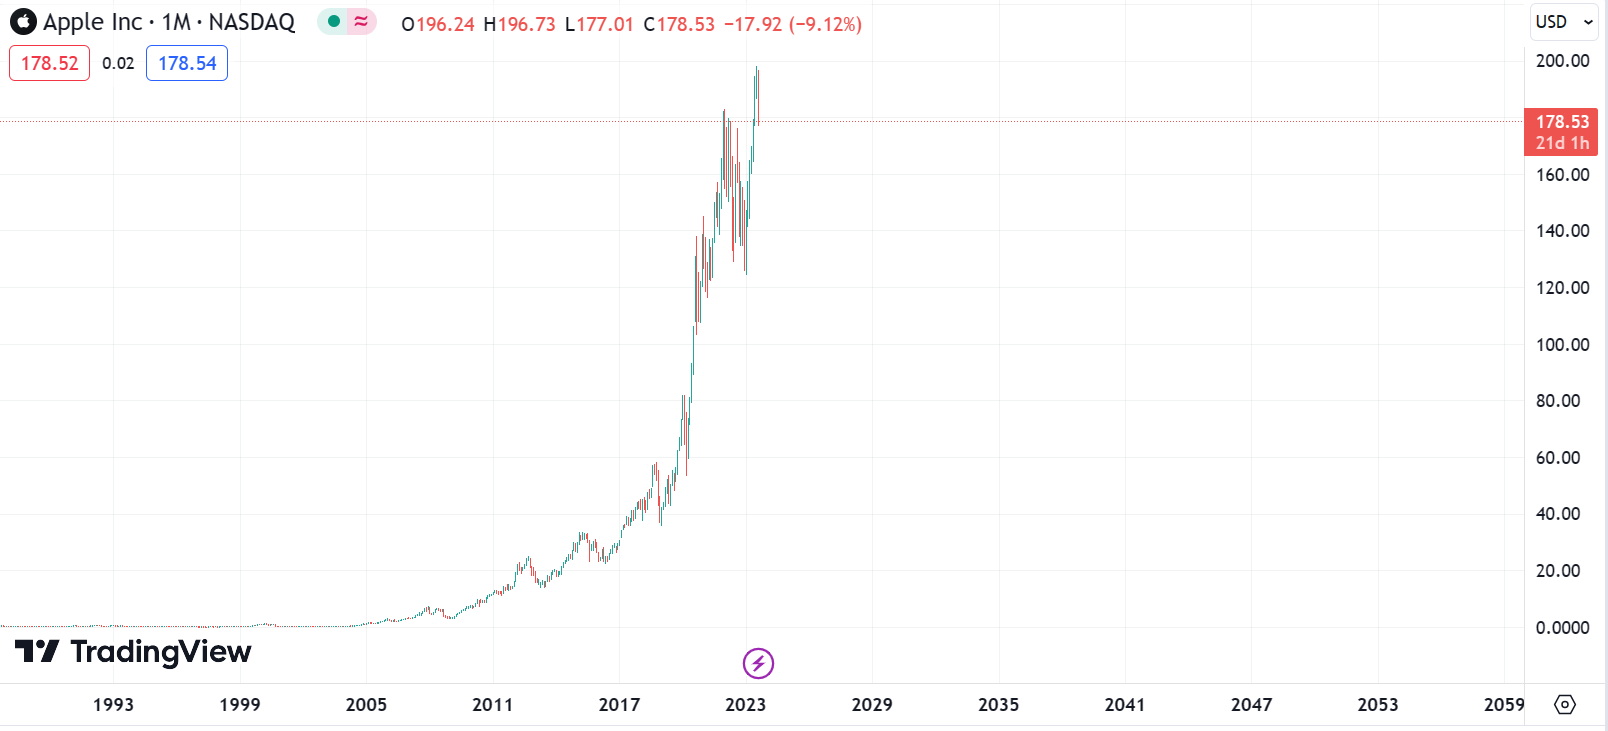
Looking at other charts it’s easy to be a bear. The most scary thing for me from a bull perspective at this point is that AAPL has now made the full move I considered as the risk for bears. AAPL looks the very picture of what I’d expect a final nominal spike out to look like.

This is exactly the move I was looking for in SPX.

I worry a lot about being early in SPX because being short and not being long during this type of move has massive opportunity costs.

Keep this in mind any time you think fading a high is easy. Wrong usually looks like this but gets worse. Mostly right, usually looks like this. Neither are a good time short.
The TSLA chart - It’s not a great look for the bulls.

The head and shoulders fails more often than it works. If you read my stuff you’ll know I say this all the time but it’s really important. The H&S is by far the most common pattern used to mis forecast a high. Usually catches the real high, but by that time no one is interested in H&S patterns.
With that said, if we look at the left here we can see TSLA has already made a series of the false head and shoulders. If this was a true one, that would imply dramatic crash in TSLA coming soon.
Look how much the MSFT move looks like the SPX forecast.

Look at the top of the move. It’s exactly like what I’d expect in a typical top of this style.
I really do feel like I am pivoting back to a swing bear bias now. What I’ll say alongside that is if I am wrong I’d expect we’re either at a low right now or within 100 points of it. And after that low, I’d expect us to go parabolic. To be a bear around these levels without a stop would be very foolish.
In a correction to a bull move I’d expect to see the market really easy for shorts. The idea is to make it look simple and people jump on. On the other side, make it look scary and people jump out. What we have recently is more stuff encouraging bulls and making it tough to be a bear.
What this looks like now is very similar to the action before the 2008 break.

While we’d not be necessarily looking for a move on this scale, a 1.61 break in a downtrend here could take us to 4.23 before a big bounce.
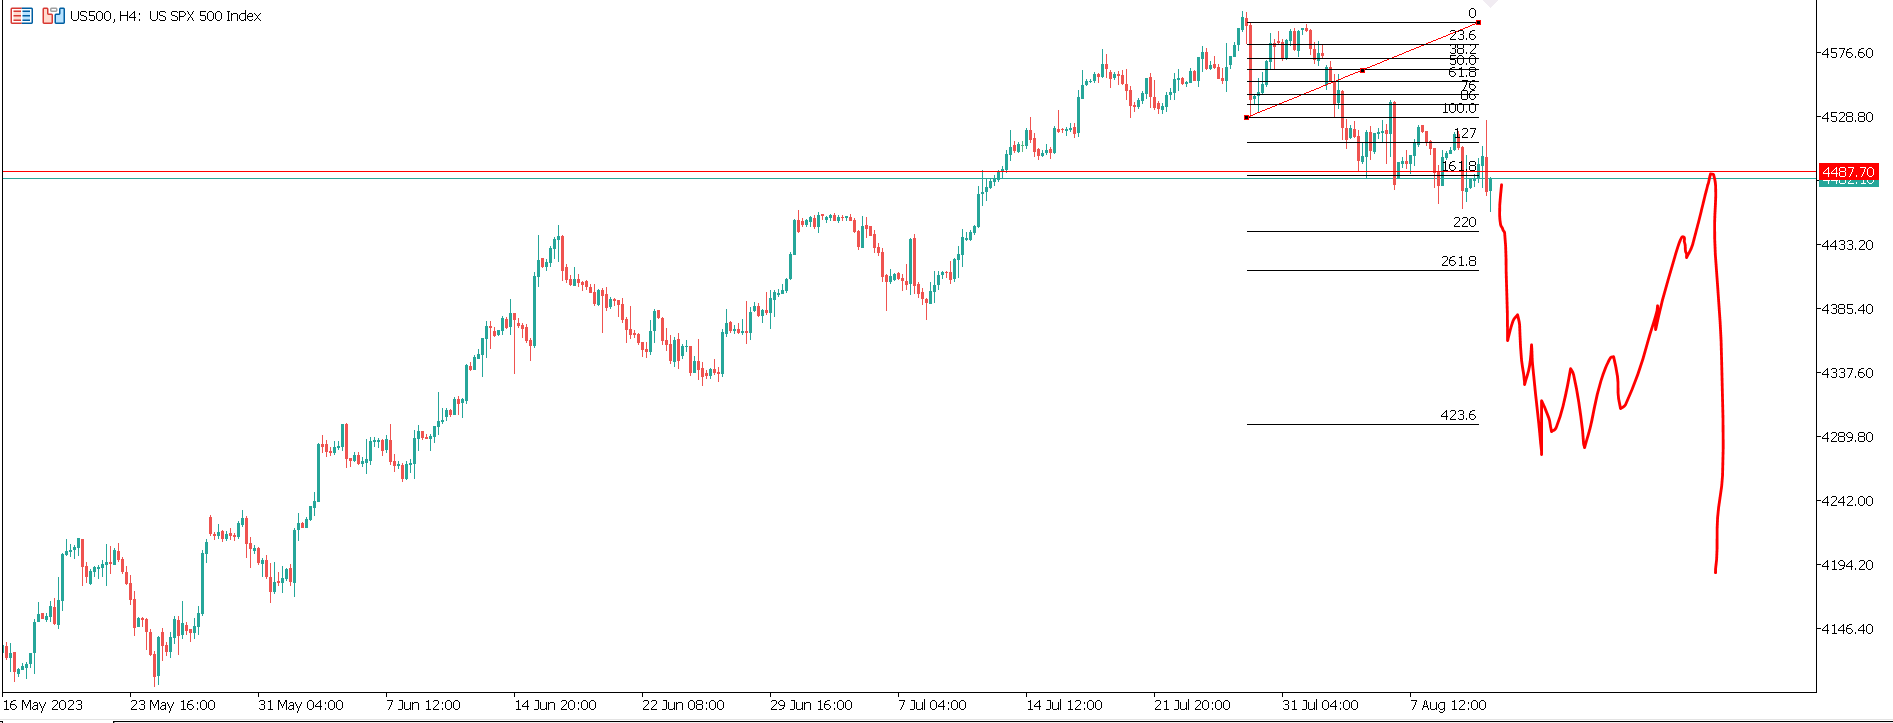
This would agree with the head and shoulders setup.
Spike Out Highs
It seems a lot like many people are in camp “High’s in”, camp “New bull market” or camp “6,000 ultimate squeeze”. Personally, I am fine with any of these and none of them. A nominal spike out is something I have seen a lot at market tops.
This is covered in depth here.
I really would feel more comfortable as a short after a move like this in SPX but it really does seem like it may be important that big stocks have already made this move.

What if the above example post turns into a real reflection of AAPL.
It feels impossible for that to happen to AAPL, but I am sure it was impossible for it to happen to BB. Until it happened. Then it was obvious.
Here’s a zoomed in look at the BB top.

Now where else can we see this (Hint, different variants of this in every chart posted, either formed or possibly forming).
