
Is the Sky Falling?
Is the Sky Falling?
Abysmal news and dramatic drops, does it all spell impending disaster?

Prices have been falling recently upon the news of Finch downgrading the US’s credit rating. Declines have been sharp and well justified - but is “This it”?
I’d propose it is probably not. We’ll probably head a bit lower to 4300 and then rally again. With that said, 4300 is 200 points lower than we are today and we’d do well to have bear plans to deal with that drop and also give due consideration to the possibility the market does make a true break.
If all of 2023 was just a big bull trap in indices, a very sharp break would come now, but the case for a new high is quite good now. In this post we’ll review previous bear forecasts from 2021 to the current time and using these previous roadmaps make plans for different moves we may see now.
The Macro Bear Forecast
My forecasts are made from first analysing the swings in previous big market crashes/recoveries. Looking for norms in them. Finding ways to develop trading rules around these norms and then running tests of them in the real market. From 2021 to now, these have proven to be very useful.
Let’s look through the previous forecasts, amendments along the way and I’ll also link in the long-form analysis posted through various parts of the move.
December 2021
In December of 2021 we set up our “Beat the Bear” newsletter and posted initial analysis of a DJI comparison of currents to the 1920s - 1930s. You can read the full post here. From this, the below macro charting forecast was made.
January 2022:
Posted A historical case for the DJI topping now, and what to do if it is.
This post was accurate in the forecast of the high but inaccurate in the forecast that the drop would continue until under the low of 2020.
June 2022:
Posted Understanding the Bear Market Rally
This post taught the norms of bear market rallies and how to trade them. We used the rules covered in this post to be very successful catching the big trades down in 2022. In this post we also covered the failure signals of a bear market. We’d be bearish most of 2022 but by late 2022/early 2023 we were getting bear failure signals.
June 2022:
Posted A Big Waterfall Event May Come.
While we’ve got most things right on a broad swings basis, around this time was when we were significantly wrong about markets. We posted various analysis looking for a break. We did also frequently warn that failure of these trade plans would produce a strong bull move.
June 2022:
Posted I Think Now’s the Critical Time
This was the last of the big incorrect bear forecasts. It gave a stop of 3915. After this we’d still maintain plans for the big bear break but also started to post a lot more bullish analysis to be ready if the market reversed.
November 2022:
Posted This Could be a Critical Week for the Bear Case
In November, bear mania was in the air. It was very hard to make any sort of bull forecast without people calling you names. Along with some TA hints, this made me very nervous of the bear move. In the above post is a detailed analysis of the risk for bears and the massive potential opportunity for bulls.
Feb 2023:
Posted “Fight the Fed?"
By this time I was finding myself very much in the bull camp. Push-back against this was very strong. We made various posts around this time debunking points of analysis people were putting forward for why the bear was a slam dunk. This post explained how raising interest rates had actually historically led to market rallies.
Feb 2023:
Posted Supportive Work and Trade Plans for a 2007 Style Market
Early 2023 was a tough time because by then we’d built up a mostly bearish audience and were more and more pivoting to bull. And we were not saying, “It will bounce a little”, we were talking about retests of the highs and possible new highs. At this time I knew being caught out would be terrible we did a lot of work on bull plans.
Feb 2023:
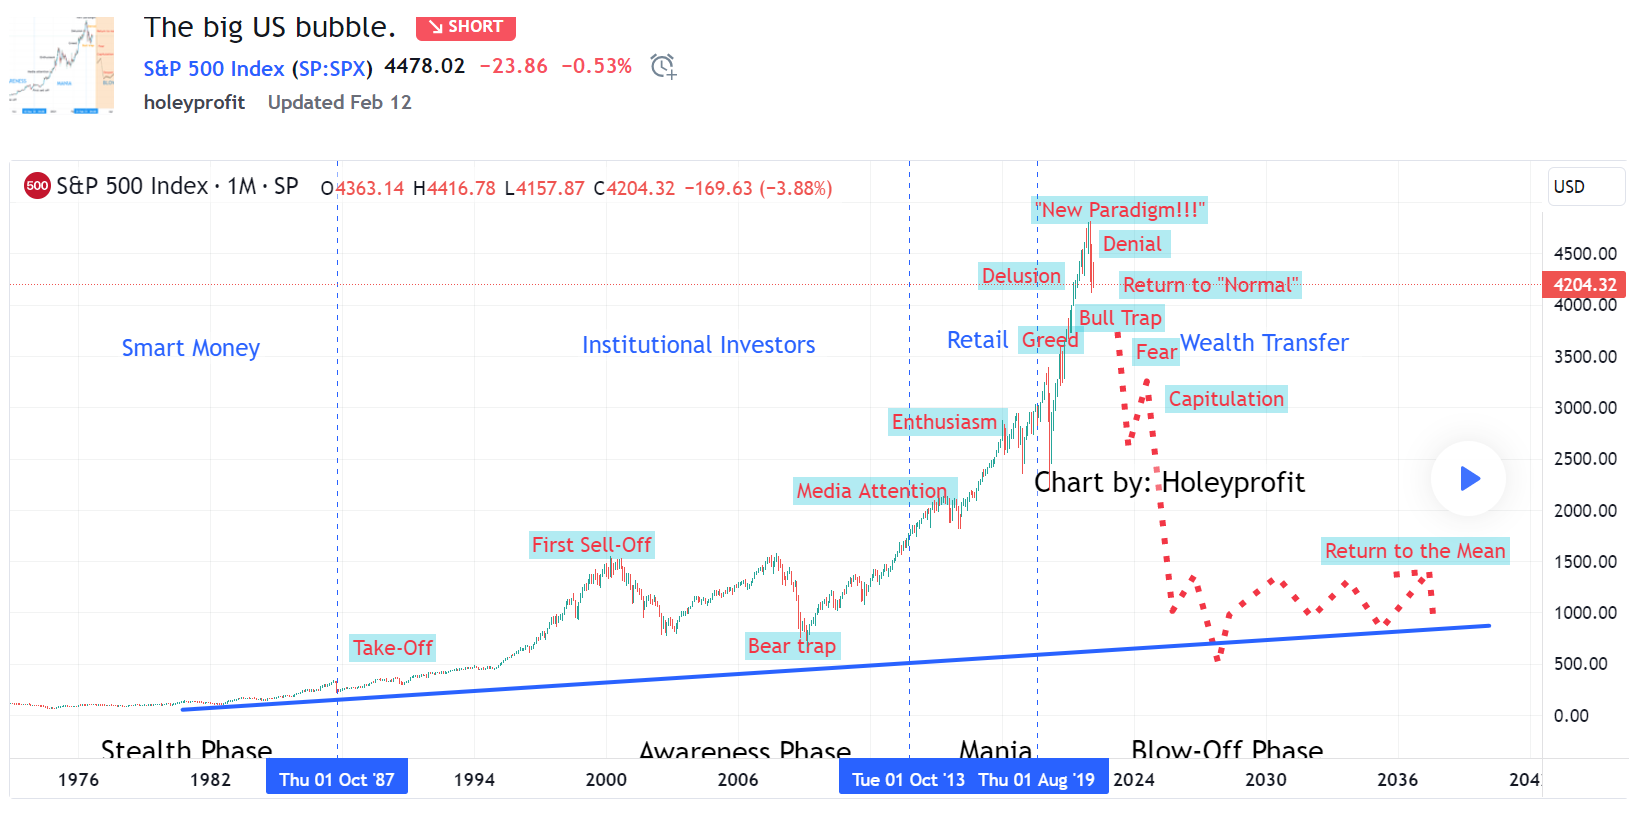
Posted Let’s Talk About the Classic Bubble Model
Another debunk post. By this time it had become incredibly popular to post the classic bubble template with a big arrow pointing to the “Return to Normal” saying “We are here!”. It did all look textbook, but it’s not always that simple. This post explained the risk of a new high in indices.
At this time we also revised our own big bubble forecast:

March 2023:
Posted A 2007 Like Move Would Dictate a Low has Been Made
This was a follow up to the Feb post about a 2007 style market (A false drop, new high and then the real crash). It called for a long at 3900. By this time we’d pivoted to mainly talking about bullish moves - which was not popular at the time. We lost a lot of subs/followers around March calling for a minimum move to 4500 in SPX.
March 2023:
Posted Let’s look at how markets historically recover
A post showing the warning signs of a low being made and also a forecast of what we would expect to see in a bull move. In this post a rally up to 4500 - 4600 and correction is forecast.
July 2023:
Posted The Case for the Macro Bear has Fully Developed
This post took a top down analysis on SPX and looked at what it would be like if we were in the traditional “Return to Normal”. This piece covers how we have all the textbook setups of a bear market (But also warned of the potential for final spike outs - markets are not traded on textbooks).
July 2023:
Posted Bears didn’t do it. I think 5300 is next target.
This post discusses the failure of the common reversal we’d see in a “Return to Normal” and looks at some of the supporting evidence for a new high to be made (Even if we’re overall heading into a bear market).
July 2023:
Posted We’re net bullish but a sell is probably coming
A post saying we now had a net bullish bias but we’d probably see a drop from 4630 sort of area. We started to post more short term bearish analysis here with a short bias around 4600.
July 2023:
Posted Using 76 retracements for trend decisions
This post explained why we were willing to be net bearish at 4500 but not at 4600 (Even though we thought a drop would come off 4600). It talks about the strategy and also shows the results of it during the 2022 bear / 2023 rally.
August 2023:
Posted Timely news brings the TA break
A post to discuss our short targets and also to explain how the big news of the day did not change our overall bias. It shows previous examples of the same thing happening in the market previously on such news.
So Where Does That Leave us Now?
On the balance of things, all the analysis norms strongly point towards a new high. Last week we did break important levels on local timeframes and the bias is lower for now, but we’d be looking for another big possible buy level at 4300. Upside targets here are just before 5300.

For downside risks we have two things to consider. One, the 76/86 theory may have failed. While it is a very good norm for a reversal, it’s possible it can overshoot it. This has not happened without making a new high in previous bear markets but it’s possible spike out moves get bigger as time passes (Historic moves suggest this).
In this scenario the plan for the “Macro bear case has developed” is most likely. I’d put the odds of this at about 1/5 currently. A new high seems overwhelmingly more likely. With that being said, I have enough self-awareness to know the market can easily trick me into being bullish right before it reverses. Markets are good at trickery.
Another thing we have to worry about on the bull side is in a full blown market recovery it’s common for us to see price bouncing from around the current top level to lower than our expected low. The norms for this are covered in “How Markets Recover”.
So, is the sky falling? I honestly think not. I think everything we have seen in the recent drop fits exactly into the template of what we’d be expecting to see if the market was going to make a new high. From as far back as Feb/March of 2023 we put out analysis showing the market could dip here on a rally to a new high.
But we mustn’t be complacent. The near term bias is short for 200 points. If that breaks it can be down another few 100 even in a net bull. Obviously a bearish reversal can take us under 2022 lows and beyond. Given all this risk and the probability the market is lower near term, it makes sense to have shorts from 4500 to 4300.
From here we can define 50 - 100 points zones in which we’re willing to be a bull on pre-defined support levels and if these levels fail we can make plans to short retest.
I maintain my stance there’s more to be lost than gained for investors and I do no think the market is suitable for long term investors now, even if its heading higher, but a practical standpoint of a speculator, I think it’s too early to be over-committing to a big short thesis.
The market looks weak now, but BTC looked horrifically weak here.

The sequence of moves BTC made here got it max liquidity. Shorts were nailed, most stopped out around 65K at the high and retail buyers were in a frenzy getting in long for the “Inevitable 100K”. BTC bears at the time were essentially right - but your broker does not care about “Essentially”. You need the right orders placed.
If a similar move in SPX was forming now, we’d at least as fast as we have fallen in the next leg.

This kind of move would scare the bear out of a lot of people, I am sure - but this is what I’d consider absolutely ideal for the short. If and when we see a parabolic burst into the high - this is when it’s likely to become much easier to pick out high probability big short trades.
===
As I said back in early 2023, the one thing I feel I can be sure of is whoever gets caught on the wrong side of these swings is going to suffer. It might be the bulls, it might be the bears and I’d propose what is most likely is it somehow being both of them.
I’m happy to trade the market whatever way it goes. My priority is making sure myself and any of those following our posts and strategies are not one of causalities. To that end, I remain as objective as possible and have trade plans to deal with all outcomes. I do think some sort of fat tail event is coming - but those can go either way (And both).