
This Seems Like a Make or Break Spot for Bear Case
This Seems Like a Make or Break Spot for Bear Case

Market moves have been interesting!
In a previously analysis we pointed out a similar break pattern in the 2008 crash.
Pre-Capitulation Conditions are in Place - by HoleyProfit (substack.com)

And said the like for like forecast on SPX would be this.
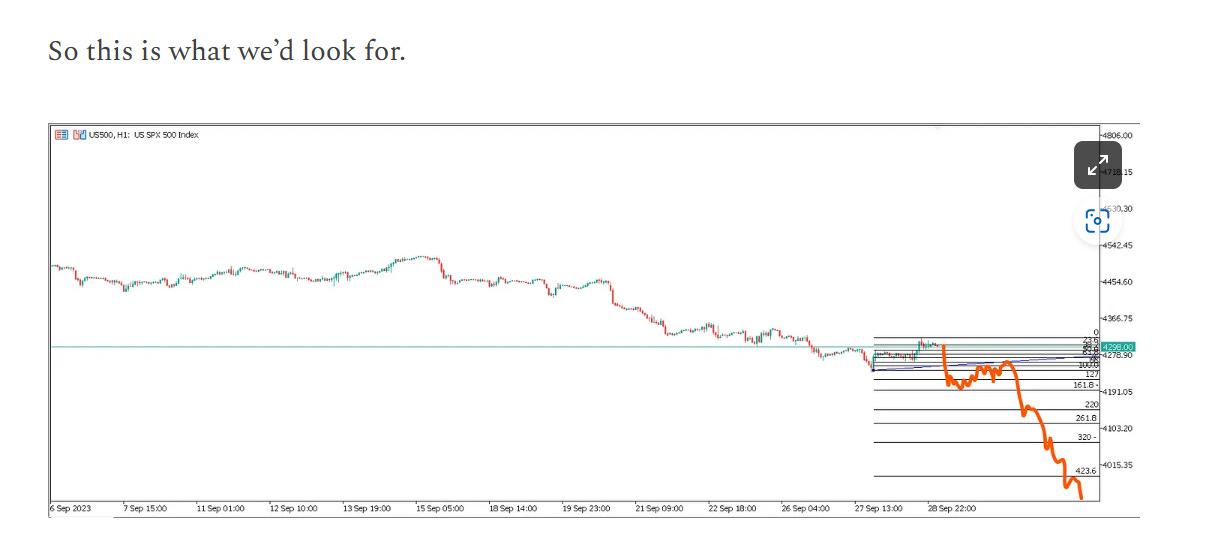
And right now the weekly chart looks like this!
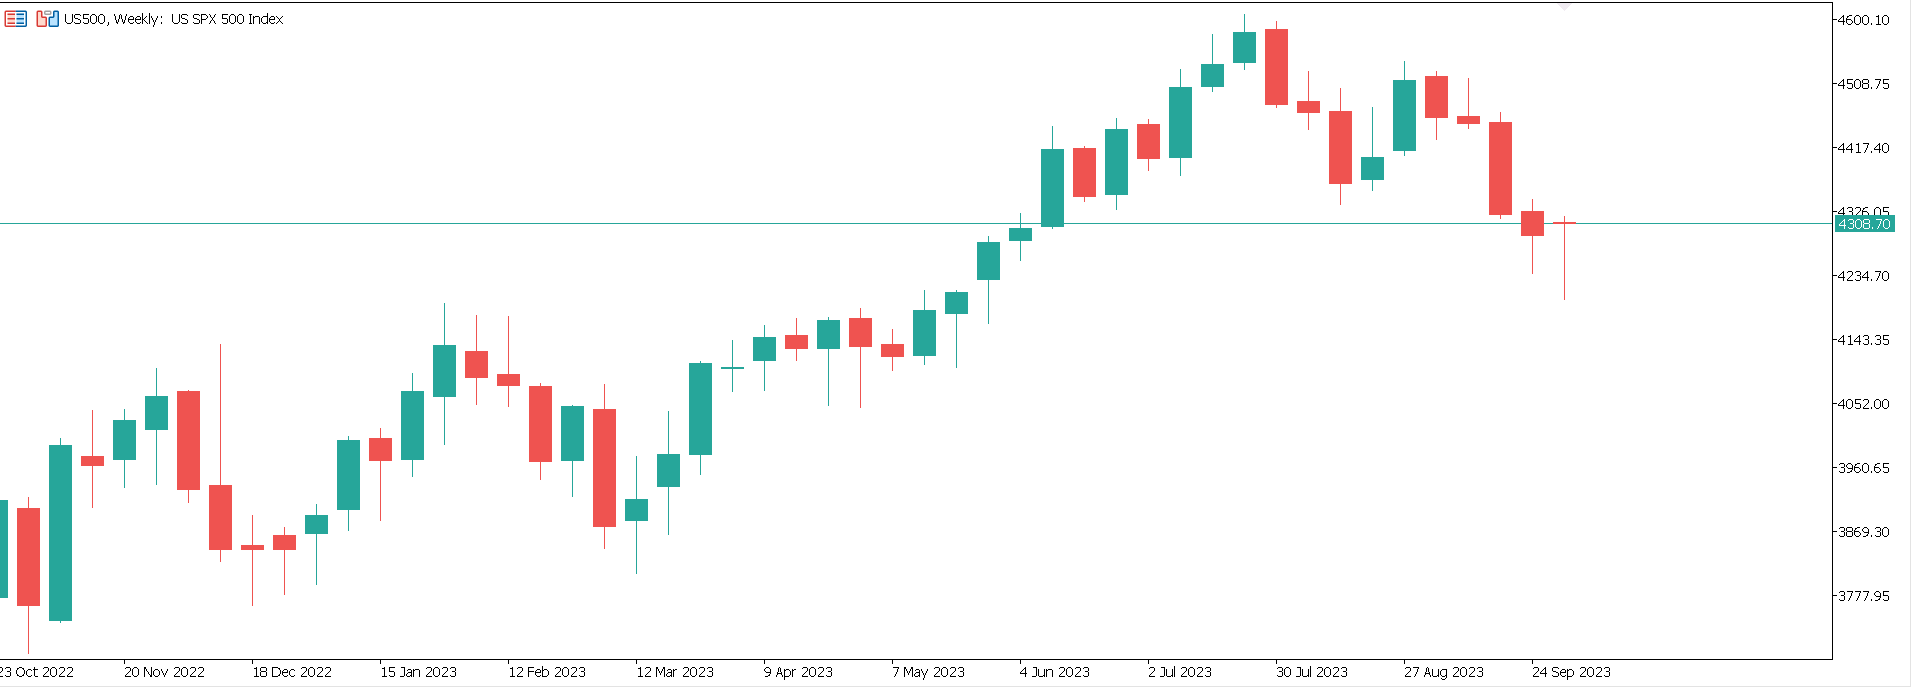
That’s exactly the 2008 candle out of the expected area. What are the odds of that?
Now, it should be remembered we have previously determined if there’s to be a bull move around 4200 area is one of our key levels. SPX makes pullbacks this deep in uptrends. Many times in history SPX has pulled back around this amount and went higher. Every possible bull trap since 1929. - by HoleyProfit (substack.com).
So bear mustn’t be complacent. The implied velocity of such a move is one worth being afraid of as a short. However, we do have down trending action and while we have that we can make low risk strategic bear bets easily.
And after that candle in 2008 came this …
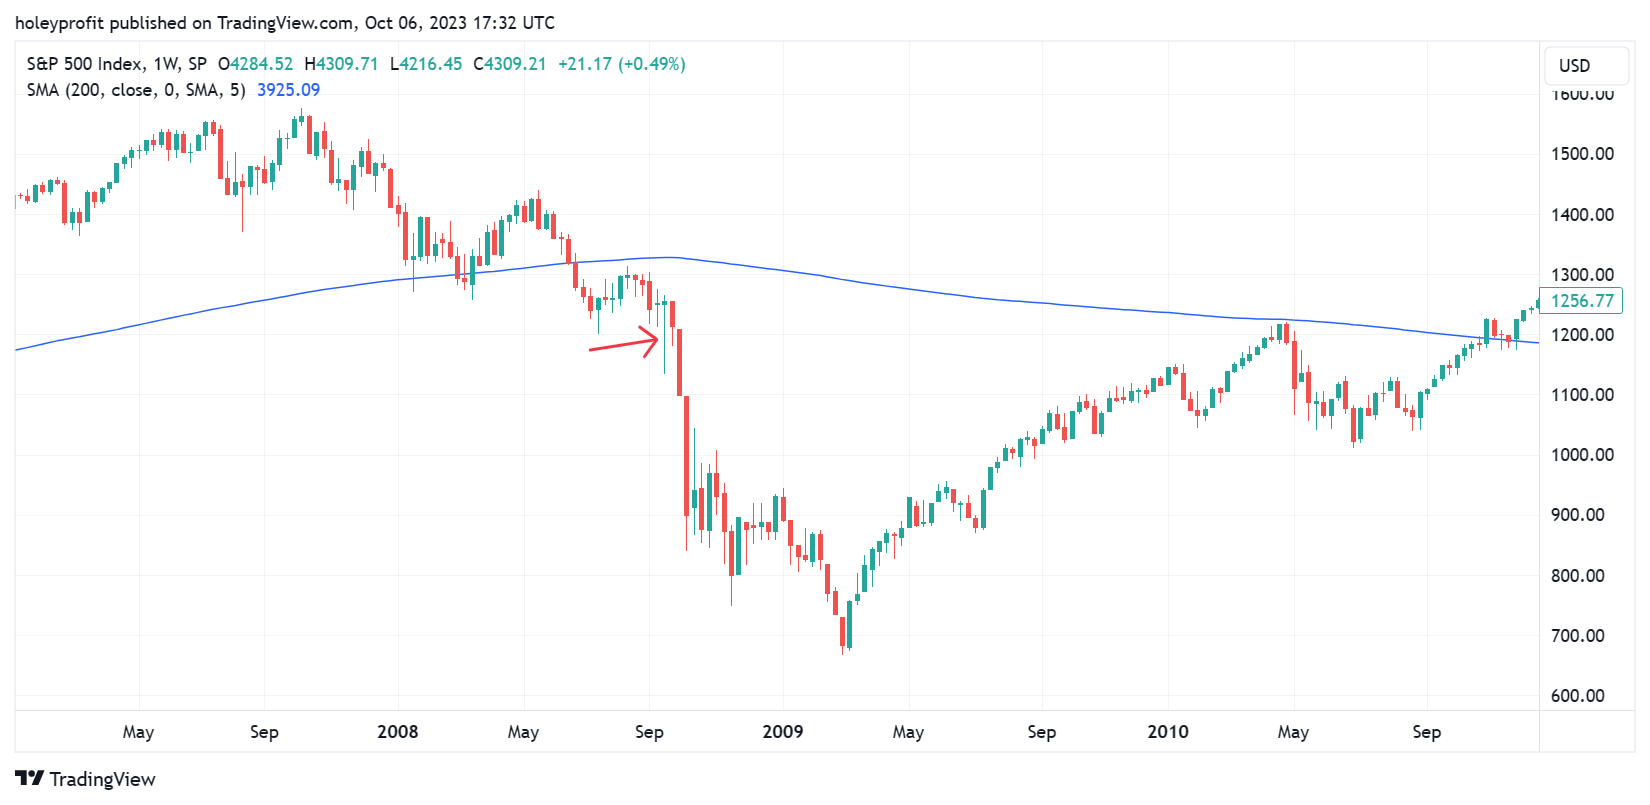
So now we’re going to talk about that. We’re not looking at something on the same scale since our pattern is on a smaller timeframe - but recent action takes us one step closer to capitulation conditions as outlined previously.
Pre-Capitulation Conditions are in Place - by HoleyProfit (substack.com)
We’ll look at our implied swings and ways to trade them.
Keep reading with a 7-day free trial
Subscribe to Market Forecasts and Trade Plans to keep reading this post and get 7 days of free access to the full post archives.