

Why Bad Markets in Coming Decade Are Probable.

In a recent free post I made the TA case for a major bear market showing how we have a signal we’ve never seen before.
Read that here:
The Macro Case for Indices Having Reversed.
In this post I want to deviate from our usual style of analysis based content and go over some theory stuff to explain why a major shift in markets is not as impossible as many seem to believe, and it’s reasonable to say it’s even all that improbable. Based on everything we know from the past, it’s probable.
Recent Decades Bias Fallacy
Recency bias is when you expect thing you’ve seen recently to continue to happen. It’s why we’re all so shock SPX has downtrended 10%. Even as someone who thinks we can go down more and explained why this drop could happen at the high, I’ve been surprised to see no big rallies, it’s just not what we’re used to.
It’s something that is natural we all pick up. Even those of us who are generally sceptical. I’m a reversal trader and when fading a trend by the time it turns I usually have recency bias. It’s hard to expect something different to happen when the same set of events lead to the same outcome over and over.
Of course, we all know and see this bias builds up and fails all the time on smaller timeframes. In the day to day swings we see minds shifting (generally at the worst points) from one bias to the other as we make the rips and slams. Recency bias is strong while persistent but very fickle and fragile.
But what if we extended this same idea to decades? Do you think it’d be fair to say that most of the expectations and reference points used by investors these days come from the last couple of decades? I think it would. No one ever talks about the 70s, and certainly not the times before that. It’s basically 2000 onwards, right?
And it makes sense people think of these, but does it make sense? If we look through patterns of history is it true to say that the conditions you have observed over the last decades have been good foretellers of what would happen in the following decades?
Yes and no. Yes. They did often hint at what was to come. No, it was not wise to think you could bet on a continuation of that and be successful.
It’s been a common rule of thumb in markets that you end up getting the opposite of what the generation before got. Let me run through an abbreviated timeline of market booms and busts to show you what I mean;
Up to 1920
Tough times.
There were raging bull markets and big crashes. During this time there were two main bubbles and pops. One in 1915 and the other in 1920. These would both crash about 50% over 9 months or so and then stage recoveries.

1920’s to 1929
Boom times.
What happened in 1920 had been really scary. They’d called this move the “Great Depression” at the time. It’d later be written of as the “Forgotten Depression” and the “Crash that cured itself”. The former due to the spectacular rally that came out of the 1920 crash (The latter we’ll cover next!). After the tough times, came the boom times.

1929 to 1933
Very tough times.
The “Roaring 20s” boom would give way to the Great Depression. Stripping the 1920s crash of its title. The crash itself really only went on for a few years but the market overall would stay down for a long time. It’d take a long time before US stocks had a clear bullish tone to them again.

1950s to 1960s
Boom times.
The crash had bottomed far earlier (Around the outbreak of the World War) but the new up trending properties began in the 50s, heading into the 60s where a new high would be made.

1970s and 80s.
Tough times.
The market would be up and down. Looked like great time to be a reversal trader. Looking at it in smaller swings the market was a series of bubbles and crashes, but this just made a big overall range. During this time inflation surged and even although there were times stocks were higher, they were still at a loss inflation adjusted. You just couldn’t make big money long the stock market passively in this time.

1980 to 1999
Hyper boom times.
This ugly choppy action of the previous couple of decades would give way to the most exceptional of new trends. All of the previous rallies in the last decade has predictably crashed to the lower range and then one just boomed and boomed. Eventually this would become a part of the Dotcom bubble rally.
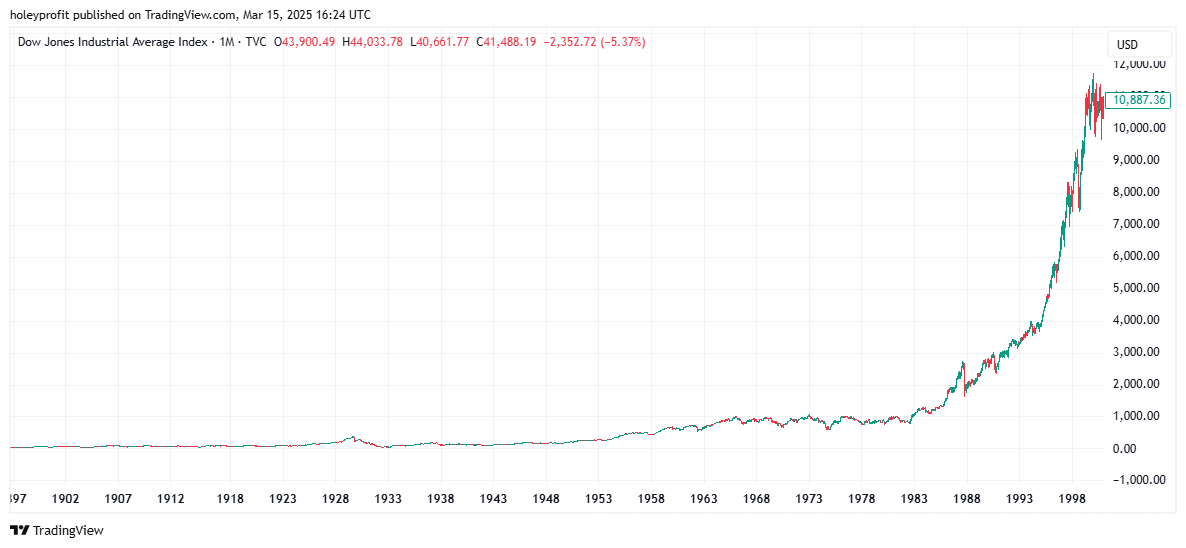
2000 to 2012
Tough times.
During this period there would be a choppy action where there were a couple of big crashes of 50%. The second of them we considered the more series and this was labelled the “Great Financial Crisis”. In so many aspects of the price move during and after, this mirrors the “Forgotten Depression”.

2012 - 2025
Hyper boom times.
Since then, it’s been a consistent boom. There have been times the market was down but never over the span of a decade have we seen tough conditions. Similar pullbacks like this happened in the Roaring 20s rally. Or during the housing and dotcom bubbles. The period since the retaking of the 2007 high has been a big boom.
2025 to 2035 - 2045
The years the pattern of all time breaks?
Or tough times?
Would be entirely consistent with the patterns of history for this exceptional rally to give way to conditions where it is spectacularly harder to make money passive long in the following generations - and some of those have been so bad that they are essentially wipe out events. With a decade or more to get back to the high.
So a recency bias based on recent decades has never been a good thing to use to roadmap the following decades. It’s been more true that it’s wise to expect polarity over generations. Or as I began saying, you get the opposite of what the generation before got. And that was a hyper boom.
In every instance we covered of that, there was a prolonged bear market.
The Interest Rate Signal (And Paradox)
If you understand the TA concepts covered in my macro bear case and take time to really consider the improbability of all those things happening (And I mean things that have already happened) - I think it’s fair to say we have a compelling TA case for us being in the right price zone.
The Macro Case for Indices Having Reversed.
But we also happen to just be right inside the sweet spot for what interest rates do heading into a market reversal.
Anyone who’s been following the proposed links between interest rates and bear markets from 2022 I’d imagine is very much jaded by the idea now, but checking the history of interest rates and bull/bear markets you’ll see it was actually a mistake to believe in 2022 the Fed had to pivot or we’d crash.
As logical as that chain of analysis was, it was entirely at odds with everything we can look at in examples of rising interest rates and markets. At the time I had no thoughts or cares about interest rates. I was using TA and I’ve seen TA both predict changes in the news or forecast the move correctly even if it’s paradoxical to news.
But over the months are people called me a “Pivot bro” (Remember when that was a thing? Seems so long ago) I decided to test the signal, out of interest. You know how many examples I found of markets crashing on rising interest rates … zero! None. There was not even one.
In fact, when I looked closely at the interest rate decisions during the dotcom, housing and Nikkei bubbles I noticed there was a strong anti-correlation. Not only had there never been a crash on rising rates, the parabolic phase had always happened during them and then the market always topped and reversed alongside rates.
I remember joking back in 2023 if one were to do the checking on the signal not knowing what an “Interest rate” was, they’d conclude it told you “How interested” people are in buying stocks, and would be a very good indicator for that. The decline always came after the hikes in the interest rates.
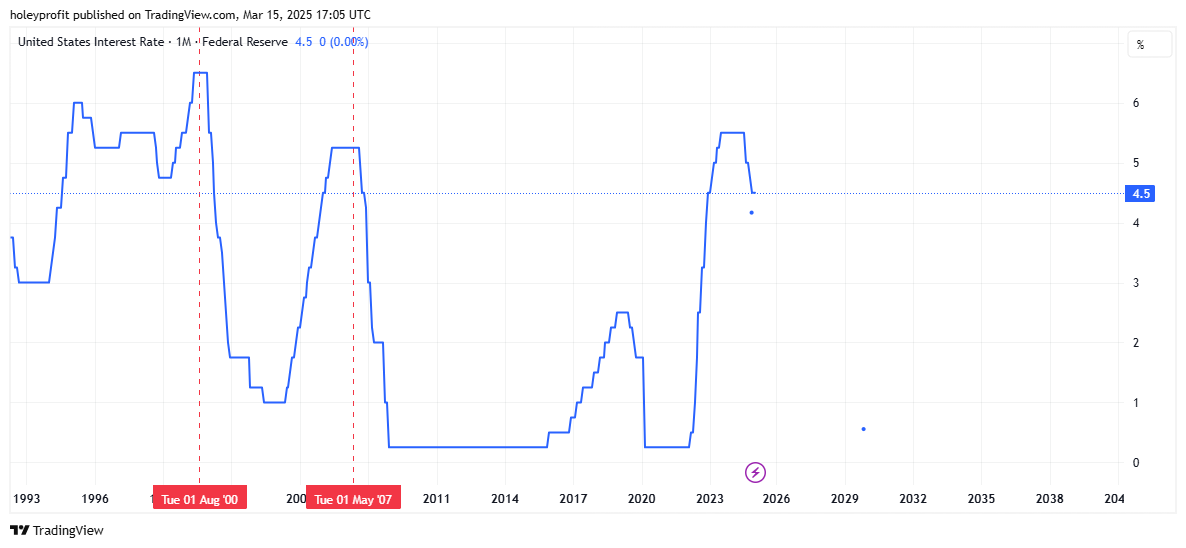
This is something you can get right into plotting the rate decisions on the chart but a simple way to view this is just to look at the chart for the rates.

It’s not hard to isolate the big bear events. Nor is it hard to easily see rates went up during the rally. Peaked around the top. Came down while the market crashed.
In these instances the market topped while rates went flat. We’d be down a bit and then there would be a rapid cycle of rate cuts, during which the market would generally continue to crash (Perhaps rallying on the day of the announcements).
Here’s Japan.

Their crash started in 1990 and the bubble blew up through the 1980s. During this time, the interest rate matched the equities moves.
This puts us into a very different situation than in 2022. Because while it was true that it was impossible to find historic examples to say that when these things happened with interest rates the market would crash, based on the same crashes there’s now no example of this specific set of things happening and there not being a crash.
In 2023 we wrote about this.
Historical Highs on Interest Rate Cuts

A year ago we posted “Fight the FED” in which we highlighted how, contrary to the popular perception at the time, rising interest rates historically produce rallies more often than crashes. Since this time rates have rose and markets have rose also. We’re now at 5.5%.
In that, this chart for US interest rates was predicted (Note, not in a “I think ..” way, in a “If it matches bubble knowns” way).
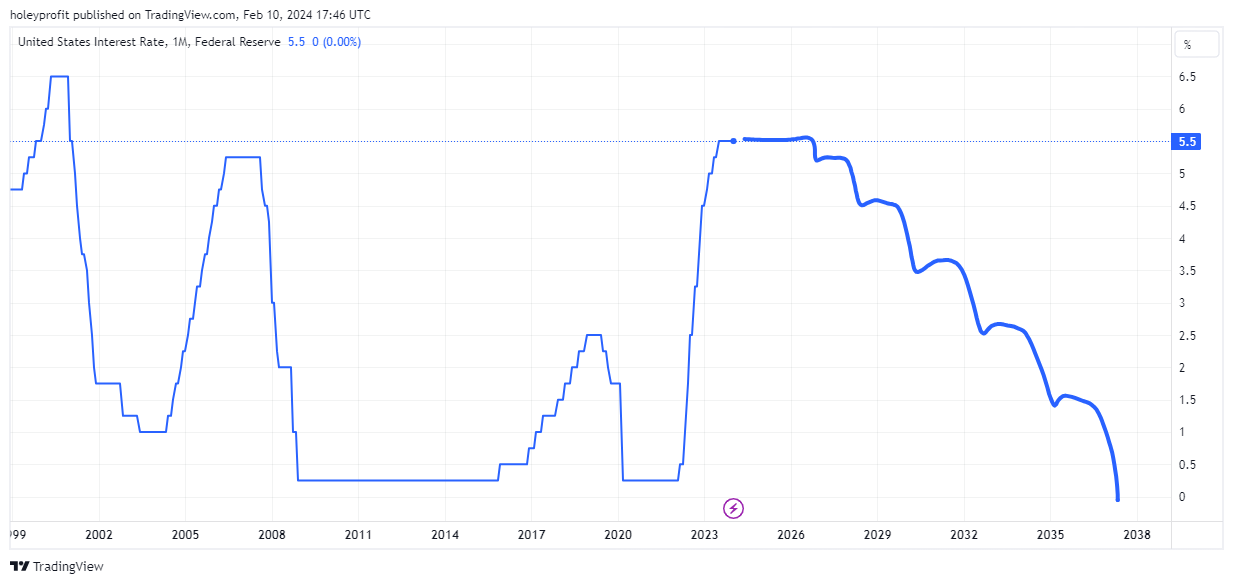
Matches so far.
The Pump and Dumps
Pump and dumps have been present at the tops of bubbles for as long as records exist. In the late 1920s there was no law against it. There were investment pools that would accumulate a stock, begin to talk it up and then trade the stock between themselves to make it look like there was a lot of action in the stock.
Then the public would come in and begin to buy, but by now those who were making the price go up and the stock appear popular are selling - to them.
RCA is said to be the most famous pump and dump in history.
Stock Price Surge:
1924: ~$11
1928: ~$85
1929 (Peak): $505 (split-adjusted) in September
The stock rose ~5,000% in 5 years, fueled by speculation.
RCA never paid a dividend, yet investors piled in due to its "limitless" future.
Similar to 1990s tech stocks, growth was prioritized over profit.
Dotcom was riddled with pumps and dumps. Here’s some of the most notable ones.
1. Pixelon (Private)
Pump: Promised to revolutionize online video streaming before broadband was widespread.
Fraud: Founder Michael Fenne (real name Dennis Morin) had a criminal past and exaggerated the company’s technology.
Burn: Blew $16 million on a launch party (iBash '99) featuring U2, The Who, and KISS.
Dump: Collapsed in 2000 when the tech didn’t work.
2. VA Linux (LNUX)
Pump: IPO in December 1999 at $30, closed at $239, a 733% gain in one day.
Dump: Stock crashed 99% within two years, dropping to $1.19 by 2002.
3. TheGlobe.com (TGLO)
Pump: IPO in 1998 at $9, hit $97 on day one (+1,000% gain).
Dump: Fell to $0.10 by 2001 when advertising revenue dried up.
4. Pets.com (No Ticker)
Pump: Heavily marketed, spent $11M on a Super Bowl ad.
Dump: Burned through cash, collapsed in 2000 just 9 months after IPO.
Stock hit nearly zero before liquidation.
5. Webvan (WBVN)
Pump: Online grocery hype, backed by Goldman Sachs & SoftBank.
Dump: Stock fell from $30 to pennies, burned $1 billion, shut down in 2001.
6. eToys (ETYS)
Pump: Valued at $8 billion in 1999, more than Toys "R" Us.
Dump: Bankrupt in 2001, stock dropped from $84 to $0.09.
7. CMGI (CMGI)
Pump: Dot-com incubator that invested in 100+ startups.
Dump: Market cap fell from $41 billion to under $200M after the crash.
8. 360networks (TSIX)
Pump: Claimed it would be the "backbone of the internet."
Dump: Market cap fell 98% in a year, filed for bankruptcy in 2001.
9. Excite@Home (ATHM)
Pump: One of the biggest internet portals, valued at $35B.
Dump: Crashed to pennies per share, shut down in 2001.
10. InfoSpace (INSP)
Pump: Founder Naveen Jain dumped $80M in stock at the peak.
Dump: Fell 99%, lawsuits followed.
Or Japan, the manipulation of small caps was common practice.
Certain small-cap companies were targeted by brokerage firms, investment groups, and even banks.
A common technique was to buy up large portions of shares, create a fake sense of demand, and then dump onto retail investors.
Example: "Zaitech" Accounting Scams
Many corporations used unrealized paper gains from their own pumped stocks as collateral for loans.
Once the stock price collapsed in 1990, the companies couldn't cover their debts, worsening the crash.
The interesting thing to consider here isn’t if we have pumps and dumps going on in the current market. Surely a person who didn’t see that was happening would not get through as many words as it takes to get to this stage of the post - we all know there are pumps and dumps going on.
The interesting thing is, we actually seem to have managed to hit all of the different pump and dumps metrics of previous bubbles. We have the small cap manipulation of Japan, we have the making things up because people will buy the sector, like dotcom and we have the belief new tech and future development trumps profits.
Between the different meme pump and dumps and the whole mess of pump and dumps that is crypto, we’ve covered it all. We did it, team!
We’ve got the pumpiest dumpiest market we know how to aspire to based on previous efforts.
The Overconfidence
I’m not going to talk about how over confident crypto bulls are because it’s just too vast a subject. They’re too confident in too many ways based on too many easily debunkable things. I can’t be bothered going through it all - let’s just ignore that bubbliness going on and talk about indexers and big cappers.
How often do you see them saying things like;
Buying (whatever), I have no long term concerns!
If you’re still buying stocks here, I’m proud of you!
I know I can’t lose over 20 years!
Short term dips are long term opportunities!
These sayings have a common theme to them, and that is they are cliches. Things said a lot and because so many people say them others start to think these must be true, because otherwise so many people would not say them. So then they start to say it, and get more people saying it … and lots of people say things they’ve not checked.
Buying this leading company now. I know in 20 years this is a great company.
Dumb. Very easy to prove this idea is very dumb, because all you have to do is check how often stocks that were the greatest companies of their day were still the greatest 30 years ago. You’d find that your odds of failure with this is something like 80%. It’s extremely hard to pick a long term winner based on being top today.
The companies do not go out of business very often, things just change and the stocks underperform. This isn’t a tricky thing to test. But people don’t.
As long as you buy good companies for the long term you’ll be fine!
People using Buffet quotes to support their buying at these levels while Buffet it publicly disclosed as being in record levels of cash.
These things do not make rational sense … but everyone thinks they know everything.
Markets are currently 10% off the high in indices (Except RUT, which is terrible).
Daily I am seeing;
Have to start DCAing in here. Might not get a chance like this again!
Selling some index funds to get more aggressive with these individual names (No concerns long term!!!)
And if they ever give any mention to risk, it goes something like this;
I don’t care because I KNOW I’ll be up in 20 years.
And I hope they are, but I feel I “Know” their odds of that are actually statistically terrible.
We’ve never had a stronger confluence of warning signals for tough times in the decades ahead than we have right now.