
Plans for Imminent Bear Break (And contingency plans)
Plans for Imminent Bear Break (And contingency plans)

I’m going to write up my case for an imminent crash leg coming. I think the crash leg setup is so incredibly obvious as per the norms I’ve observed in market breaks. A move to close to 4000 seems incredibly probable to me and it would be implied it comes with the cleanest selling leg we’ve seen since 2020.
I’d have to put my expectation level for a crash leg - Actually, before we go any further let me define “Crash leg”. Because I’m not saying SPX is going to 2500 next month.
I think it’s possible we’re witnessing somewhere in the top of a reversal of the overall trend. This is different from a 2008 like event where the market went down quickly and came back quickly. A reversal of the trend would see the market go down in a series of crash legs.
Read the case for a reversal here (Free post): The case for a macro bear has now fully developed. (substack.com)
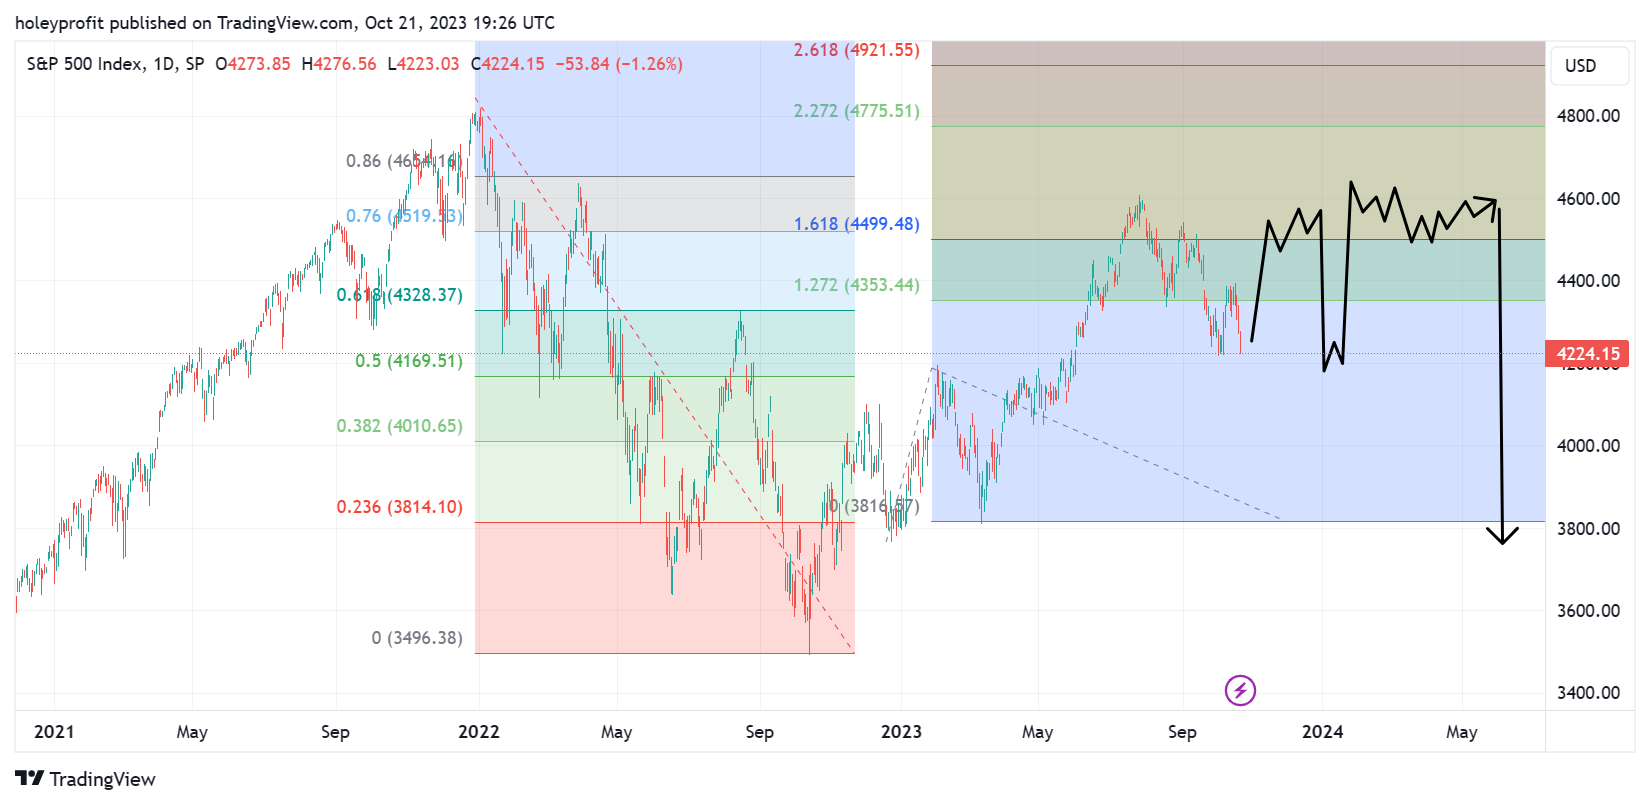
This would be the overall bear forecast if we were actually seeing a reversal of the trend rather than a bear move being a correction (Like we’ve become used to).
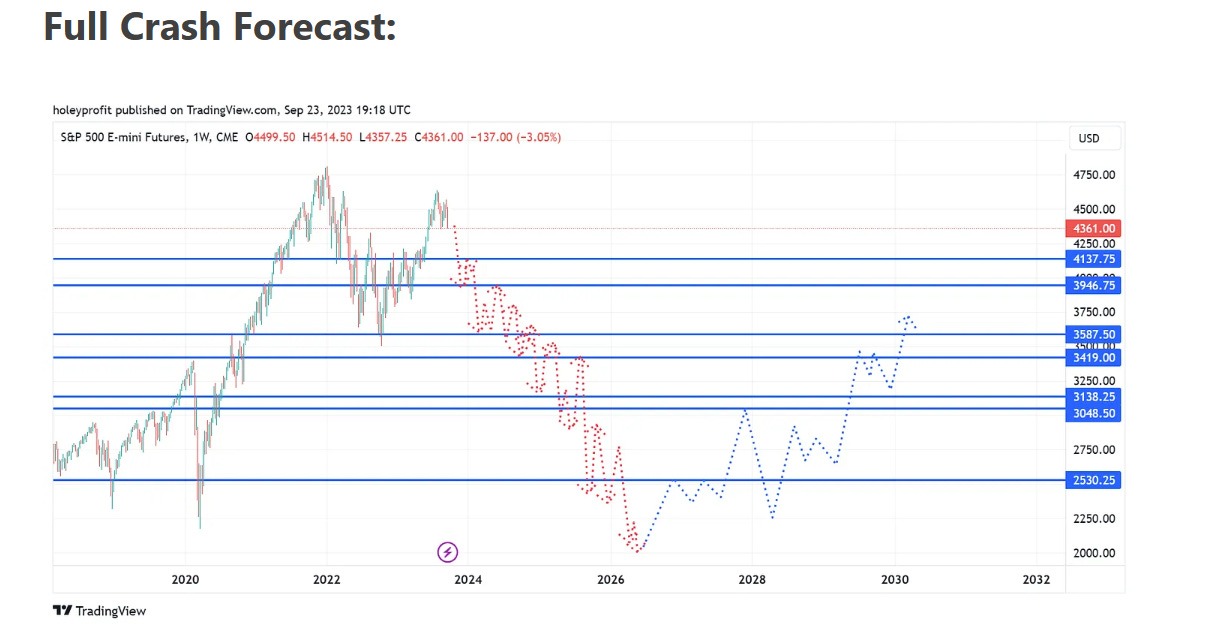
See full forecast (Free post): Full Crash Forecast - by HoleyProfit (substack.com)
What I am talking about here would be break one.
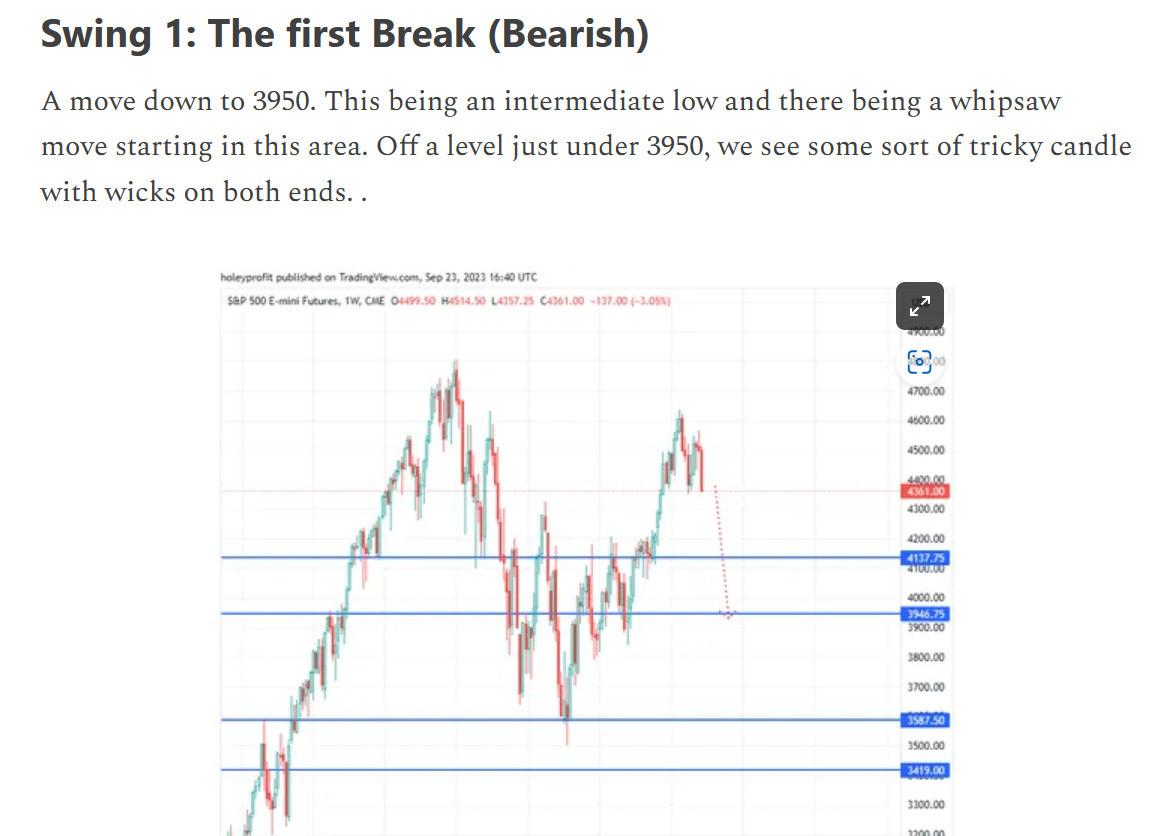
Break one would be crash like action on 1 - 4 hour timeframes. We’d be seeing a crash relative to the 2023 move. If you think of 2023 as a mini bubble, that bubble would be about to break and we’d crash over through a lot of the leg.
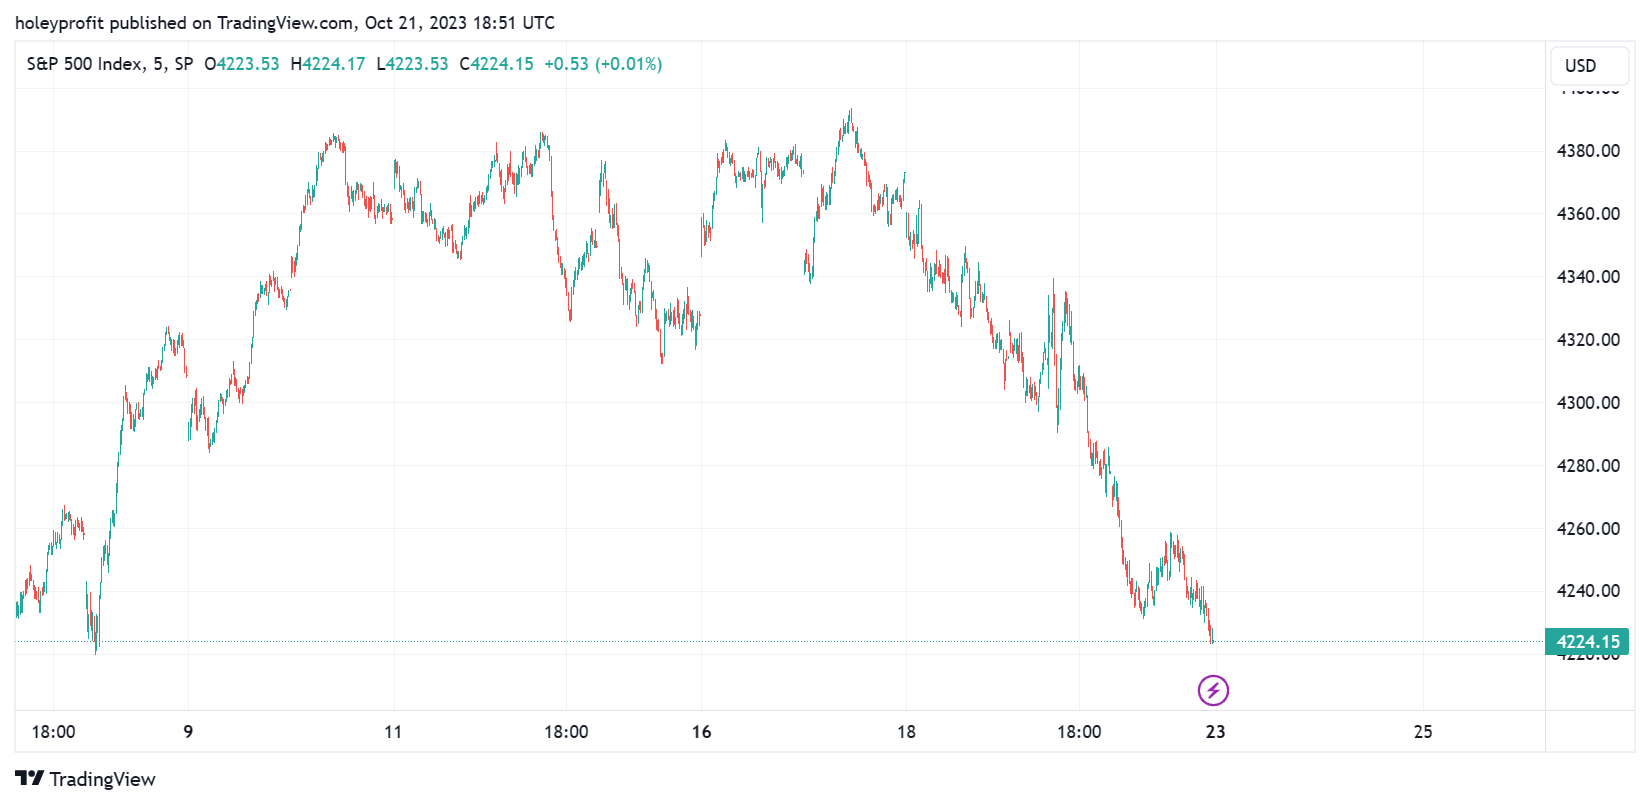
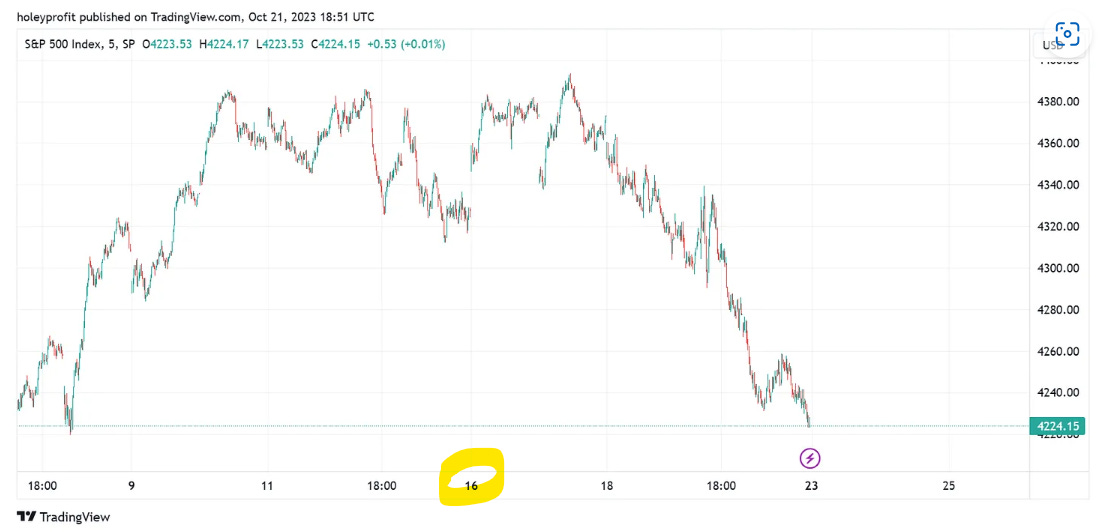
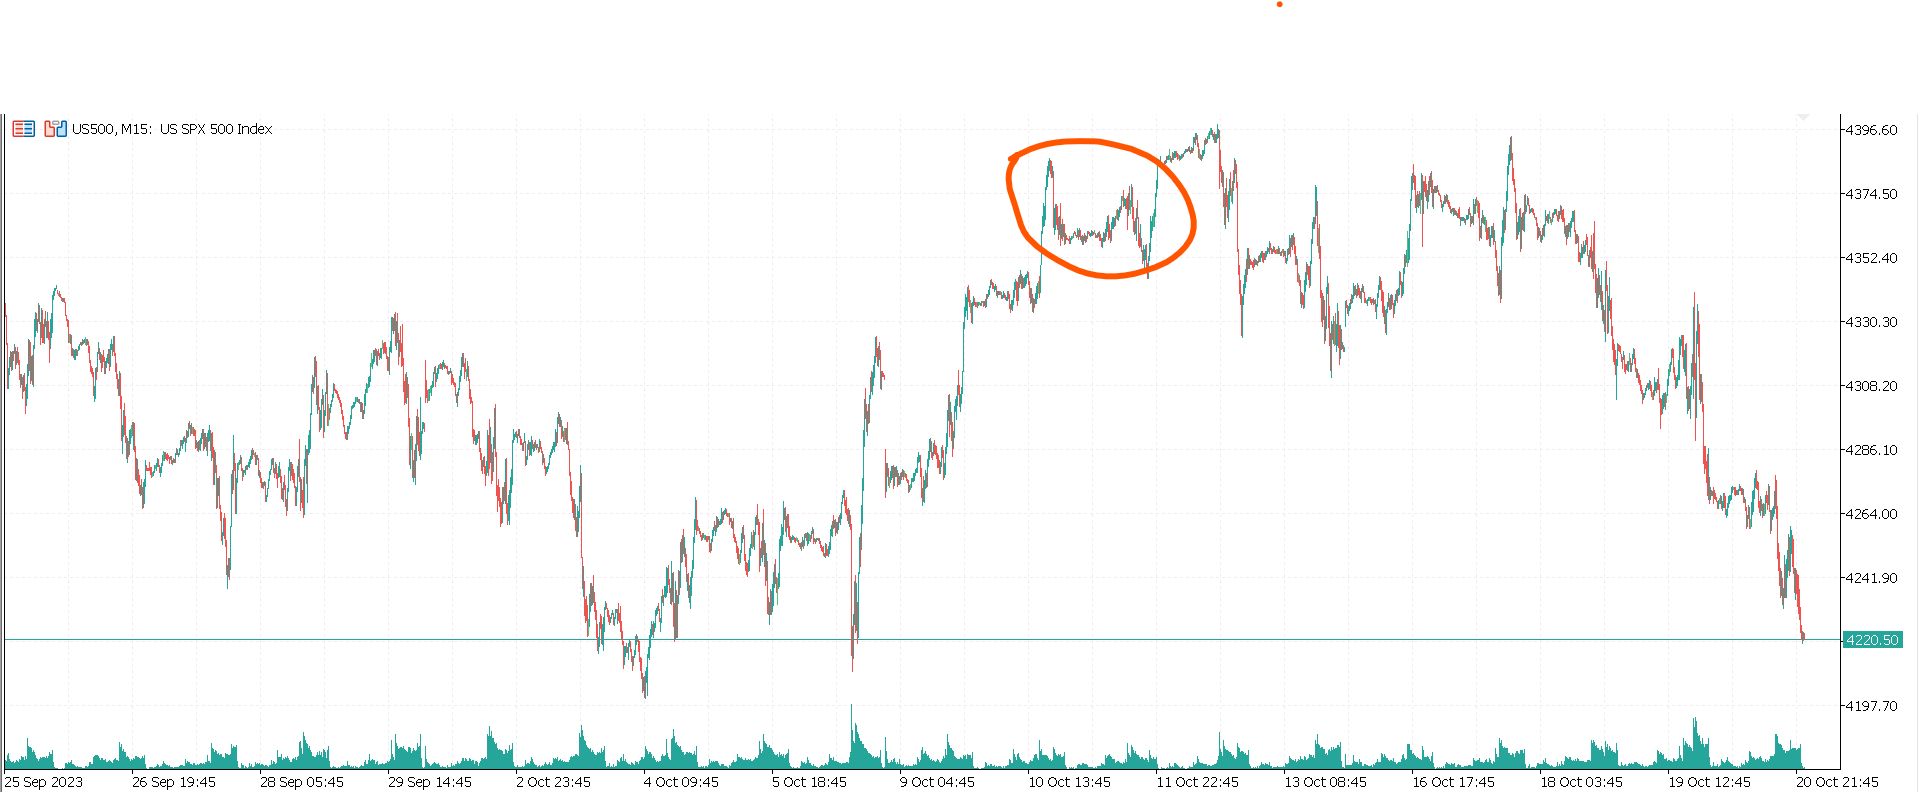
Here’s perspective. Here on the 5 minute chart the market made a little bubble move and then it crashed.
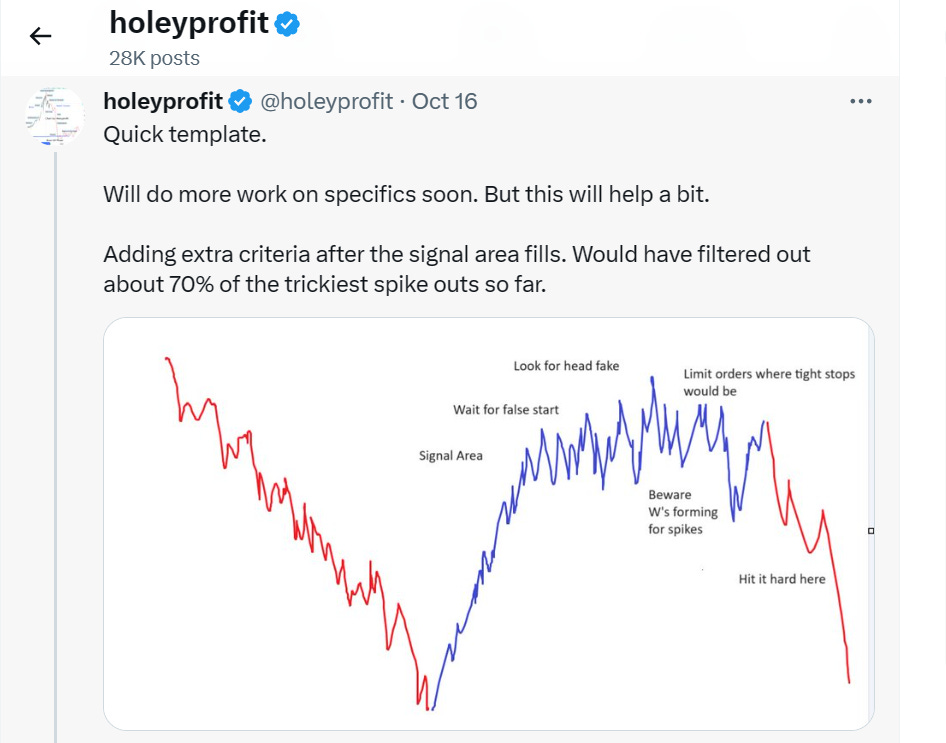
And the form of how this would top and crash was predictable based on norms of what usually happens in bear moves with some adjustments made for recent norms in indices (They have been bad for spiking out levels). Here was a forecast of how we might see these types of moves form.
The action after the 16th was significantly similar to this.
I can do this a lot on small charts. I’m really good at this. Not to be boastful, but this is my thing. I’ve been doing this on Forex pairs for a long time before I considered trading indices. The fact I can test the rules I have to do this on small charts against previous crashes and they worked makes me think I can forecast a big crash.
As I am making larger and larger move forecasts I am just scaling up the same basic concepts used here. These are working very well. Through 2022 and 2023 we’ve been predominately on the right side of all the big swings and it’s all been rooted in this general form of modelling moves and extrapolating future forecasts.
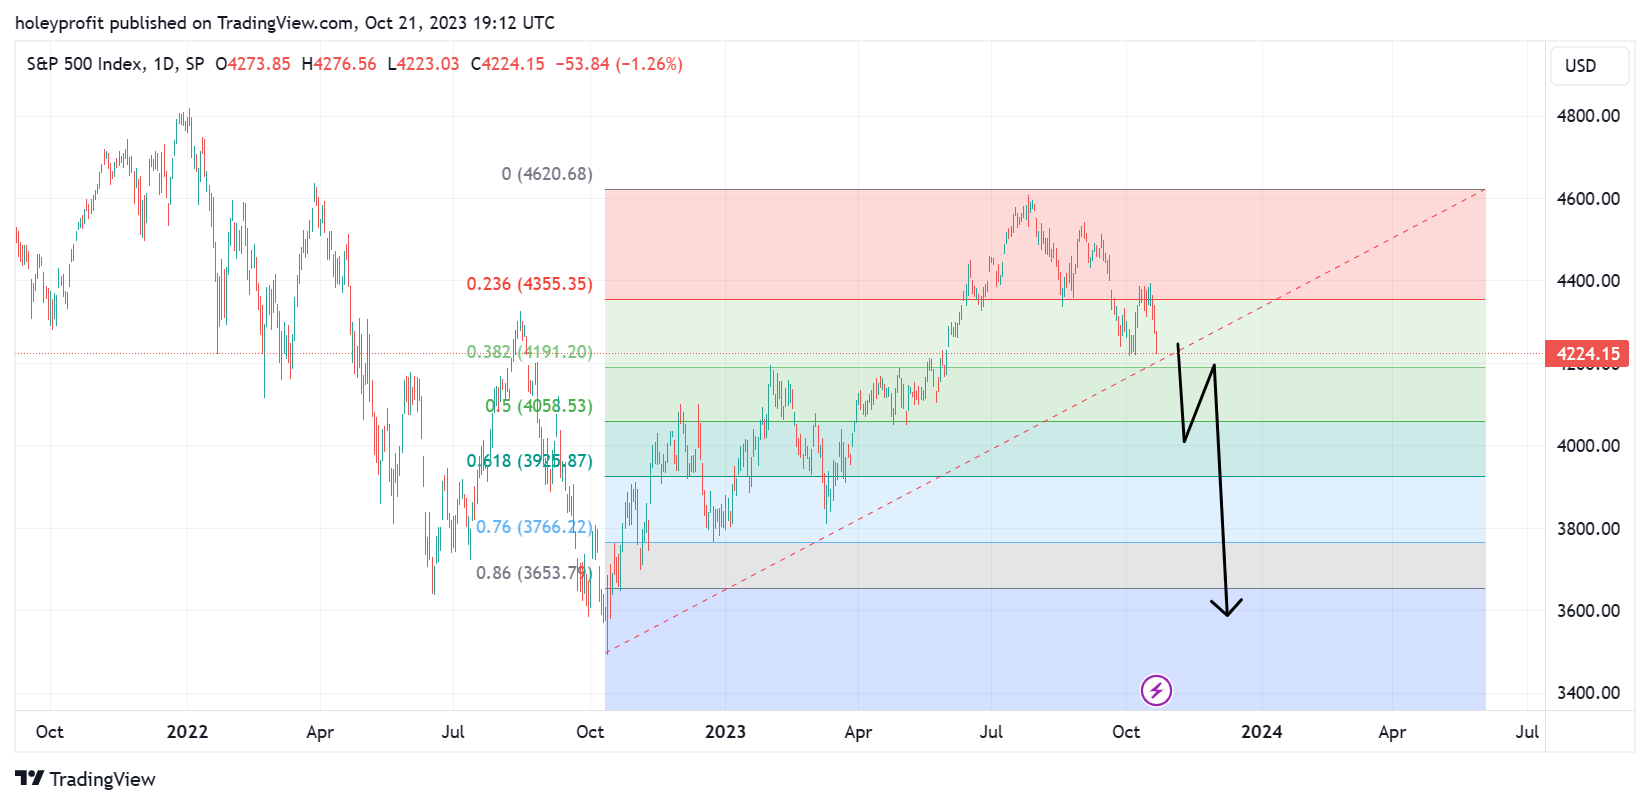
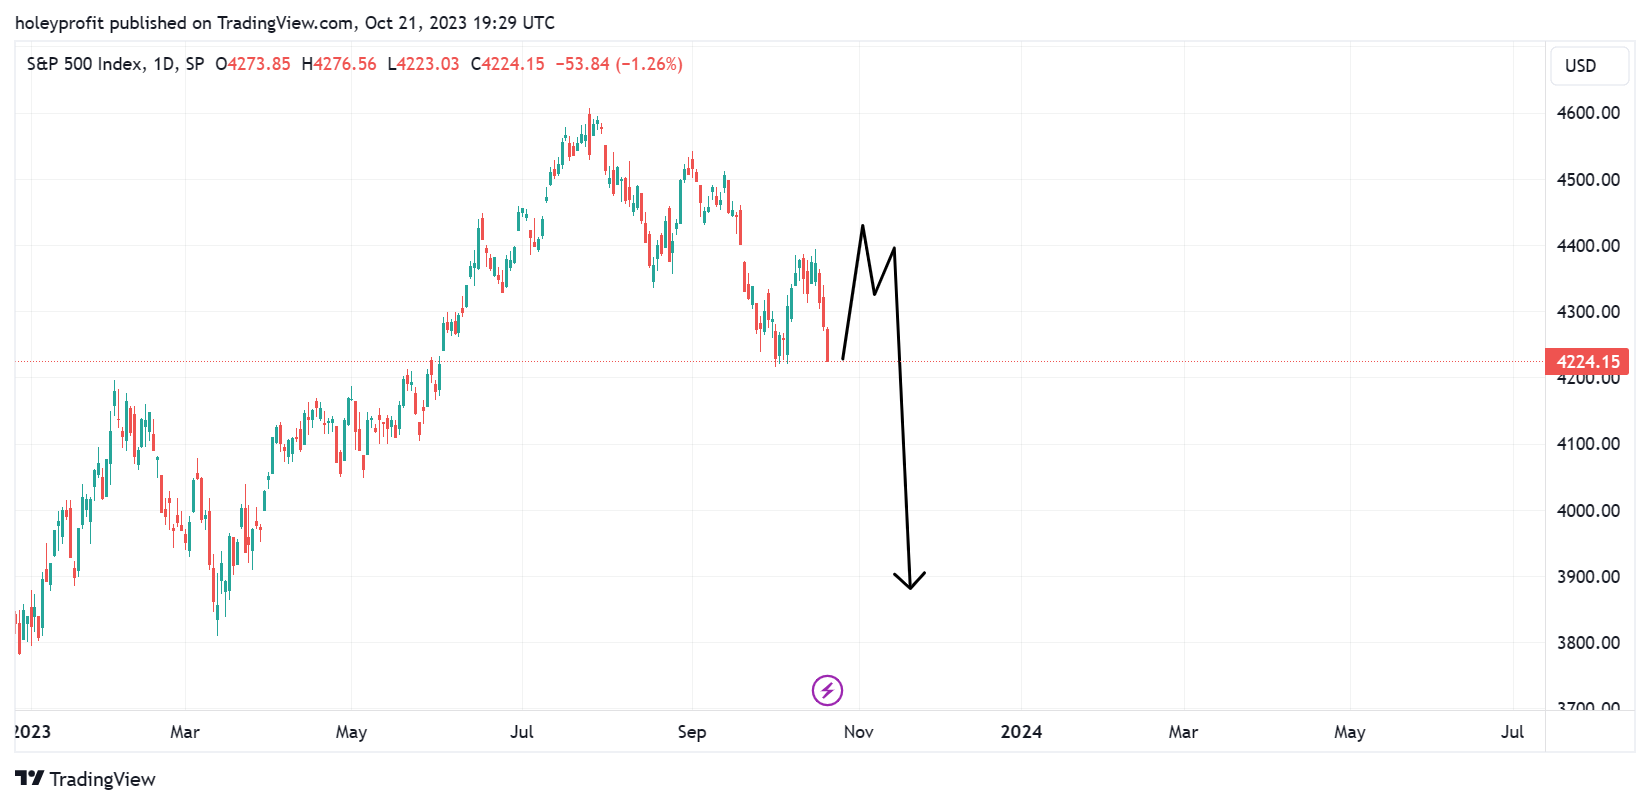
So with that said, here’s a forecast of a crash relative to 2023.
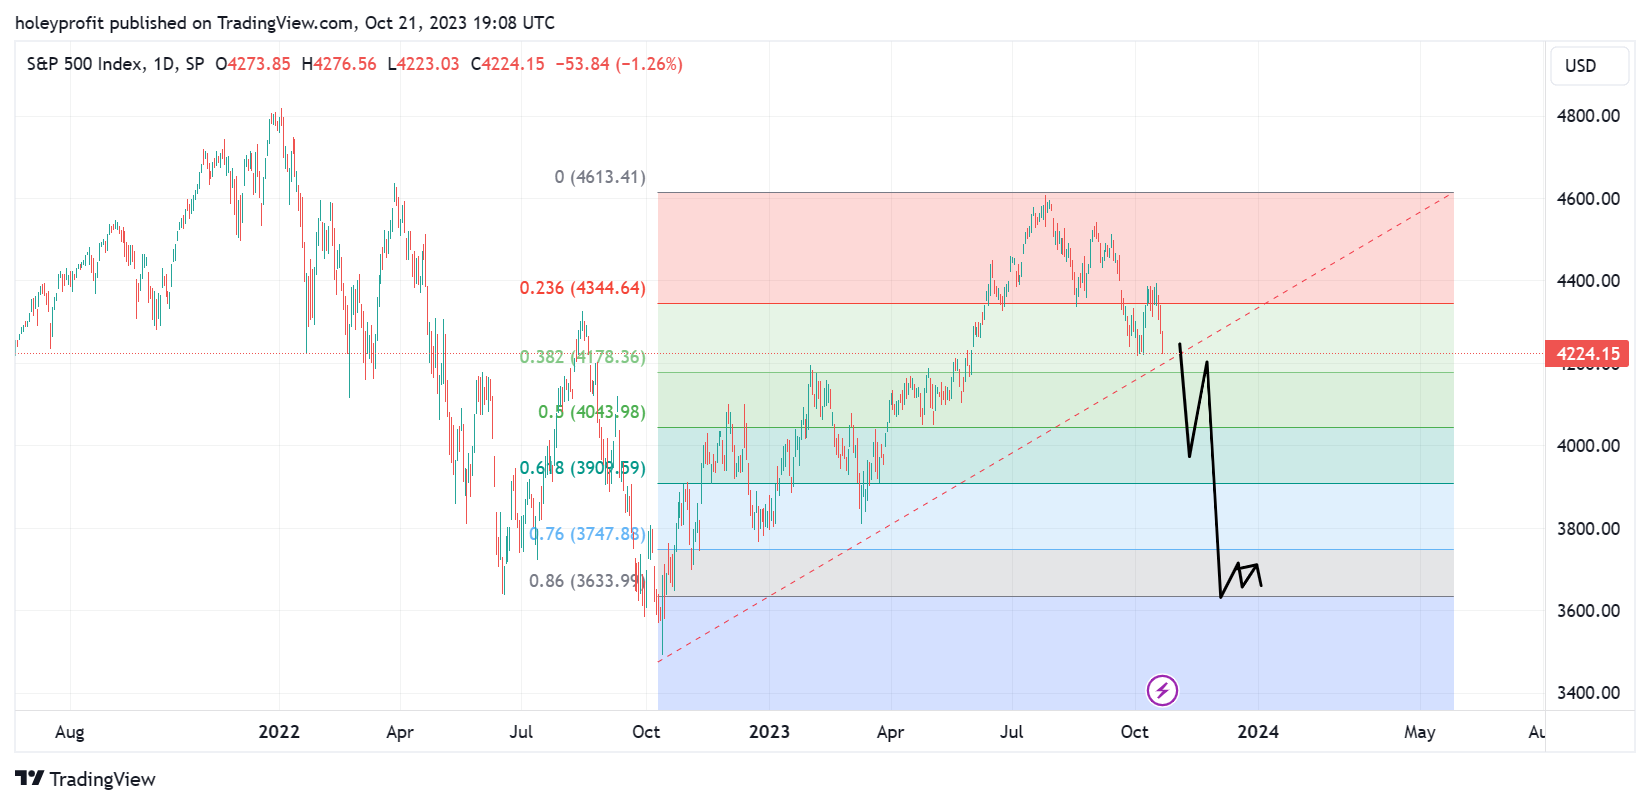
Dump to around 50. Correction to 38 and then the real slam.
Just like this.
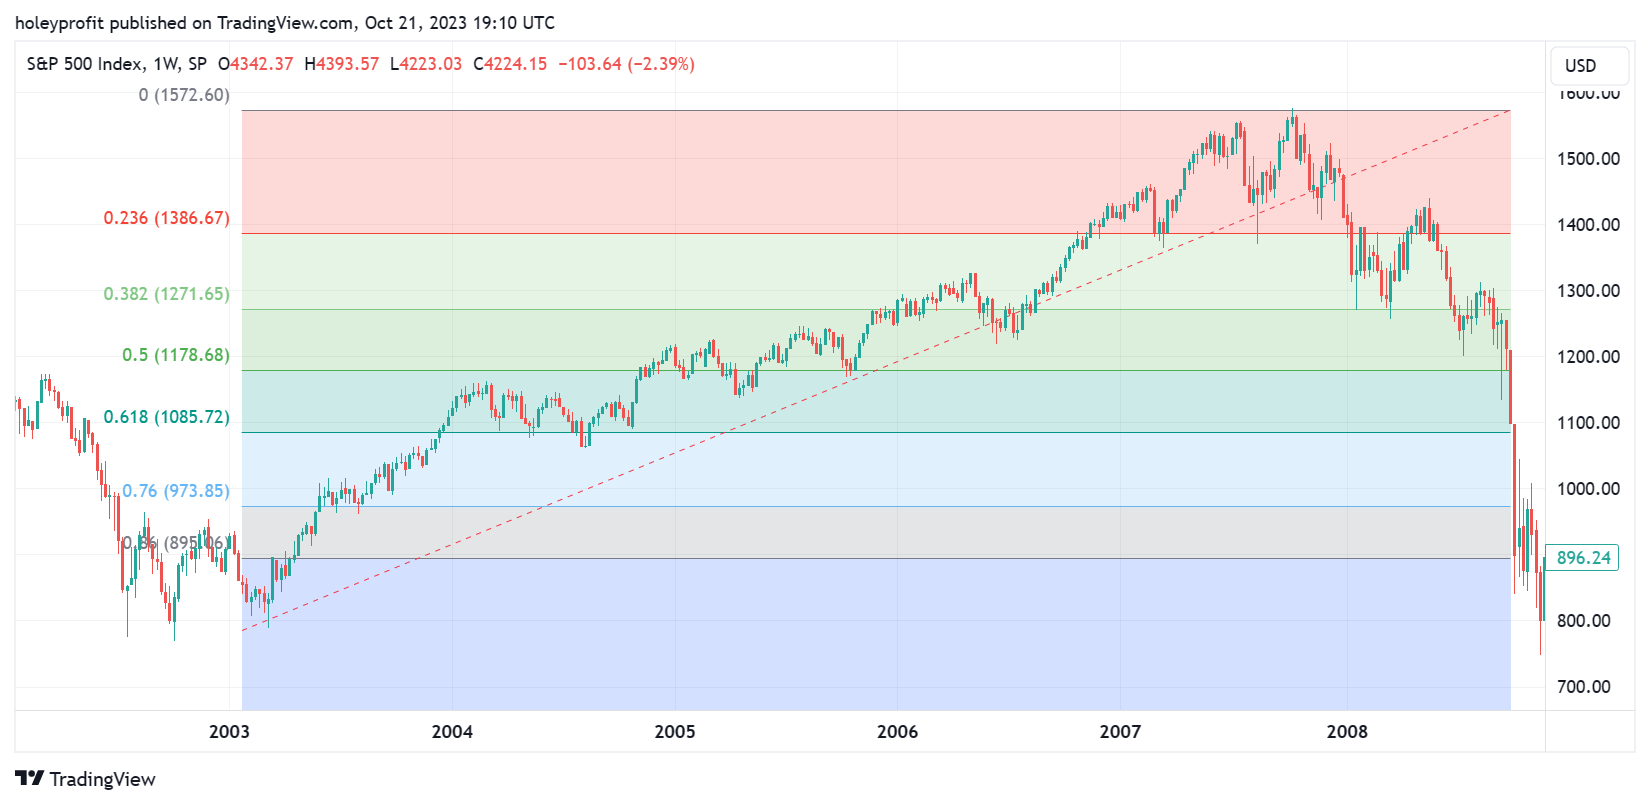
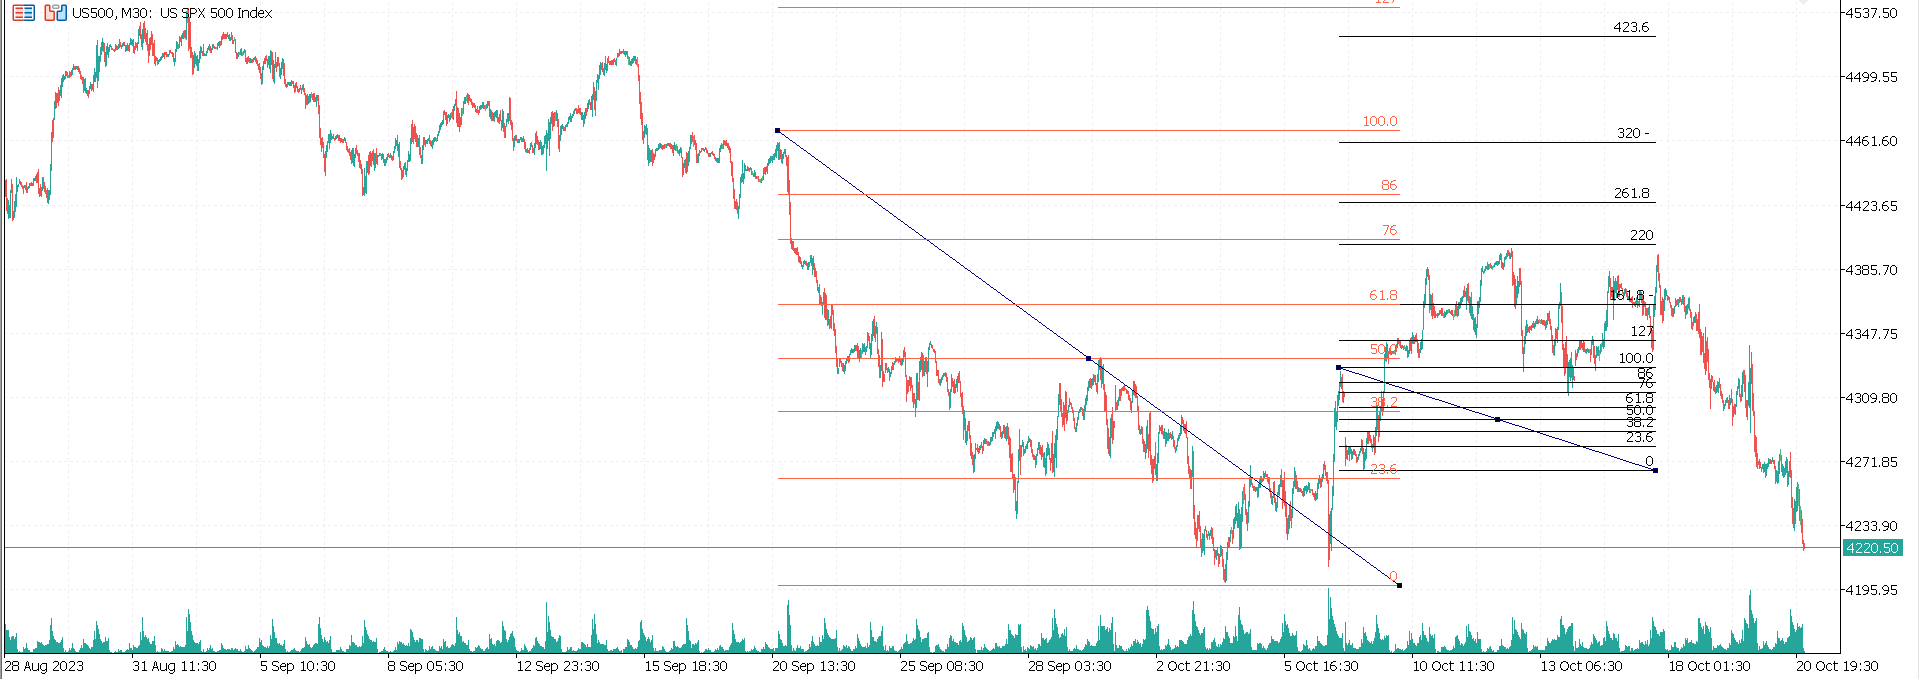
This little move acted very similarly to 2008. Look at the wick candle on the 50. Stops at 38 and then slams.
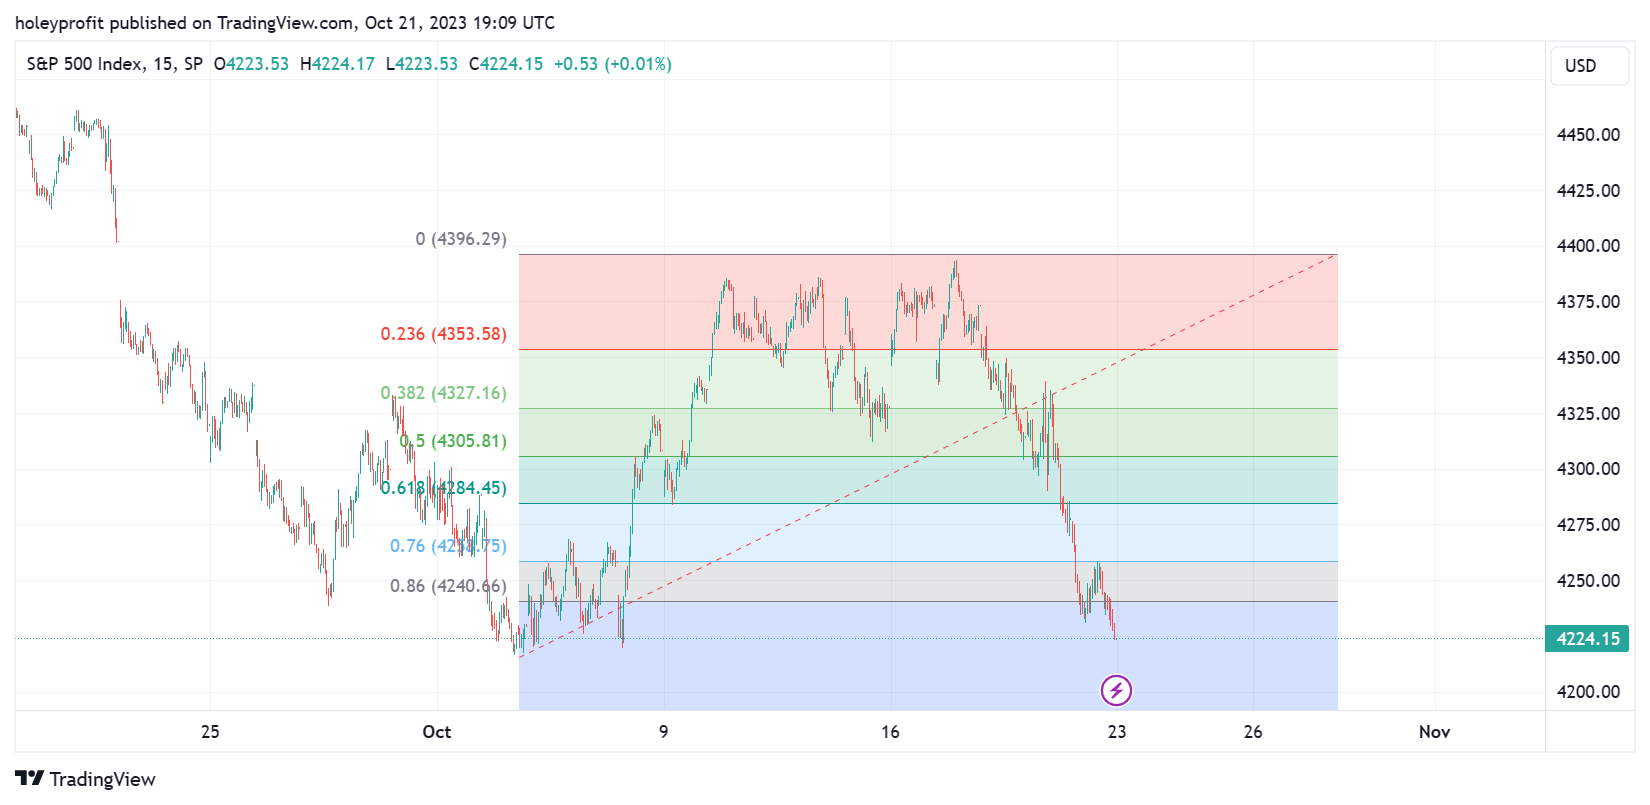
All of the methods we could use are all coming in implying the same types of levels.
So, as I was saying before I realised I really had to provide proper context before it - these confluence of signals that are all agreeing on the same levels along with us having the small versions of the downtrend patterns already happening put my expectation that this move will happen incredibly high.
The highest it’s been at any point previously. I’d have to say it’s somewhere around 99%. I’ve never seen US indices set up so obviously for a dump of 10%.
That does not mean I am right, it just means I’d be liable to be completely screwed if I was wrong. So before I go into my case for this move and trades I am looking to take it in, we’ll go over the ways in which this might fail. From me being just a little bit early right through to being entirely incorrect.
Being a little bit early can be really bad, especially if there’s tricky action. For example, I knew deep in my heart a short was coming here.
And all sorts of nasty came from there.
My signals for this were the confluence of the harmonic patterns and the 76 retracements. This is how sells shape up (Unfortunately, bull breakouts sometimes pretend to be these. No free lunches). This was a very obvious sell pattern to me.
And same.

This is an incredibly obvious confluence of sell signals. For a moment let’s pretend this works 100% of the time and we know for sure a short is coming. If it formed anything like the small chart one we’d be in for a lot of trouble before the short.
We’d be right in theory and lose our money before we were right in fact.
In the blue zone the trade would be so simple to position for, but if you’d thought it was a sure fire short in all the red zones you’d find it hard to even be bearish at that spot.
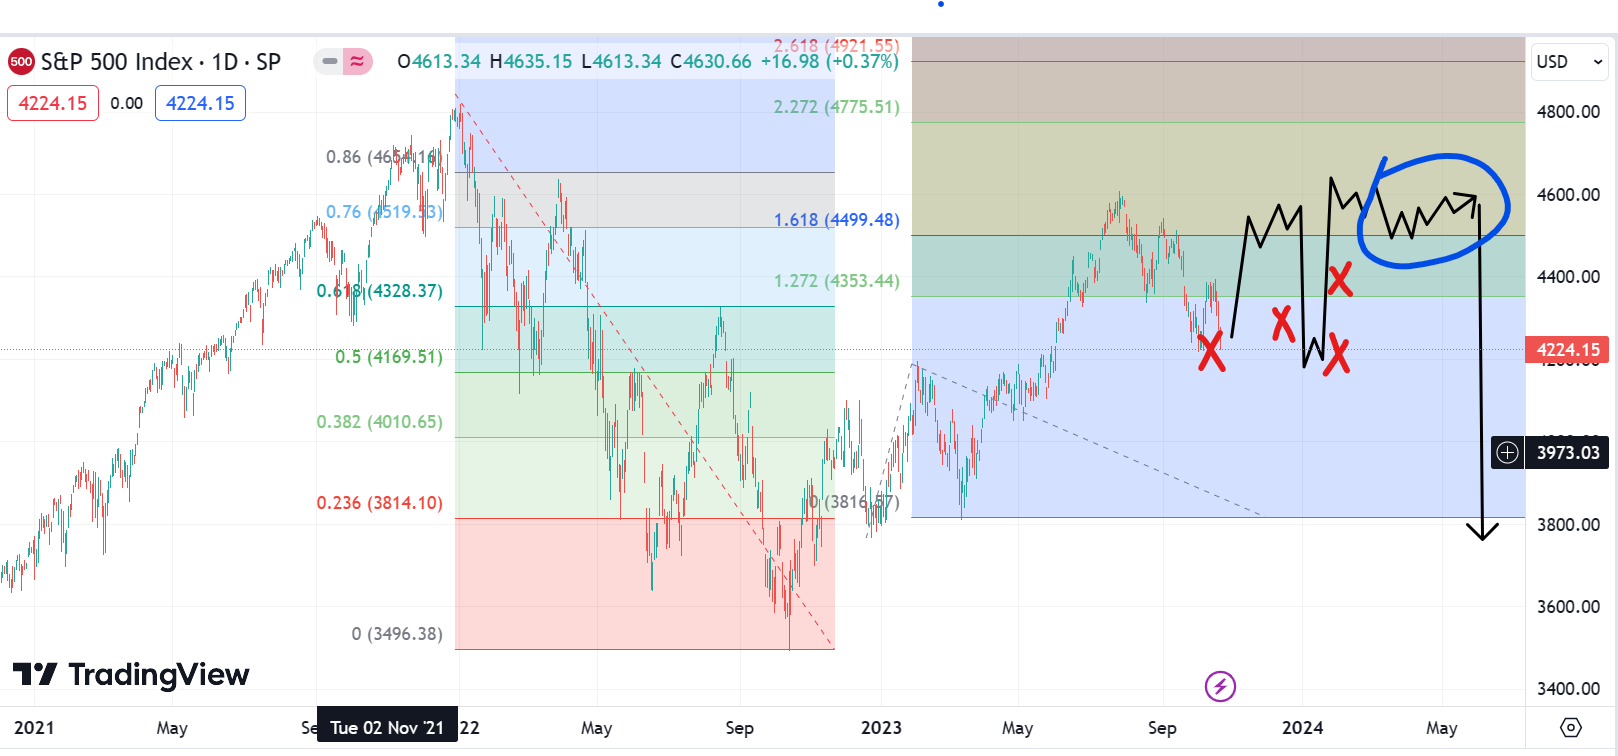
This is an extreme version of trickery. Even much milder trickery could be entirely deadly to overly aggressive shorts. Like this.
Can’t rule out that happen just because the market is a troll.
Again, this would be really obvious bear signal if you knew to look for it but if you short big here and have a stop loss over there - you’re not going to be in the trade.
And these are just bad things that can happen if the forecast is generally correct.
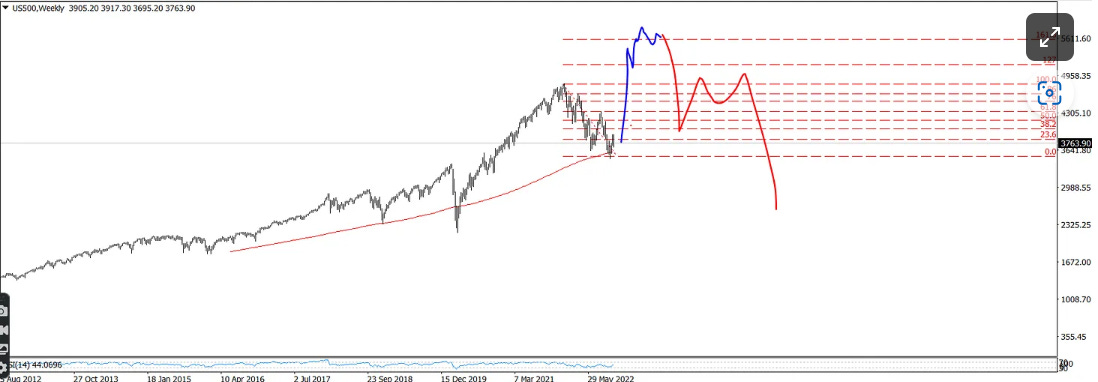
We could be inside of the spike out move forecast early 2023.
Read free post: Supportive work and trade plans for a 2007 style market. (substack.com)
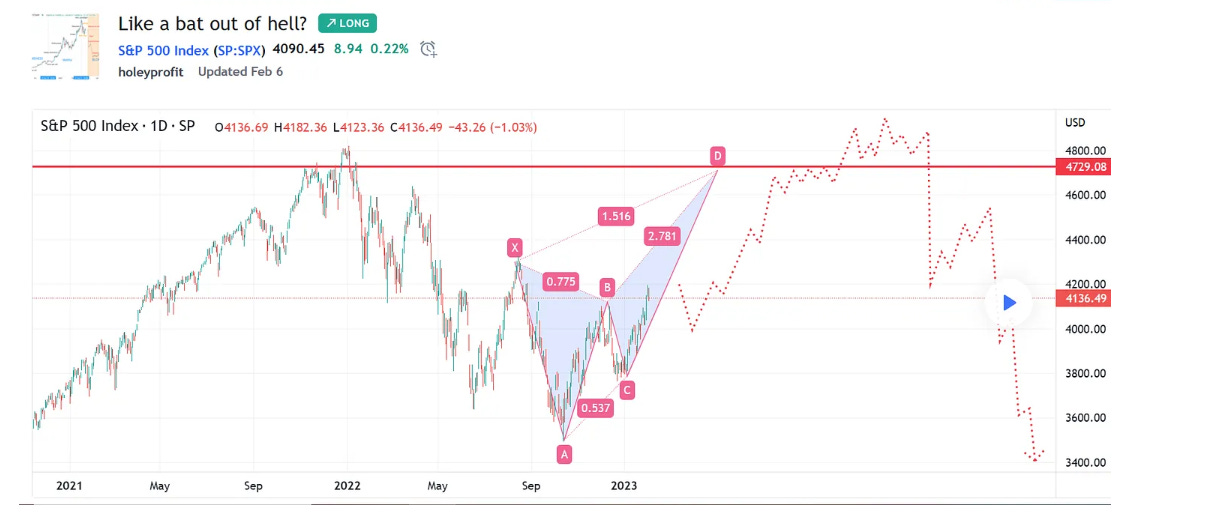
We could even be inside of the ABCD pattern spoken off at the lows in November (free post): Could be a critical week for the bear case. (substack.com)
And every single one of these is a net bearish forecast. They all assume we’ll be in a bear market by 2025. Outside of these risks, I might just be wrong.
I’ve done a lot of work and research to support my thesis. I have countless successes with it on big pops since 2021 through 2022. These concepts I use for real trading and I have specific strategies for how to do it. A lot has happened to suggest I am right - but I might have always been wrong and just successfully forecast a pullback in SPX.
Next, we’ll do the bear porn section where I go through my case for the imminent crash leg to 3800 area and after that we’ll look at how we can build practical trade plans that have the best chance of profiting it the various different potential outcomes here.
Why I think this is the most obvious shorting opportunity I’ve seen in SPX. How we can bet on an exceptional move for exceptional profits if I am right on that. Protective measures we can take to make sure we don’t get hammered if wrong and how we can plan for future swings - which may have extra hard tricks and traps.
I feel reasonably confident the following trade plan can produce exceptional profits in multiple different moves, have a reasonable expectation of breaking even in most types of market moves and only expecting to produce a net loss in a very small amount of conditions - Namely, if only long options were used and we ranged for months.
Since I think the probability of multiple ranging months to be very low, I think we have a good chance of building a trade plan with a lot of upside potential with it not being too likely we completely lose it in. There are no free lunches in the market. I’m not saying anything is for sure, just saying it looks very viable.
Let’s first do the case for the imminent slam.
Keep reading with a 7-day free trial
Subscribe to Market Forecasts and Trade Plans to keep reading this post and get 7 days of free access to the full post archives.