
Risk of a Real Break Must be Taken Seriously Now
Risk of a Real Break Must be Taken Seriously Now

Our break today has the potential to be very significant. We now have to take the possibility we’re in a bear leg much more seriously. I really am worried about a spike but it would be foolish to not be ready for the classic break setup playing out.
Spikes
I worry about being mispositioned if there’s a spike because it seems like something that would be liable to have several 100 point moves coming in bursts, with no pullbacks and very difficult to deal with in real time. It’s hell as a short and annoying for a bull unless you’re happy to buy at highs.
I’ve traded countless big reversals and when there are really sick spikes it always looks incredibly bearish before it starts. I always feel confident short, usually am adding shorts at the low and for the first section of the rip delighted I can sell higher - and then something horrific happens.
The window of opportunity in this to notice the move is not a bear retracement to the time price is aggressively higher is very narrow.
Most of the time when this happens the signals I’ve used were really good signals. When I reviewed it I still thought it looked like a short - but it spiked.
SPX is firing all sorts of classic bear signals. In the next part we’ll cover how these typically play out and how to follow them (Because if we’re really in a downtrend the last thing you want to be is clever - you want to be short, it will be stronger than you expect if you try to be clever with bounces).
But first let’s look at ways in which I’ve seen them spike.
Here’s a nice trendline break. This all looks textbook perfect. If this is the break, things should be fairly simple.

If this holds true, we really are likely to begin a run to new lows which will build to a crash later. Along with the classic Elliot wave stuff this would be a butterfly correction.

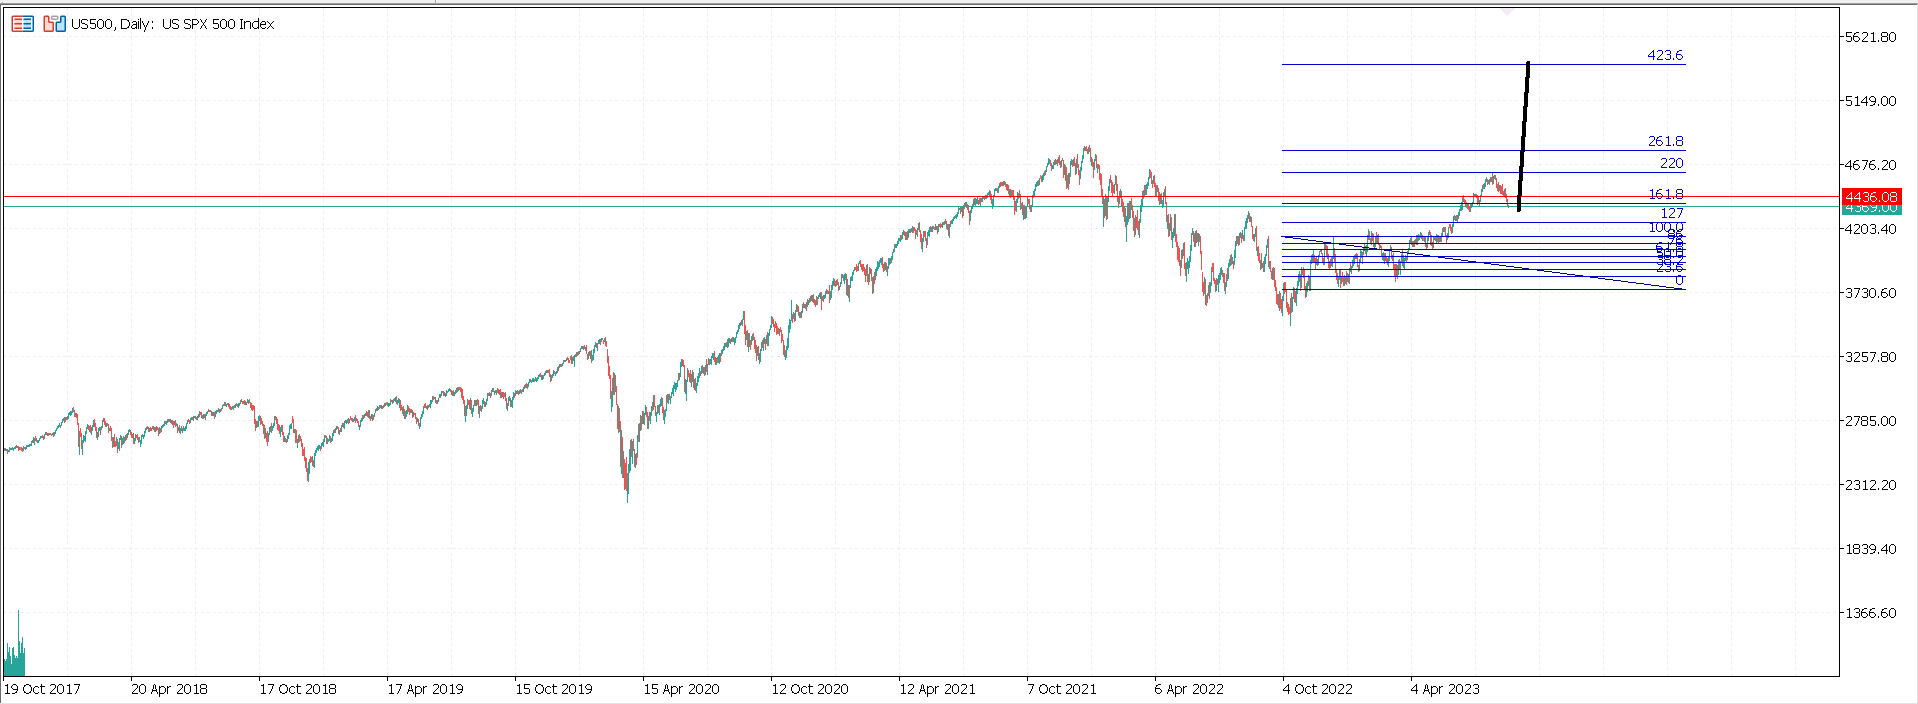
One of my strategies is to use 1.61 as a breakout level and when it pullbacks from 2/20 buy the dip. This strategy works pretty well in the right conditions and when it works usually price heads to 2.61 quickly and then often follows through to 4.23.
This gives us a hypothetical risk area of over 1,000 points. It’s far too much to risk being wrong on before you get to another major resistance level. This would need dealt with if it happened. Dealing with it later would be hard. Dealing with it before sucks too. Not dealing with it is disastrous.
I’ve found the best way to deal with this is to be very wary of levels it could start and take extremely high RR longs on them. Keep using smaller timeframes to short and trail stops and look for high RR spots on big timeframe supports to buy. There’s only a few spots you have to worry about squeezes (In theory) and it’s tiny in perspective.

Red is areas where nasty squeezes are likely. In these zones it’s best to be particularly aware of them. Blue is the overall profit potential on the bear move. Red does not take much from blue in this example.
But if this happens, red can stop blue from happening for you.
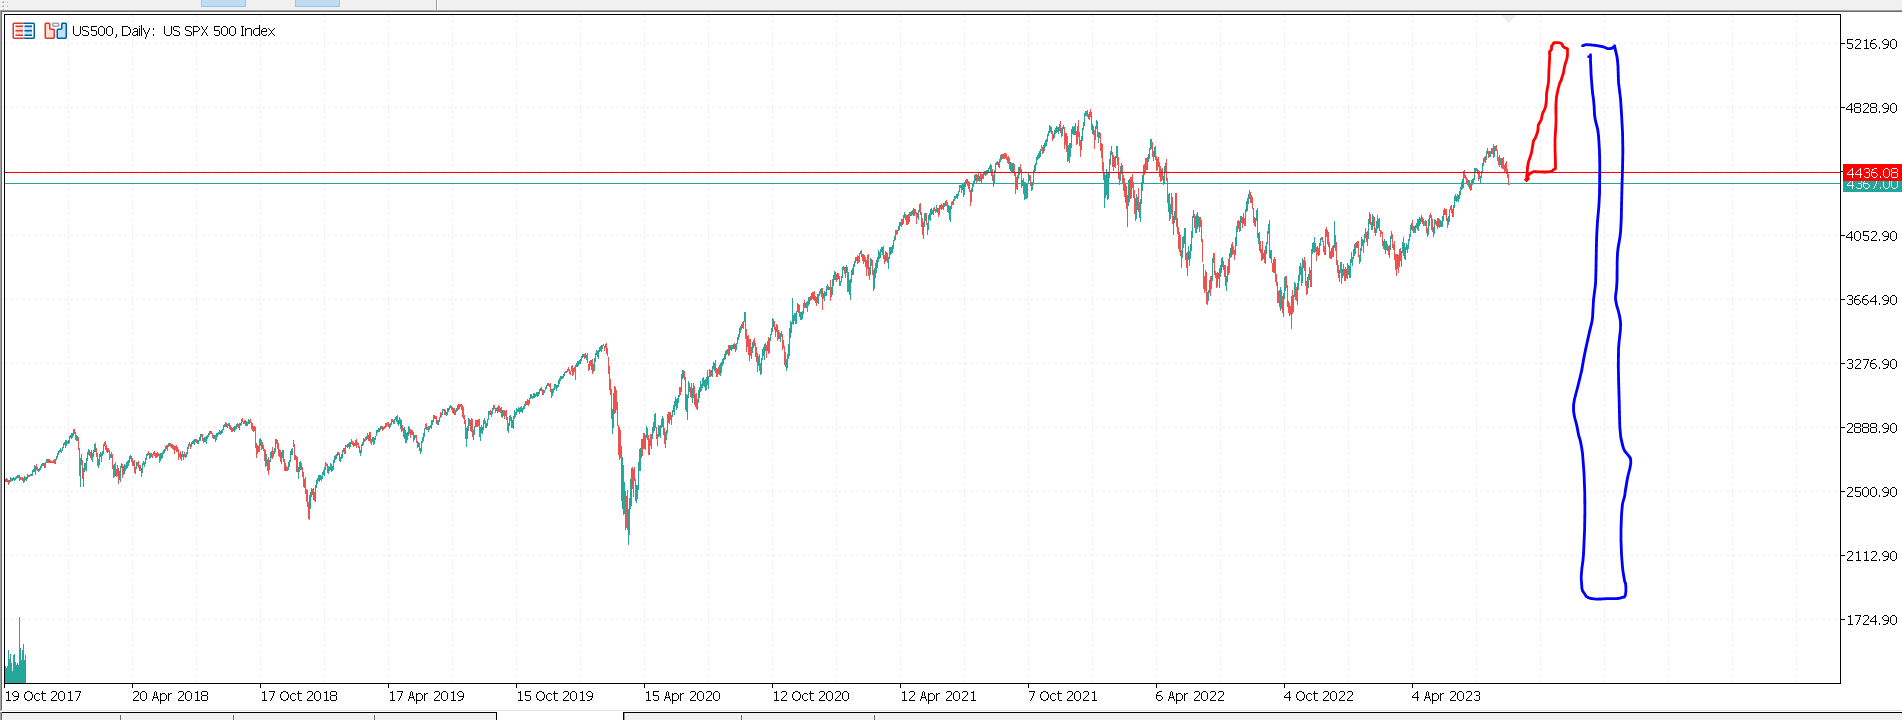
The risk of not being prepared for that is too high. You always have to think about the worst things that might happen to you. Even if the odds are slim. Russian Roulette has very favourable odds. Things that can be really bad have to be mitigated as best possible.
Let’s play “Pick the Crash”. I’ll show you three charts. Two of them are crashes and one spikes. As you look at each, decide spike or crash.
1:

Spike or crash?

Oooh. Spike! Broke all the supports. Tonnes of momentum, Then spike.
Here the FED dropped rates.

SPX went up close to 4% that day. It would then be very close to the high. The high of the crash can be seen here.
And there are no other pics. If you picked crash, you lose. That’s how it really works. You don’t get second chances. I tricked you. That’s how it works.
This:

Could end up like this

:Without good ways of dealing with at least the parts of this that were easy to deal with, you’re not going to end up doing well in that. Being right overall will not help.
This is why I worry about spikes. They can be disproportionately harmful to you than the bother it causes worrying about them when they do not happen.
Here’s a very similar pattern to what we have now in our “Not crash” example.
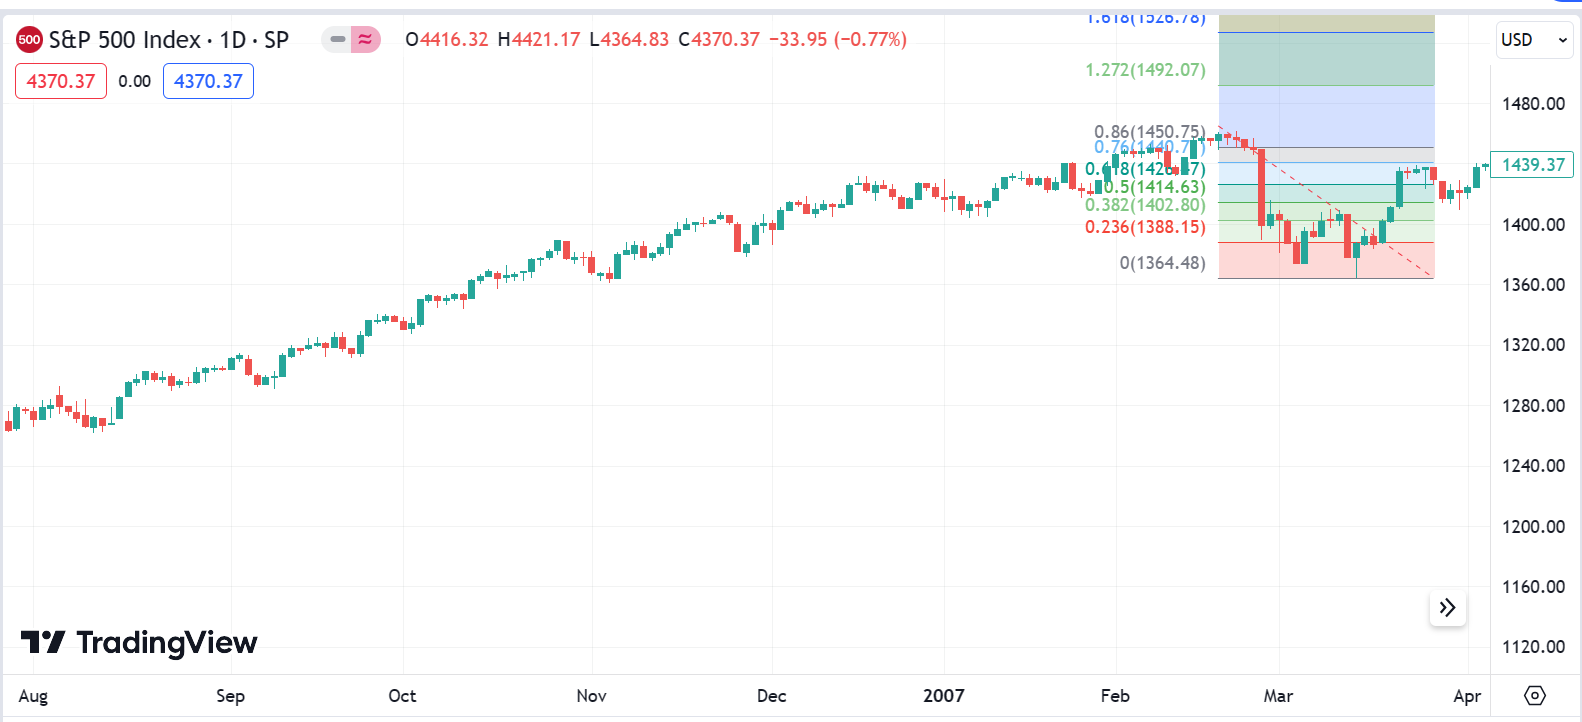
I do the back testing of my strategies honestly, and I know there’s no way I want to go long at the right time there. And within one candle the whole drop is covered. And then I don’t want to buy the high. I understand the only realistic way for me to navigate this is be alert to the risk here. Thinking bull when it looks worst.


These are not dissimilar!
But this is also totally similar to a real break so let’s get onto that.
The Bear
I think the market is going to spike. What I think does not matter. To illustrate how little it matters when I started to write this I was thinking things look really sketchy for a bear break and when I was talking about the spike I found myself thinking surely all these super confident bears, many on their first big bearing outing … surely they’re not going to get away with it.
Surely they, too, will feel the wrath of underestimating a trend. I’m going to be a bit jealous if they don’t. I’ve experienced spikes that have scarred my soul.
If the market is not going to spike, wave three of Elliot has begun. We have the setting for a textbook crash. We have the full macro bear thesis complete and we have the systematic selling characterising the run up to a capitulation period. We’ve just sliced through the first major bull trend support.
At this point charts can be easily marked up using the full crash model norms.
If we are in a huge Elliot wave 3 the trend will be CONSISTENT. Lower lows and lower highs. All rips are sold. The best play is to keep limit orders set for spikes, fading aggressive rallies close to bull breakout levels. The strength and consistency of the selling we’ve seen so far would be tame relative to what is due.
So here we have our 2022 drop and 2023 rally in the nice expression of the Elliot waves giving us a textbook leg 3 starting.

I’m just playing.

Just to keep everything in perspective.
Here’s our Elliot forecast.
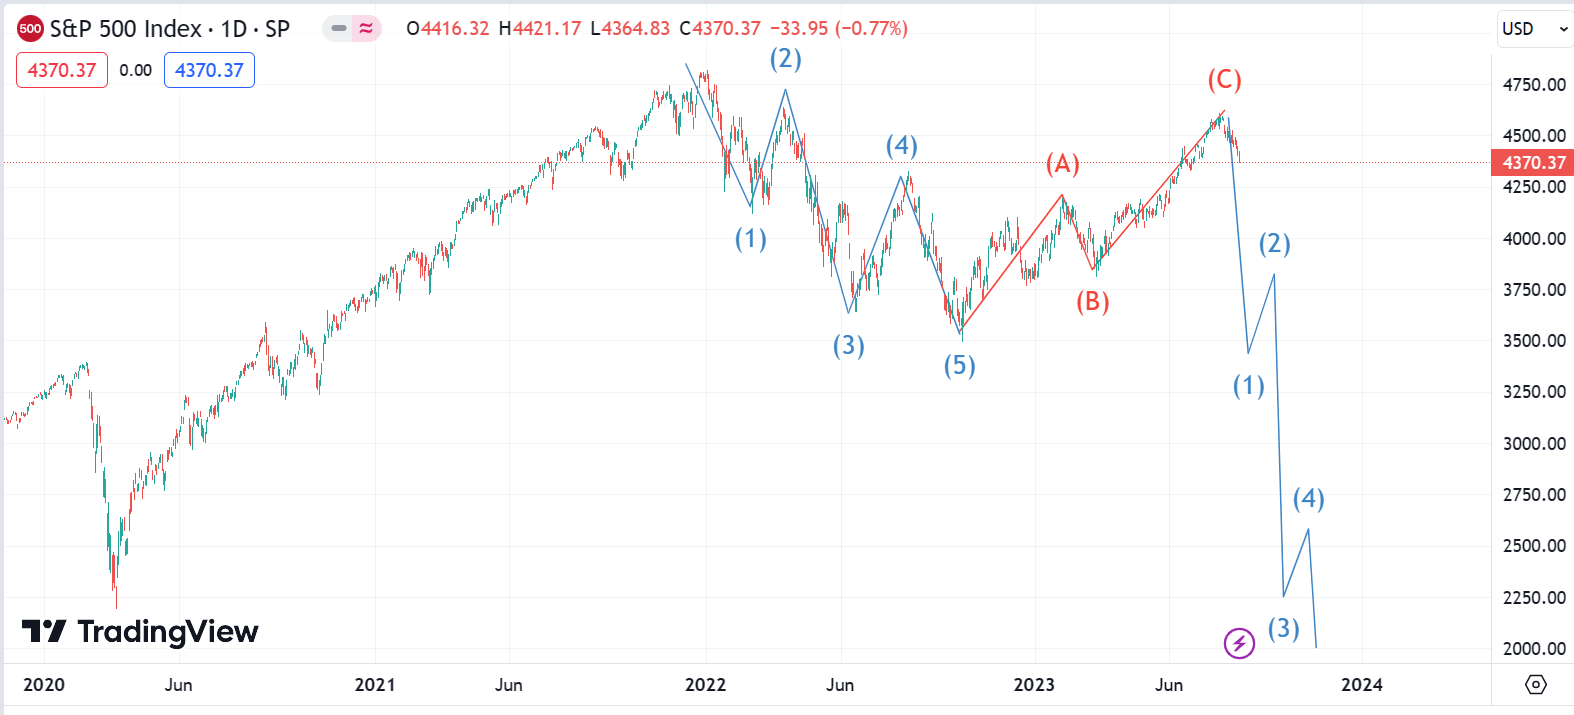
And this looks super legit. Actually looks more legit that the fake one I posed before. It is very viable this is where we are and this has now started. If the book rules are going to be the real rules, the crash is now underway. We’re very, very early in the break.
Our correction has been made with a big butterfly and since the correction is a big butterfly we can reasonably confidently establish the target for a capitulation period to be the 2.20 of low to the high of the W.
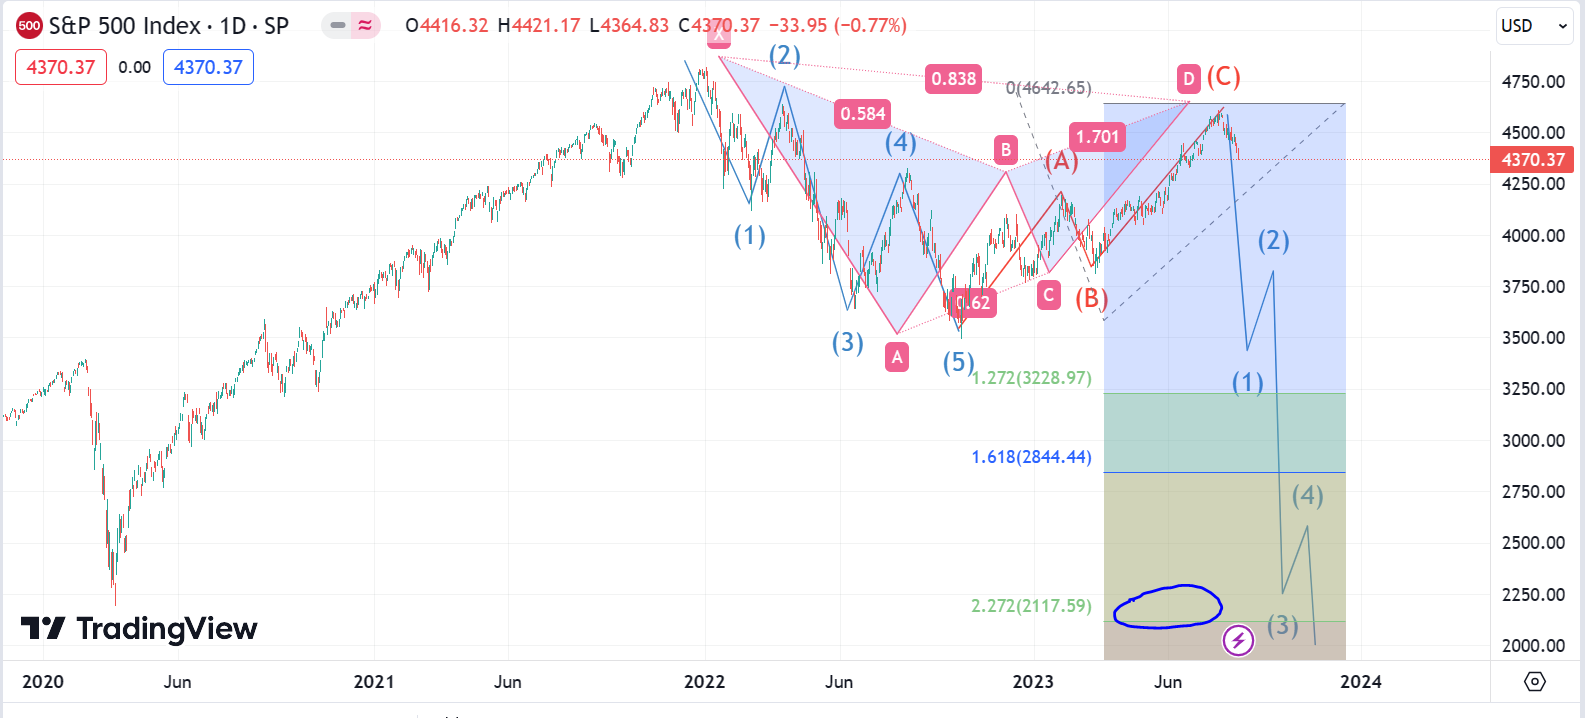
Cleaning my wavs up a bit the path would likely be 1.27 bounce. Retest of W structure low. Strong downtrend turning to capitulation under 1.61. Probably a sharp retest of 1.61 and then a final fast fall to the 2.20

The probability of the swings being much like this in a broad strokes overview is very high.
By this retest we could have a very strong sense that we were now on the verge of the market heading into what will make headlines as a crash.

A defining characteristic of this move will be there is no big pullbacks.

If this happens, on the local analysis of the trend (Which has to be defined as up,. 2022 did not break 2020) we are seeing a failed fifth. If we’re in the popping of a mega as described in the full macro bubble we’d be entering into a giant wave C. I can not overstate how significant that would be.

This would all be textbook perfect.
If it is going to play out by the book, we should see incredibly consistent selling. Ranges. The odd two leg spike out. But overall it’s just going lower.

If this is starting we need to act quickly because every opportunity we miss to enter into good setup rallies will mean we never get offered a better price later. It’ll be down trending.
The above point is particularly applicable to bull positions held!
My long standing stance on people investing has been they should exit the markets and just wait. Some time later they’ll be glad they did. That’s my opinion. I’ve been telling people that since SPX was around 4000 on the way up. The next big swing has speculative potential for bulls and a host of risk for bears but when we’re talking about investing rather than trading I think the risk has been too high for a while and at this point is intolerable.
I truly believe anyone holding here as an investor has no concept of the risk that holds. If the market has made a top of a 30 - 50 mega bull (Of which 2000 and 2008 were just features and won’t seem massive events in context) we’d be on the cusp of the ruin of the investing public.
Traders are always best to think about the ways they can reduce risk efficiently and where the chance of asymmetric gains are. Bears certainly have cause to be emboldened but would be wise to keep their wits about them while we’re around support levels for sudden spikes (Which can run multiple percent in a day).
Investors I think should be out. The overall risk is not worth it.
Whatever comes next, I doubt it’s going to be boring. A bear should see steady and consistent breaks. A bull will likely start with a wick candle, a bit of chop - a failed new low and then an impressive engulfing candle. This will feel like a “Sell the rip” but it’ll be the sellers that take the rip.

At this point the best thing to do is determine breakout levels and the next supports. Be short breaks and make reassessments at the next supports. If we get through 4300, it may well be we’re heading into a free-fall. The trend will be consistent and we can do well in it.
Consideration of a spike I’d consider urgent as we trade in the highest candidate areas (4400 which broke, 4300 and to some extent 4200/4350). How fast a spike move can go is surprising to me even when I know to expect it and I am used to dealing with them on much smaller charts.
The way in which a mega version would form is a mindboggling thought. On the other hand, hell hath no fury like a mega “C” leg who’s time has come.
Something dramatic looks set to happen.
The earliest and simplest bear reversal signal I taught was the 1.61 top. The rule that when a 1.61 fails to hold a break and price gets back under it this is when the crash begins. Selling is quite obvious from the outset but when viewed in a large context it’s very obvious this is where the overall crash began.

When the crash is over, this level can be seen to have been critically important.
I started to tell my followers about this while we were heading into high of 2021. Before we got to the 1.61 I was saying top comes 1.61 or 2.20 and if not, I’m not a bear because my theory is busted - And it came at 2.20. If the 1.61 fails, I will have little doubt we are in a true break.
And a note on that high forecast. I’ve a really good track record with bear forecasts if we use a measurement of if the market goes notably under where I call bear. By this measure, I have been successful on every single forecast apart from two levels during the 2020 rally (And I’ve not wrote them off yet).
But, with this I have absolutely never called the high perfectly first time. The closest I’ve come was with Doge in 2021 (Which I got second time with only one false start). The price I call is usually “A high”, but so often a spike comes. This is why I have trust issues with bull traps.
Now, technically, if this is a major high in SPX I’ve not called the high first time. It’s, IDK 7th or something. I think there’s been 7 big levels (Off these came 2018 crash, 2019, 2020 and 2022 - a few just gave me a bloody nose). But it would be first time relative to the 2021 rally.
I am currently pinpoint perfect on that. This used to make me very confident but I’ve learned confident is close to cocky and cocky is dangerous.
For my high forecast, I just used this fib. High to low of 2020. Using this I said what price SPX would not go over in mid 2021

.
If this turns out to be an ultra significant high - the fact I could do that with something so trivially simple is astonishing (Even to me, and it’s what all my work suggested would happen). If it is not, then the next level is 2.61 (And all of these ways to generate a spike target all converge at similar target levels).

There is very major cause for concern now. If this is classic simple Elliot wave our wave 1 lasted a whole year and it dropped 25%. Wave 3 would last several years and usually drop at least 1.5* times wave 1 (Usually more like 2.2). If you asked me to draw a textbook crash chart, I’d draw this. There’s cause for concern.
If you’ve followed me long enough you will have literally saw me drawing my approximation of a textbook crash that looks just like this.
We do have to be prepared for the break. Just mustn’t be complacent as bears.
Looks like a few charts missing at the bottom at the 3rd last and 2nd last paragraphs?